
Abstract
Abstract
Kurdziel, Marta, Jarosław Wasilewski, Karolina Gierszewska, Anna Kazik, Gracjan Pytel, Jacek Wacławski, Adam Krajewski, Anna Kurek, Lech Poloński, and Mariusz Gąsior. Echocardiographic assessment of right ventricle dimensions and function after exposure to extreme altitude: Is an expedition to 8000 m hazardous for right ventricular function? High Alt Med Biol 18:330–337, 2017.—Although the right ventricle (RV) is under great hypoxic stress at altitude, still little is known what happens to the RV after descent. The aim of this study was to evaluate RV dimensions and function after exposure to extreme altitude. Therefore, echocardiographic examination was performed according to a protocol that focused on the RV in 11 healthy subjects participating in an expedition to K2 (8611 m) or Broad Peak (BP, 8051 m). In comparison to measurements before the expedition, after 7–8 weeks of sojourn above 2300 meters with the aim of climbing K2 and BP, the RV Tei index increased (0.5 ± 0.1 vs. 0.4 ± 0.1; p = 0.028), and RV free wall longitudinal systolic strain (RVFWLSS) decreased (−23.1% ± 2.7% vs. −25.9% ± 2.4%; p = 0.043). Decrease in peak systolic strain and strain rate was observed in the basal and mid segments of the RV free wall (respectively: −24.4% ± 4.4% vs. −30.9% ± 6.5%; −1.4 ± 0.3 s−1 vs. −1.8 ± 0.3 s−1; −28.7% ± 3.9% vs. −34% ± 3.3%; −1.5 ± 0.2 s−1 vs. −1.9 ± 0.3 s−1; p for all <0.05). The linear RV dimensions, the proximal and distal RV outflow tracks, increased (respectively: 31.3 ± 4 mm vs. 29.2 ± 3 mm, p = 0.025; 27 ± 2.7 mm vs. 24.8 ± 3 mm, p = 0.012). We found that exposure to extreme altitude may cause RV dilatation and a decrease in RV performance. The Tei index and RVFWLSS are sensitive performance indices to detect changes in RV function after the exposure to hypoxic stress. The observed alterations seem to be a manifestation of physiological adaptation to high-altitude condition in healthy individuals.
Introduction
H
Hypoxic pulmonary hypertension may contribute to the development of subclinical or clinical high-altitude pulmonary edema (HAPE) even in healthy climbers (Maggiorini, 2003; Alleman et al., 2004). In HAPE-susceptible people, reduced RV performance under acute hypoxic stress is detectable (Hanaoka et al., 2011). Interestingly, acute RV failure may occur within the first 24 hours of exposure to altitude in occasional trekkers (Huez et al., 2007). It has been suggested that pulmonary vasculature reactivity varies among individuals. Susceptibility is probably genetically determined and may determine hypo-reactive and hyper-reactive responders to hypoxia (Grover et al., 1963; Maggiorini, 2003).
Echocardiography is a useful tool that gives insight into understanding heart muscle adaptation to hypoxic environment. Pressure in the pulmonary artery, as well as parameters of RV systolic function, can be evaluated in a non-invasive fashion with a precision that is nearly equal to invasive measurements (Taleb et al., 2013; Wang et al., 2013). Hence, in this study, we aimed at evaluating the effect of exposure to extreme altitude on the right heart by using not only standard echocardiographic methods but also the latest advances such as the tissue Doppler imaging (TDI)-derived Tei index and strain imaging in a group of subjects after an expedition to above 8000 m peak in the Karakoram, Pakistan.
Materials and Methods
Eleven Caucasian individuals (10 men, 1 woman) attempting to climb K2 (8611 m) or Broad Peak (BP, 8051 m) were analyzed in this study. Informed consent was obtained from the subjects, and the protocol was approved by the Human Studies Committee of the Medical University of Silesia. Most of the subjects were experienced climbers who had been at least once at an altitude above 7000 m, and on numerous occasions above 4000 m. No HAPE episodes in their climbing history were previously known. A few months before the expedition, they had trained 3–4 times a week for periods between 1 and 2 hours (mostly running, cycling, climbing).
Before the expedition, the endurance capacity of every subject was objectively evaluated by a cardio-pulmonary exercise test. The maximal oxygen consumption (VO2max) was measured during a maximal incremental exercise on a motorized treadmill T-2100 (GE Medical Systems Information Technologies, GE Healthcare, Inc., Milwaukee, WI), applying the Bruce protocol.
Blood samples were collected from the antecubital vein of the subject twice for blood counts and blood biochemistry (S-Monovette® and S-Monovette EDTA; Sarstedt AG & Co, Nümbrecht, Germany): first 2–3 weeks before departure and 8 ± 3 days after return from altitude above 2300 m. The samples for biochemical assessments were centrifuged at 3500 rpm for 15 minutes for the separation of the serum. Tests were performed by using Cobas® c501 analyzer (Roche Diagnostics) and Sysmex XE-2100™ analyzer (Sysmex Corporation).
A standard echocardiographic examination in all participants was performed twice by following American and European guidelines near sea level (Silesian Center for Heart Diseases, Zabrze, Poland): once 2–3 weeks to departure and 8 ± 3 days after return from altitude above 2300 m. Echocardiographic measurements were recorded on a commercially available ultrasound system Philips iE 33 that was equipped with an X5-1 phased array transducer (1–5 MHz; Philips Healthcare, Amsterdam, Holland) and Vivid S5 by using a 3S-RS phased array transducer (1.5–3.6 MHz; GE Healthcare, Inc.) and stored for offline analysis. Images were captured while subjects were in sinus rhythm, breathing quietly and lying in the left lateral decubitus position by two experienced echocardiographists.
Right ventricular linear diameters were obtained from a parasternal long axis view, parasternal short axis view, and apical four-chamber view. Right ventricular outflow tract (RVOT) dimensions were measured at the proximal/subvalvular level in parasternal long axis view and parasternal short axis view and at the distal/pulmonic valve level in parasternal short axis view, the RV inflow track was obtained from a four-chamber view. The M-mode cursor was placed through the tricuspid lateral annulus in the four-chamber view to assess the tricuspid annular plane systolic excursion (TAPSE). TDI was used to assess peak systolic excursion velocity (RV s′) with the pulsed Doppler sample volume placed in the basal segment of the RV free wall. The Tei index was calculated by using the Doppler tissue method from the four-chamber view. All time intervals were then measured from a single beat by pulsing the tricuspid annulus as previously shown (Rudski et al., 2010). The Tei index is defined as the ratio of tricuspid closure-opening time divided by ejection time. Using this method, Tei index >0.55 is considered abnormal (Rudski et al., 2010). In addition, right atrium (RA) area and volume were estimated from planar tracings of the RA internal endocardial border definition in the four-chamber view and RA pressure (RAP) measured by inferior vena cava (IVC) diameter and collapse during inspiration. IVC diameter was measured at end-expiration, proximal to the connection of hepatic veins and the ostium of RA (Rudski et al., 2010) in the subcostal view. In the constraints of our study, RAP was estimated to be 3 mmHg in the case of an IVC diameter ≤21 mm and a collapse >50%, of 15 mmHg when the IVC diameter was >21 mm and a collapse <50%, and of 8 mmHg in any other instance (Rudski et al., 2010).
Pulmonary artery systolic pressure (PASP) was quantified as the peak systolic tricuspid regurgitation jet velocity (v) recorded in the four-chamber view by using continuous-wave Doppler and the RV to RAP gradient was calculated by using the simplified Bernoulli equation (4v2), which does not take into account any changes in blood viscosity with differences in hemoglobin. With the inclusion of RAP, estimation was achieved by using the IVC collapsibility index. Pulsed-wave Doppler recordings were obtained by assessing the acceleration time (AccT) from a parasternal short axis view with the sample volume placed between the tips of the open pulmonary valve (Rudski et al., 2010).
The RV end-diastolic and end-systolic area were measured from the four-chamber view by planar tracing the internal RV endocardial border, and RV fractional area change (RVFAC) was calculated as RVFAC = ([RVEDA − RVESA]/RVEDA) × 100 where RVEDA, right ventricle end-diastolic area; RVESA, right ventricle end-systolic area. RV ejection fraction (RVEF) was estimated from two-dimensional (2D) methods and was calculated as RVEF = ([RVEDV − RVESV]/RVEDV) × 100 where RVEDV, right ventricle end-diastolic volume; RVESV, right ventricle end-systolic volume. The RVEDA was divided by the left ventricle end-diastolic area (LVEDA) to obtain the ratio RV/LV. The LVEDA was measured from the four-chamber view by planar tracing the internal LV endocardial border.
Systolic RV free wall longitudinal strain was determined from the four-chamber view focusing on the RV using the 2D Speckle Tracking Method (2D STE). Frame rate was optimized to >39 frames/s and reduced the depth to focus on the RV. These measurements were gathered from off-line analysis utilizing the 2D-strain Echo Pack speckle-tracking software (2D-strain Echo Pack software; GE Healthcare, Inc.). To establish a region of interest in the RV, the endocardial border was traced to optimize the line of myocardium thickness. Then, the tracking algorithm of the software was used to deduce the contours of endocardium and epicardium throughout the cardiac cycle. It could be manually adjusted to ensure a proper border. Peak longitudinal systolic RV free wall strain was gauged for the basal, medium, and apical segments from software-generated strain curves and averaged for a mean RV free wall longitudinal systolic strain (RVFWLSS) value. Strain rate (SR) represents the rate of deformation of myocardium over time (Rudski et al., 2010) and was derived from software-generated curves.
In addition, the linear internal diameter of the left ventricle was acquired in the parasternal long axis view obtained perpendicular to the LV long axis, and it was measured at the level of the mitral valve leaflet tips (Lang et al., 2015). The LV end-diastolic and end-systolic volumes were measured from the apical two- and four-chamber views by planar tracing of the internal LV endocardial border, and the left ventricular ejection fraction was estimated by the biplane method (Lang et al., 2015). All results are expressed as mean values ± standard deviation. Comparisons of measurements taken before from those obtained after the expedition were made by the Wilcoxon signed-rank test (Statistica 10; StatSoft, Inc., Dell Software). Statistical significance was determined at p < 0.05.
Results
The mean age of the study participants was 40 ± 8 years (range 30–60 years). All participants were free of severe cardiopulmonary diseases, except for a diagnosis of patent foramen ovale (PFO) in one subject, a 5-year history of well-controlled hypertension in another subject taking amlodipine, and reflex syncope and sinoatrial conduction disturbance in a third. No other medications were used except for women taking oral contraceptive pills. The time spent attempting to climb K2 (8611 m) or BP (8051 m) by individuals is shown in Table 1 and Figure 1.
BP, Broad Peak.

Profile of ascent K2 and BP individuals who participated in the expedition. During climbing, subjects were divided into small groups: K2 Group was formed by 3 climbers, BP Group 1 was formed by 3 climbers, BP Group 2 was formed by 3 climbers, BP Group 3 was formed by 2 climbers. BP, Broad Peak.
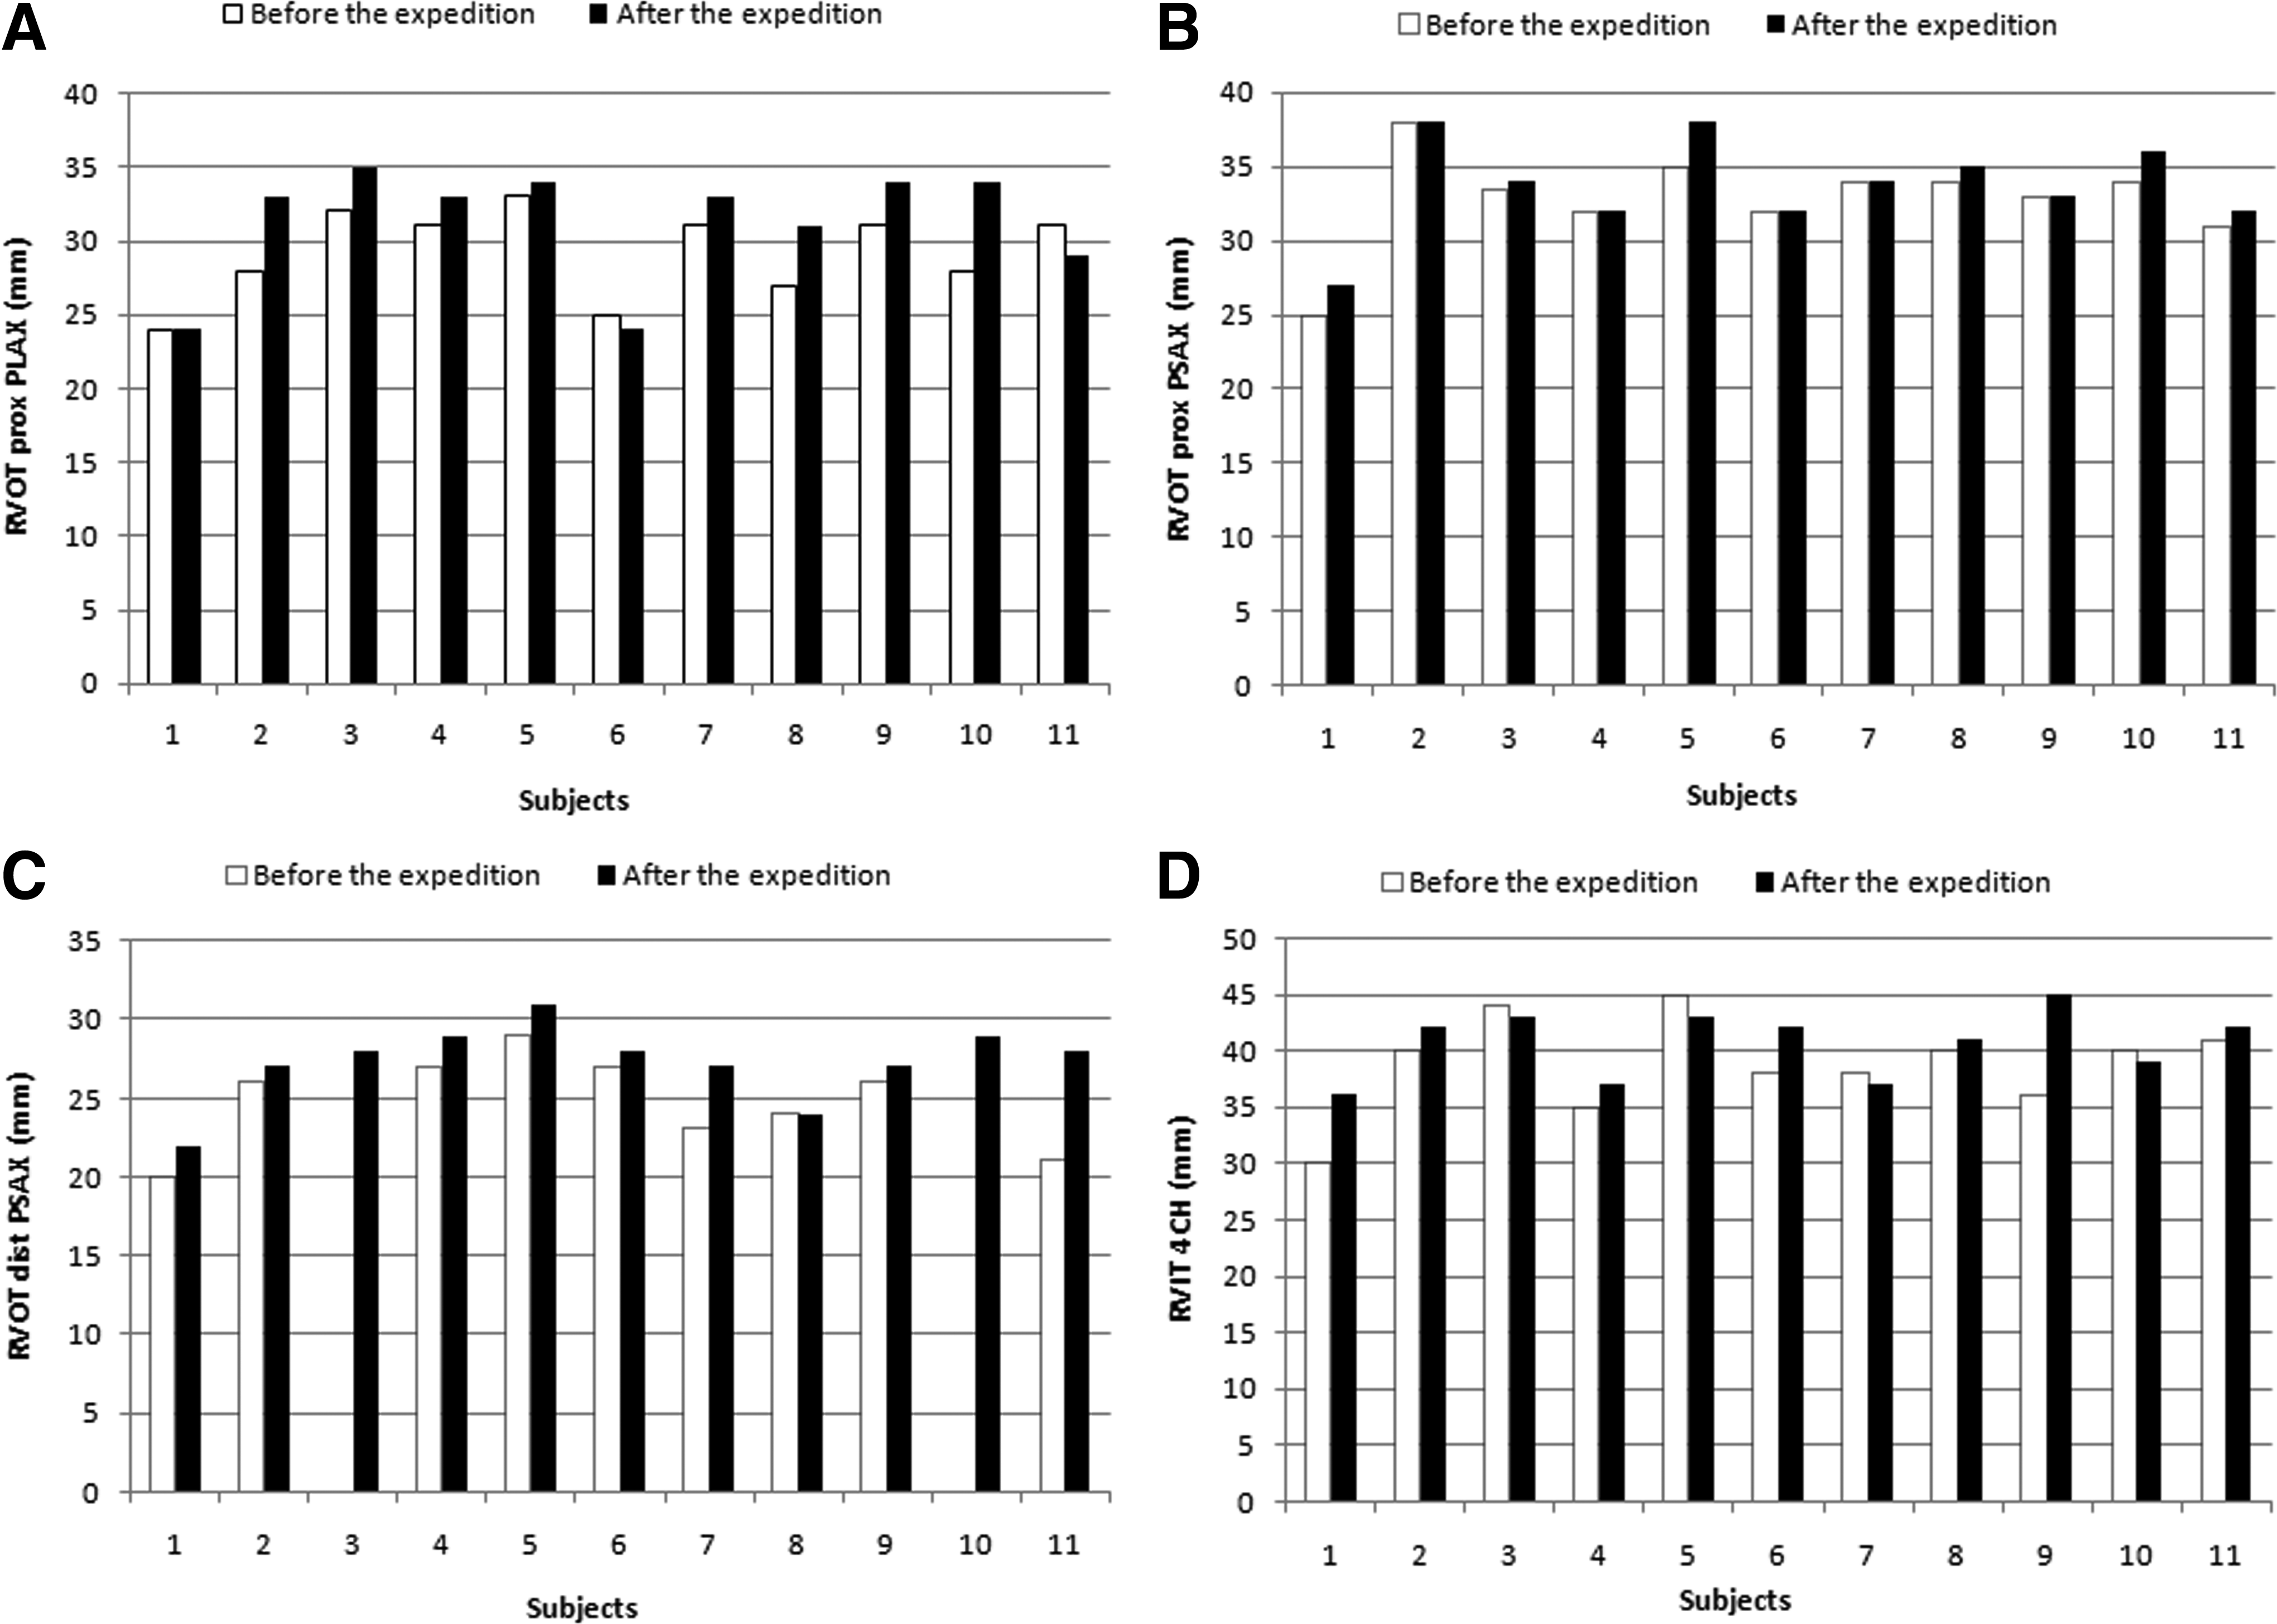
None of the subjects developed HAPE or any other severe form of altitude sickness. An individual with PFO suffered from a self-limited transient ischemic episode during climbing (Kurdziel et al., 2016). The clinical and laboratory values before and after expedition are presented in Table 2. Table 3 and Figure 2A–D show the RV linear diameters from multiple acoustic views. No significant changes in TAPSE, RV TDI-derived RV s′, RVEF, and RVFAC were observed. The Doppler tissue-derived Tei index significantly rose after the exposure to extreme altitude (0.51 ± 0.07 vs. 0.44 ± 0.1, p < 0.05) (Table 4). No significant changes were found in diastolic RV function. Interestingly, in our study, after returning from altitude we did not observe an increase in PASP 19.1 ± 6.7 mmHg versus 17.9 ± 6.3 mmHg, p = ns. AccT did not change after returning from the expedition in comparison with pre-expedition values (128.2 ± 14.1 ms vs. 128.2 ± 14.0 ms, p = ns).
Echocardiographic right ventricle linear dimensions in every subject obtained before and after the expedition:
Data are expressed as mean (SD).
p-Value <0.05 between after the expedition and before the expedition.
BMI, body mass index; BSA, body surface area; DBP, diastolic blood pressure; Hb, hemoglobin; Hct, hematocrit; HR, heart rate; RBC, red blood cells; SBP, systolic blood pressure; SD, standard deviation; VO2max, maximal oxygen uptake measured in cardiopulmonary exercise test; WBC, white blood cells.
Data are expressed as mean (SD).
p-Value <0.05 between after the expedition and before the expedition.
LV, left ventricle; RAA, right atrial area; RV, right ventricle; RVEDA, right ventricular end-diastolic area; RVESA, right ventricular end-systolic area; RVIT 4CH, right ventricle inflow track in apical four-chamber view; RV/LV, ratio of RV end-diastolic area to LV end-diastolic area; RVOT dist PSAX, distal right ventricular outflow tract in parasternal short axis view; RVOT prox PLAX, proximal right ventricular outflow tract in parasternal long axis view; RVOT prox PSAX, proximal right ventricular outflow tract in parasternal short axis view.
Data are expressed as mean ± SD.
p-Value <0.05 between after the expedition and before the expedition.
RVEF, right ventricle ejection fraction; RVFAC, right ventricle fractional area change; RV s′, systolic excursion velocity measured with the pulsed Doppler sample volume placed in the basal segment of the right ventricle free wall; TAPSE, tricuspid annular plane systolic excursion; TDI, tissue Doppler imaging.
A significant decrease in RVFWLSS after coming back from the expedition was assessed. The same was found in systolic SR in medial and basal segments of the RV free wall (Table 4). Table 5 presents LV echocardiographic measurements.
Data are expressed as mean ± SD.
LVEDV, left ventricular end-diastolic volume; LVESV, left ventricular end-systolic volume; LVEF, left ventricular ejection fraction.
Discussion
In our study, we ascertained that exposure to high altitude during expeditions lasting 7–8 weeks induces changes in RV morphology and performance. The results show that a short time after returning from heights (as assessed by 2D echocardiography, Doppler echocardiography, pulsed TDI, and 2D speckle tracking echocardiography), there is RV dilation and worsened systolic function, although no individuals developed HAPE while at high altitude and none had the abnormal PASP.
We did not find significant differences in PASP before and after mountaineering, whereas a marked elevation of PAP occurs in fit climbers during an acute high-altitude exposure (Boussuges et al., 2000; Alleman et al., 2004; Bernheim et al., 2007). The underlying mechanism of the high-altitude pulmonary hypertension involves not only sustained and exaggerated pulmonary vasoconstriction but also remodeling of the pulmonary vascular wall (Penaloza and Arias-Stella, 2007). In altitude dwellers who reside at lowlands, a reduction in PAP needs some time to normalize because of the slow involution of the anatomical change of pulmonary vessels, but it is not completely normalized even after 2 years at low altitude (Sime et al., 1971).
The elevated PAP with RV enlargement was observed in the echocardiographic examination after air lift to low altitude in individuals who failed to acclimatize to extreme altitude (Anand et al., 1990). It was reported that 10%–20% of soldiers who engaged in strenuous exercise at 5800–6700 m for several months (mean 17 weeks) suffered from subacute mountain sickness with symptoms of right ventricular failure. All changes resolved after 3–4 months (Anand et al., 1990). Interestingly, another study performed in workers commuting between an elevation of 3700 and 4200 m (4-week working shift) and low altitude, below 500 m (4 weeks of holiday) revealed that intermittent exposure to 4000 m over 3 years does not lead to development of permanent pulmonary hypertension (Sarybaev et al., 2003). Our research corroborates these effects of altitude on RV indices. It seems that 2 months of exposure to altitude is presumably too short to induce a lasting structural modification of pulmonary vessels in healthy individuals normally living at low altitude.
Tei index appears to be a useful noninvasive means that correlates with symptoms and survival in patients with primary pulmonary hypertension (Tei et al., 1996). An elevated systolic PAP was reported in patients with chronic mountain sickness, defined as having hemoglobin concentrations >210 g/L (Maignan et al., 2009) for people living permanently at altitudes >3000 m. In such individuals, a higher Tei index was noted, which might reflect early right ventricular impairment (Maignan et al., 2009). In a study performed by Pagé et al. (2013) in individuals living at low altitude participating in a trekking expedition aiming at climbing to a 6235 m peak, RV Tei index was shown to be increased at altitude. Several weeks after return, the values reverted to normal (Pagé et al., 2013). Huez et al. (2009) also found that in acclimatized lowlanders the Tei index was increased at altitude with a higher PAP, but with maintenance of other indices of RV systolic function such as TAPSE and tricuspid S wave.
We noticed higher values of the Tei index after altitude exposure, but we did not find an excessive increase in hematocrit so that subjects did not met the time criteria of chronic mountain sickness (Maggiorini, 2003). High-altitude pulmonary hypertension is a precapillary phenomenon leading to increased afterload (Maggiorini et al., 2001) for the RV that must face a higher workload demand. That may result in decreased RV performance as reflected by elevated Tei index even after returning from high altitude. Hanaoka et al. (2011) reported a significantly increased RV Tei index in HAPE-susceptible subjects, but not in HAPE-resistant individuals when exposed to acute hypoxia. It may be that the subjects investigated in our study were HAPE resistant, since no episodes of HAPE occurred in their previous climbing. Hence, we present the first results of an altered Tei index after the exposure to extreme altitude in HAPE-resistant individuals. The lack of illness symptoms and values within normal ranges for the Tei index (Rudski et al., 2010) suggest adaptation rather than RV impairment.
There are limited number of reports on strain analysis in professional alpinists or individuals going to extreme altitudes. It was demonstrated that in a cohort of pulmonary hypertensive patients, RV free wall strain is a reproducible variable with excellent agreement at clinically relevant thresholds (Levy et al., 2013) and is a good predictor of RV function (Fukuda et al., 2011). Stembridge et al. (2014) reported an RV longitudinal strain peak reduction after a short-term high-altitude exposure and in high-altitude dwellers in comparison to measurements at sea level. In the deformation analysis, we found a decline of strain values such as the RVFWLSS after returning from altitude exposure. That is consistent with previous studies, where in 14 healthy individuals RV free wall longitudinal strain, after descent from altitude, was lower in comparison with initial values, however without statistical significance (Pagé et al., 2013).
Our research methods permit the detection of a significant change of RVFWLSS and alterations in segmental systolic strain of RV free wall after high-altitude exposure. The findings may be subsequent to altitude exposure where a reduced value of RV free wall systolic strain and RV global strain have been documented (Pagé et al., 2013; Stembridge et al., 2014). These results indicate increased stresses to the thin RV wall, which is susceptible to pressure overload, Measurements of RVEF with the use of longitudinal strain are reliable methods since 80% of total stroke volume of the RV is generated by longitudinal shortening (Carlsson et al., 2007). We observed, as shown by Teske et al. (2009) in endurance athletes, reduction in not only RVFWLSS but also a decrease in the regional strain of the basal, mid, and apical RV segments. In that study, it was apparent in athletes with RV dilatation. Our research is in agreement with this observation but applies to alpinists exposed to extreme altitudes.
The mechanism of why RV decline occurs is still not clear. An increase in afterload, as occurs during stay at altitude, magnifies wall stress (Mor-Avi et al., 2011). The additional ischemic effects of hypoxia, microvascular endothelial cell dysfunction, or myocyte apoptosis due to hypoxemic exposure may contribute to RV systolic function deterioration as it does in pulmonary artery hypertension (Badano et al., 2010). Moreover, Archer et al. (2013) describe mitochondrial-metabolic abnormalities in an animal model of pulmonary arterial hypertension that result in a glycolytic shift, which may reduce RV myocyte contractility. Not only metabolic changes but also activation of the sympathetic nervous system with physical exercise of mountaineering may worsen RV systolic function. However, downregulation of β-adrenergic receptors as an adaptation to limit the influence of sympathetic activity on the heart (Antezana et al., 1992; Ponchia et al., 1994) may be involved as well. Nevertheless, demanding hypoxic conditions can still cause deterioration in RV function. After the return to low altitude, we observed a higher resting heart rate in comparison with the values before the expedition, which may indicate a persistent shift to increased adrenergic activation, which usually occurs at altitude. That can additionally increase RV workload.
Conclusions
After being subjected to extreme stresses of climbing above 8000 m, HAPE-resistant individuals show changes in RV linear dimensions, altered RV performance indices, and RV deformation parameters with normal PASP. Alterations in cardiac morphology and function seem to be within the range of physiological adaptation to high altitude and are evident even after 1 week on return to low altitude.
Since most of the subjects were several times at extreme heights and did not complain of any symptoms indicating right heart failure during the last expedition, we hypothesize that PASP measured after altitude exposure may be a reliable predictor for the preserved or permanent structural remodeling of pulmonary vessels in healthy, HAPE-resistant individuals. Further investigation must be undertaken to confirm this phenomenon. In healthy individuals regularly at high altitudes, echocardiographic examination as a noninvasive, accurate, and reproducible method for initial and serial assessment of right ventricular function can yield valuable information.
Study limitations
There are several potential limitations of this study, including the relatively small group of investigated individuals and underrepresentation of women. The echocardiographic parameters were not assessed in a blinded fashion nor did we make any measurements before return to low altitude. Moreover, every expedition to climb 8000 m peaks has a particular acclimatization pattern of exposure to extreme altitude. Therefore, the data of this study may not be readily extrapolated to all individuals returning from mountain environments. However, our research brings additional insight to understanding the heart's response to hypoxia and may be a guide for such an assessment.
The Echopack PC software used in this study is dedicated to LV strain analysis, and we adapted its use for the RV. To the best of our knowledge, the RV-specific strain analysis software has not yet been developed so we applied a 2D STE program for the LV strain to analyze the RV free wall strain. The normal 2D STE strain and SR values have not been well determined. Our study does not validate the ranges but gives insight into relative changes after altitude exposure. Moreover, left ventricle diastolic dysfunction may occur in some subjects and this needs further studies.
Lack of hemodynamic data for PASP is another limitation of our study; however, it has been previously shown that echocardiographic assessment of PASP correlates well with right heart catheterization (Taleb et al., 2013; Wang et al., 2013). In our study, we focused on multiple echocardiographic indices of RV performance as an accurate, low-cost, feasible method for RV function evaluation; however, it must be remembered that currently magnetic resonance imaging is the gold standard for calculating RV volumes and ejection fraction.
Footnotes
Author Disclosure Statement
No competing financial interests exist.