
Abstract
Abstract
Karinen, Heikki M., and Martti T. Tuomisto. Performance, mood, and anxiety during a climb of Mount Everest. High Alt Med Biol. 18:400–410, 2017.
Background:
Various studies have shown the deleterious effects of high-altitude hypoxia on visual, motor, somatosensory, cognitive, and emotional function and also in intelligence tests, reaction time, speech comprehension, hand steadiness, visual contrast discrimination, and word association tests. Because optimal cognitive abilities may be crucial for mountain climbers' safety, this study was intended to evaluate the changes in cognitive performance, mood, and anxiety during an Everest expedition lasting almost 3 months.
Methods:
A set of physiological (Lake Louise score, oxygen saturation), cognitive (Colorado perceptual speed [CPS] test, number comparison [NC] test), and emotional measurements (Profile of Mood States, anxiety responses, psychological inflexibility) were collected from nine climbers on a partly unsupported Mount Everest expedition at various time points during the course of the expedition at Everest Base Camp (EBC). For confidence intervals we used 95% simultaneous Bonferroni corrected interval (BCI) for the differences.
Results:
During this expedition, the estimates of trait anxiety decreased 13% toward the end of expedition after successful summiting (p = 0.004). Simultaneously, fatigue appeared to diminish and the CPS speed results improved 13%. Most expedition members suffered mild symptoms of acute mountain sickness during the first days in the EBC, but this did not affect the speed or the number of mistakes made in the CPS or NC tests. In CPS test the differences between pretest and the physically most demanding period (EBC4, BCI: 0.01, 4.43) and between EBC1 and EBC4 (BCI: 0.57, 4.99), between EBC2 and EBC4 (BCI: 0.45, 4.88), and between EBC3 and EBC4 (BCI: 1.12, 5.55) were significant, showing ever improving results during the expedition.
Conclusion:
The most important finding in this study was that well-motivated and trained, self-selected individuals, who volunteer for a long-duration mission, are capable of maintaining high levels of performance, steady mood state, and a good level of vigor on a Mount Everest expedition lasting nearly 3 months.
Introduction
T
Exposure to high altitude further induces disturbances in mood and performance, and alterations in intellectual functions, especially reasoning, emotional processes, and sensorimotor skills (Hornbein et al., 1989; Hornbein, 1992; Bahrke and Shukitt-Hale, 1993). The amount of cognitive impairments at high altitudes is related to the chronicity of exposure. Acute exposure usually refers to a duration of several weeks, whereas chronic exposure usually refers to “extended permanence” in the high altitude environment (Virués-Ortega et al., 2006). Changes in cognitive performance with altitude appear to have a different time course from those of acute mountain sickness (AMS) symptoms, behavior, and mood disturbances (Shukitt-Hale et al., 1991; Abraini et al., 1998). Impaired cognitive performance is certainly notable during acute exposure to high altitudes, whereas simulated gradual ascents have found no significant cognitive impairments below 7000 m (Townes et al., 1984; Kennedy et al., 1989). Shohei et al. examined cognitive function and cerebral oxygenation during prolonged exercise under hypoxia at simulated altitude (fraction of inspired oxygen: 0.141), and found a correlation between impaired task performance on simple color-word Stroop task and cerebral oxygenation (Shohei et al., 2016). In the existing research, cognitive performances have been evaluated with psychological experiments utilizing various tasks, but only few field studies exist reporting the cognitive effects of a gradual ascent (Harris et al., 2009; Issa, 2016) or prolonged exposure to high altitude during Mount Everest expedition (Grocott et al., 2010).
In the present study, cognitive and motor investigations were conducted on nine climbers participating in an 80-day climbing expedition on Mount Everest (8848 m). Our hypotheses were that nearly 3 months' exposure to the hypoxic environments and physiological and psychological stress of high-altitude expedition induce behavioral and mood disturbances and other alterations in psychological functions.
Materials and Methods
Subjects
Nine experienced male climbers participated in a series of studies related to both physiological and psychological patterns and processes of adaptation to chronic hypoxia. The climbers were selected according to criteria, including experience of mountaineering, completed military service in the Finnish Parachute Regiment, and motivation. Preclimb biomedical test batteries were also administered. All the climbers scored within normal range and were healthy. The age range was 27–45 years (mean = 37.6, SD = 5.5), height 1.69–1.87 m (mean = 1.78 m, SD = 7.0 cm), weight 67–91 kg (mean = 78.9, SD = 8.2), BMI 22.5–29.1 (mean = 25.6, SD = 2.6), and maximal oxygen uptake (O2max) 45–67 mL/kg/min (mean = 56.4, SD = 6.4) (Table 1). All had participated in several high-altitude expeditions over 6000 m and four in expeditions over 8000 m. All subjects had tertiary-level education and four had an academic bachelor's degree or a degree in medicine. All subjects were resident at low altitudes, and none had traveled to altitudes of 500 m or higher in the 6 months before the expedition. All subjects were naive to the cognitive tests utilized. Exclusion criteria were current illness, including severe altitude illness (high-altitude cerebral or pulmonary edema, or severe AMS). The study was approved by the Ethics Committee of Pirkanmaa Health Care District, and the subjects provided written informed consent before participation.
Age years, weight (kg), height (cm), and the max altitude reached (m).
BMI, body mass index; SD, standard deviation.
Study design, profile of ascent, and test administration
The profile of the ascent of the expedition and the schedule for test sessions and altitudes are illustrated in Figure 1. The expedition was partly an unsupported expedition, meaning that the members of the expedition carried all the equipment for higher camps above the Nepal side Mount Everest Base Camp (EBC) by themselves. The members of the expedition crossed the Khumbu glacier in total 98 times and the Lhotse face 43 times.

Ascent profile of the climb. Sleeping altitudes are marked with circles and tests with triangles.
Measurements of performance in psychomotor ability and intellectual efficiency, assessment of mood states, and anxiety reactions were made in Kathmandu 2 days before the expedition started the trek toward EBC at day 2 (d2, preclimb measurements in Kathmandu), and then four times at EBC at 5300 m. The first, on d16, 2 days after arrival at EBC, when all altitude-related symptoms had disappeared, the second on d34, 2 days after setting up camp 3 at 7100 m, the third on d43, after 4 days' rest at EBC, and the fourth on d62, 4 days after successful summiting, and 2 days after emptying all other camps, a day before starting the home trek. The post testing was done in Kathmandu after 4 days' rest d69. Test sessions were performed between 10:00 a.m. and 12:00 p.m. in the testing tent (“Half Dome”) with the climbers seated at a table. Before each test, all study subjects had spent at least 3 days at EBC and resting. Previous night's rest was at least 7 hours. Between the tests, subjects had a 5-minute break walking outside the tent. To minimize the effect of learning, the test forms were new in every test.
Assessment of AMS, sleep quality, and altitude-related symptoms
Self-reported symptoms of AMS were monitored daily during the expedition up to d34, and after that, 3 days before each cognitive test day. Subjects completed the questionnaire in the morning throughout the expedition using the Lake Louise AMS scoring system (LLS; Hackett and Oelz, 1992). LLS consists of five questions about headache, gastrointestinal symptoms, tiredness, dizziness, and sleep quality. LLS has a range from 0 to 3, with 0 meaning no symptoms at all and 3 meaning severe symptoms. A total score of 3 and above was used to establish the diagnosis of AMS. Sleep quality was assessed on four levels: (1) sleeping was as good as usual, (2) not as good as usual, (3) several wakeups, (4) bad sleeping and could not sleep at all.
Assessment of mood states and anxiety responses
Mood states were assessed using a short Finnish version of the Profile of Mood States self-report questionnaire (POMS; original McNair et al., 1971, 1981). WHO has recommended POMS for behavioral toxicology (Johnson, 1987). The Finnish version (Hänninen, 1989) consists of 38 adjectives; each rated on a five-point scale. It clusters into the following eight mood subscales: tension (4 items), fatigue (3 items), forgetfulness (3 items), vigor (6 items), depression (7 items), irritation (7 items), slackening (3 items), and insecurity (5 items).
State and trait anxiety were assessed using the Y1 and Y2 form of the Spielberger State-Trait Anxiety Inventory (STAI; Spielberger et al., 1983), which is a self-report questionnaire consisting of 20 items, each scored on a four-point scale. The subject indicates the strength of feeling about items such as “I feel calm,” “I feel tense” on a four-point scale from “Not at all” to “Very much so.” For scoring, extremely nonanxious responses are allocated one point and extremely anxious responses, four points, which gives a scoring range of 20–80 on each of the questionnaires. The major difference between the subscales is the instruction: For the trait version, which is concerned with those characteristics of the individual that are persistent and stable, the subject indicates how he feels generally. For the state questionnaire, which is concerned with transient aspects of anxiety, the subject indicates how he feels right now. A-trait and A-state need not be related, as, for example, when a normally calm individual (low A-trait) exhibits anxiety reactions (high A-state) in circumstances that he perceives to be stressful. The two subscales allow measurement of the relationship between transient and dispositional anxiety reactions, as well as the links between these measures and performance.
The Acceptance and Action Questionnaire-II (AAQ-II) is a self-report measure of psychological inflexibility or experiential avoidance (Bond et al., 2011). It consists of seven questions with a seven-point scale from “Never true” to “Always true.” Thus, the questionnaire has a scoring range of 7–49. Higher scores equal greater levels of psychological inflexibility. Psychological inflexibility could interfere with adaptation to difficult circumstances.
Cognitive testing–perceptual-motor performance
Attention and perceptual accuracy were assessed using two tasks. The first task was the Colorado perceptual speed test (CPST; DeFries et al., 1997). CPST is a test in which the subject is provided with a sheet of combinations of four or more letters. The subject has to pick as many similar combinations of letters to a target stimulus as possible during 1 minute.
The second task was the number comparison test (NCT; Engum, 1984). In the NCT, the task is to pick as many faulty combinations of numbers as possible compared with a target stimulus during 1 minute. The test measures speed and accuracy. Both tests, the CPST and the NCT, were performed at intervals of 2 weeks during the expedition.
Data presentation and statistical analyses
For our statistical analyses of small sample repeated measures data, we used the program XPro 5.1 (Weerahandi, 1994) to analyze exact differences in means between the different phases of the expedition in repeated measures ANOVA and differences in means in T-tests. For confidence intervals we used 95% simultaneous Bonferroni corrected interval (BCI). SPSS 24.0 was used for other statistical analyses. The level of statistical significance was set at 5% throughout the study.
Effect sizes and power calculations reported were computed using NQuery Advisor 4.0. The effect size measure of the repeated measures ANOVA was Glass' Δ. This measure is used as an index of the size difference expected between the observed means.
Results
Four out of nine climbers reached the summit of Everest (8848 m), all with oxygen supplementation. The maximum altitudes reached for each climber are shown in Table 1. The supplementary oxygen was used only in the evening of d57 at camp 4 (8100 m) and during the climb from camp 4 to the summit and back to camp 4 in d58. The total prevalence of AMS at altitudes of 2400–5300 m was 89% (8/9 subjects) in the whole study group. The first AMS case was at 4290 m altitude (subject 1) and the other seven occurred when the group arrived at EBC. Most cases were mild and all symptoms disappeared in 1–2 days, except for subject 1, who took five more days to reach EBC due to acclimatization problems. He did not take part in the first tests but joined in later. All climbers completed the questionnaires four times during the expedition. The subjects slept well during the expedition. The average LLS score was 0–1. The mean was 0.3 except for the first 2 days at EBC, where two subjects reported several wake ups and poor sleep quality. After that, at EBC, all subjects slept well.
Profile of mood states
Tension was very low during the expedition (0.3–0.8). At the beginning it was 0.7 and at its lowest just after reaching the EBC (0.3). Tension was at its peak during the week of summiting (0.8) and decreased to a level lower than at the start when the expedition returned to Kathmandu (0.5). Tests of within-subjects contrasts of tension factor in repeated measures ANOVA revealed a quadratic, approximately u-shaped trend (F = 14.42, p = 0.005). The means of the phases differed marginally (F = 2.32, p = 0.078). The beginning of the expedition differed from EBC1 (BCI: −0.90, −0.05). Likewise, EBC1 differed from EBC4 (BCI: 0.07, 0.93). The other comparisons were not statistically significant.
Fatigue appeared variably (1.0–2.1) during the expedition. Fatigue had initially been associated with the preparations for the expedition and with the flight to Kathmandu and appeared as tiredness (1.6), which, however, was at its lowest (1.0) immediately after the arrival to the basic camp despite a 9-day trek in the mountains. Fatigue was at its peak in the summit week (2.1) and returned to the starting level after the return to Kathmandu (1.5). An almost linear upward (F = 4.65, p = 0.063) and a u-shaped quadratic (F = 6.94, p = 0.03) trend were found in the within-subjects comparisons of fatigue. For fatigue, the means of the phases differed (F = 4.16, p = 0.008). EBC1 and EBC4 differed (BCI: 0.56, 1.74) as well as EBC2 and EBC4 (BCI: 0.19, 1.37) and EBC3 and EBC4 (BCI: 0.15, 1.33).
Forgetfulness reflects the functioning of short-term working memory. At the beginning (0.7), it may have been associated with the stress and the preparations of the expedition and the flight to Kathmandu. After reaching EBC, forgetfulness was very low (0.3–0.07) reflecting the high level of vigor when the expedition concentrated its focus on setting up the other camps and summiting. A linear downward (F = 9.81, p = 0.014) and a quadratic upward (F = 5.62, p = 0.045) trend were found in forgetfulness. The means of the phases in forgetfulness differed (F = 4.95, p = 0.003). The premeasurement (“baseline” measured in Kathmandu) differed from all other occasions (BCIs: −0.78, −0.11; −0.89, −0.22; −0.89, −0.22; 1.00, −0.33 for EBC1, EBC2, EBC3, and EBC4, respectively).
Vigor was maintained at a good level (2.6–3.0) throughout the expedition, being at its peak immediately after arrival (3.0) at EBC. Tests of within-subjects contrasts for vigor showed no significant effects. Differences in the equality of means of the phases in general were found (F = 1.17, p = 0.034). The Bonferroni interval between EBC1 and EBC2 showed difference (BCI: −0.81, −0.00065).
Depression was extremely low during the whole expedition (under 0.06) and, for example, the unsuccessful summit attempts did not manifest as an increase in depression. Within-subjects contrasts for depression were not statistically significant. In addition, no differences in depression emerged during the different phases of the expedition (F = 0.47, p = 0.76).
Irritation also was extremely low (under 0.5) during the expedition. It was quite low (0.4) at the very beginning of the expedition and at its highest in the summit week (0.5). The unsuccessful summit attempt of the five climbers influenced this. Overall, irritation was low during the expedition. A quadratic u-shaped trend emerged for irritation (F = 7.85, p = 0.023). Differences between the occasions were found (F = 4.18, p = 0.008). The premeasurement differed from EBC1 (BCI: −0.58, −0.06) and from EBC3 (BCI: −0.55, −0.02). In addition, EBC1, EBC2, and EBC3 differed from EBC4 (BCIs: 0.17, 0.69; 0.04, 0.56, and 0.14, 0.66, respectively).
Slackening is inversely proportional to vigor. It was minor during the whole expedition (under 0.5) and reflected the high motivation and good team spirit of the members of the expedition. A linear downward trend in slackening was found (F = 6.57, p = 0.039). Significant differences in the equality of means for slackening in general were not found (F = 1.92, p = 0.13); however, the premeasurement was different from EBC4 (BCI: −0.59, −0.08).
Insecurity was extremely low during the whole expedition (under 0.2) and it did not vary at different stages of the expedition. No trends in within-subject contrasts and no differences between the occasions were found (F = 0.29, p = 0.88; Fig. 2). The POMS scores and standard deviations are presented in Table 2.
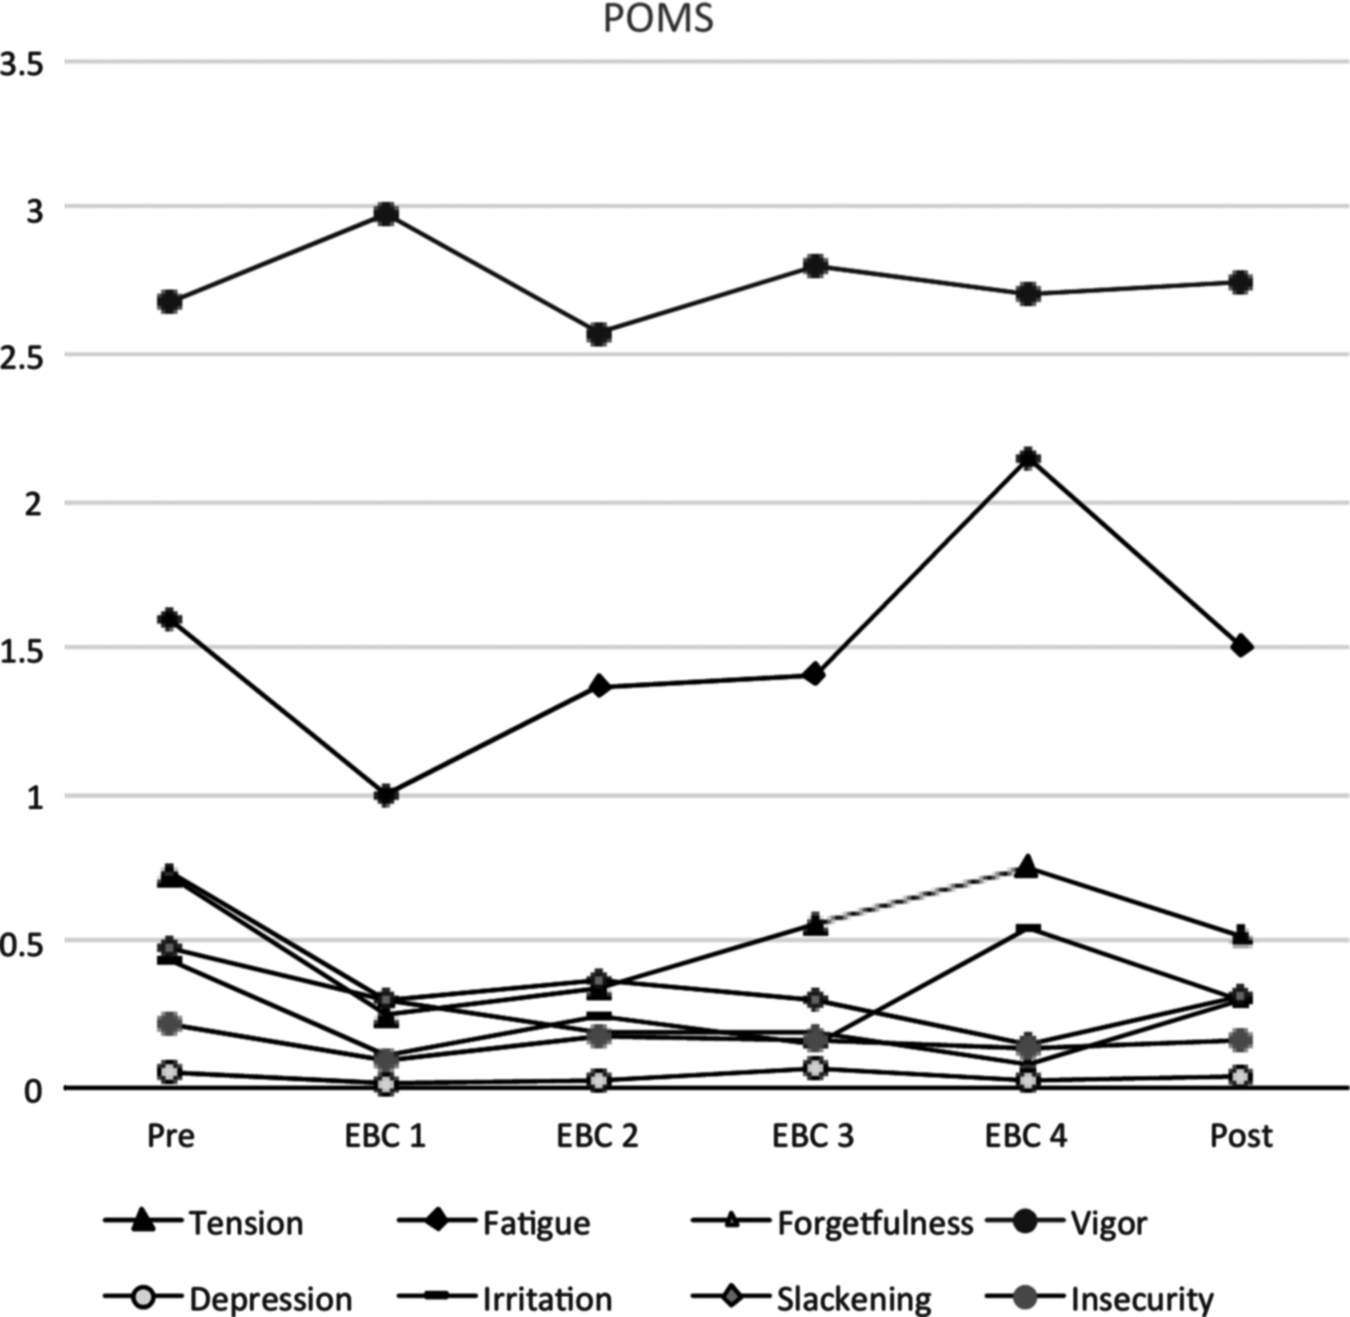
Profile of mood states. Pre- and posttests were done in Kathmandu and other tests at EBC at different phases of the expedition. EBC, Everest Base Camp.
EBC, Everest base Camp.
Anxiety responses (STAI)
The individual climbers' STAI test scores of state anxiety are presented in Table 3. State anxiety was at its highest at the beginning of the expedition and diminished after reaching EBC (Fig. 3). Tests of within-subjects contrasts indicated an almost linear downward trend (F = 4.57, p = 0.065) and a cubic trend (F = 6.30, p = 0.036). Differences in the equality of means for state anxiety were found (F = 2.90, p = 0.037). The beginning of the expedition differed from EBC1 (BCI: −8.43, −1.57) and EBC4 (BCI: −8.21, −1.35). In trait anxiety, a downward linear trend also was found (F = 15.36, p = 0.004). Differences emerged between the means (F = 4.29, p = 0.007). The premeasurement differed from EBC2 and EBC3 (BCIs: −4.27, −0.62; −4.50, −0.84; and −5.27, −1.62, respectively). In addition, EBC1 was different from EBC4 (BCI: −3.72, −0.06). The development of trait anxiety is shown in Figure 4. The average trait anxiety scores of the group were lower than in normal population (Spielberger et al., 1983: normal population value for working men = 35.72; M = 23.4, SE = 0.76), which reflects the group's better-than-normal level of stable anxiety (t = −16.26, p < 0.000; 95% symmetric CI for mean 21.61, 25.12).
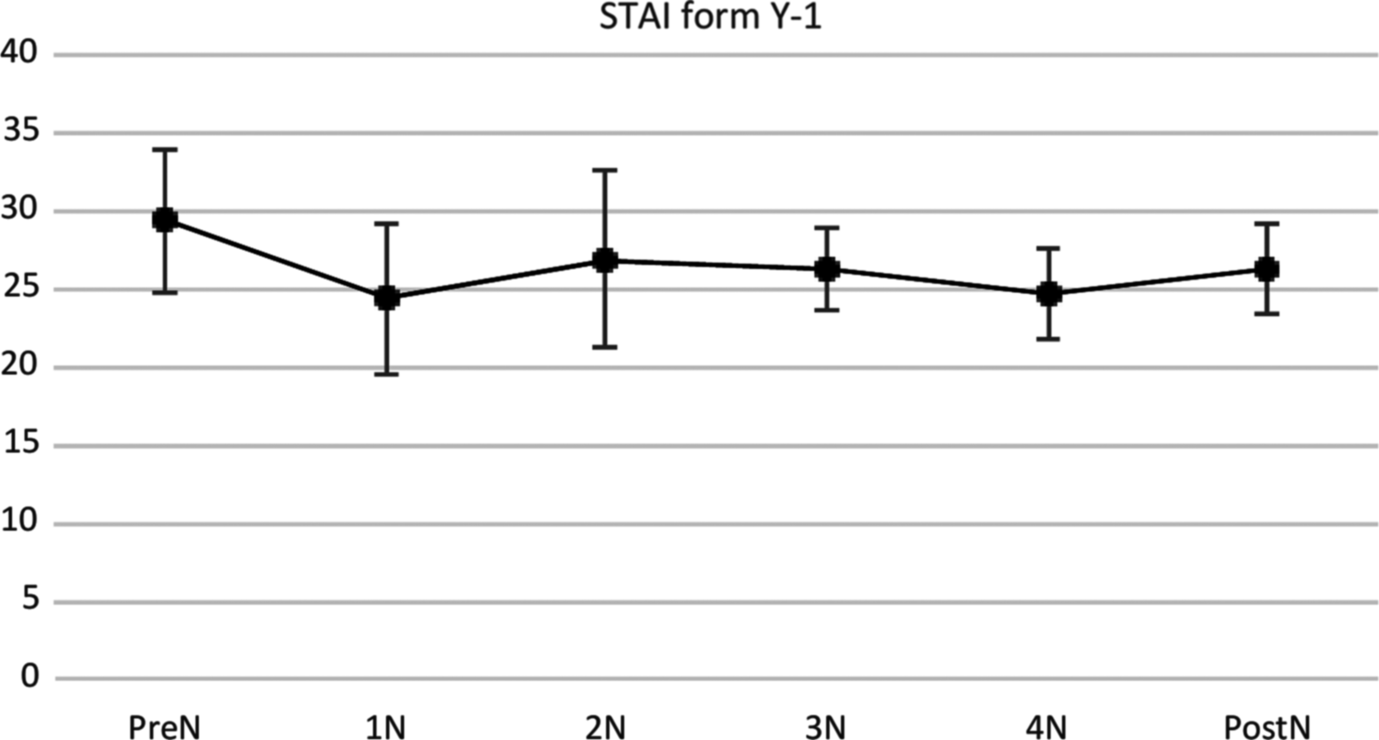
State anxiety at different phases of expedition.
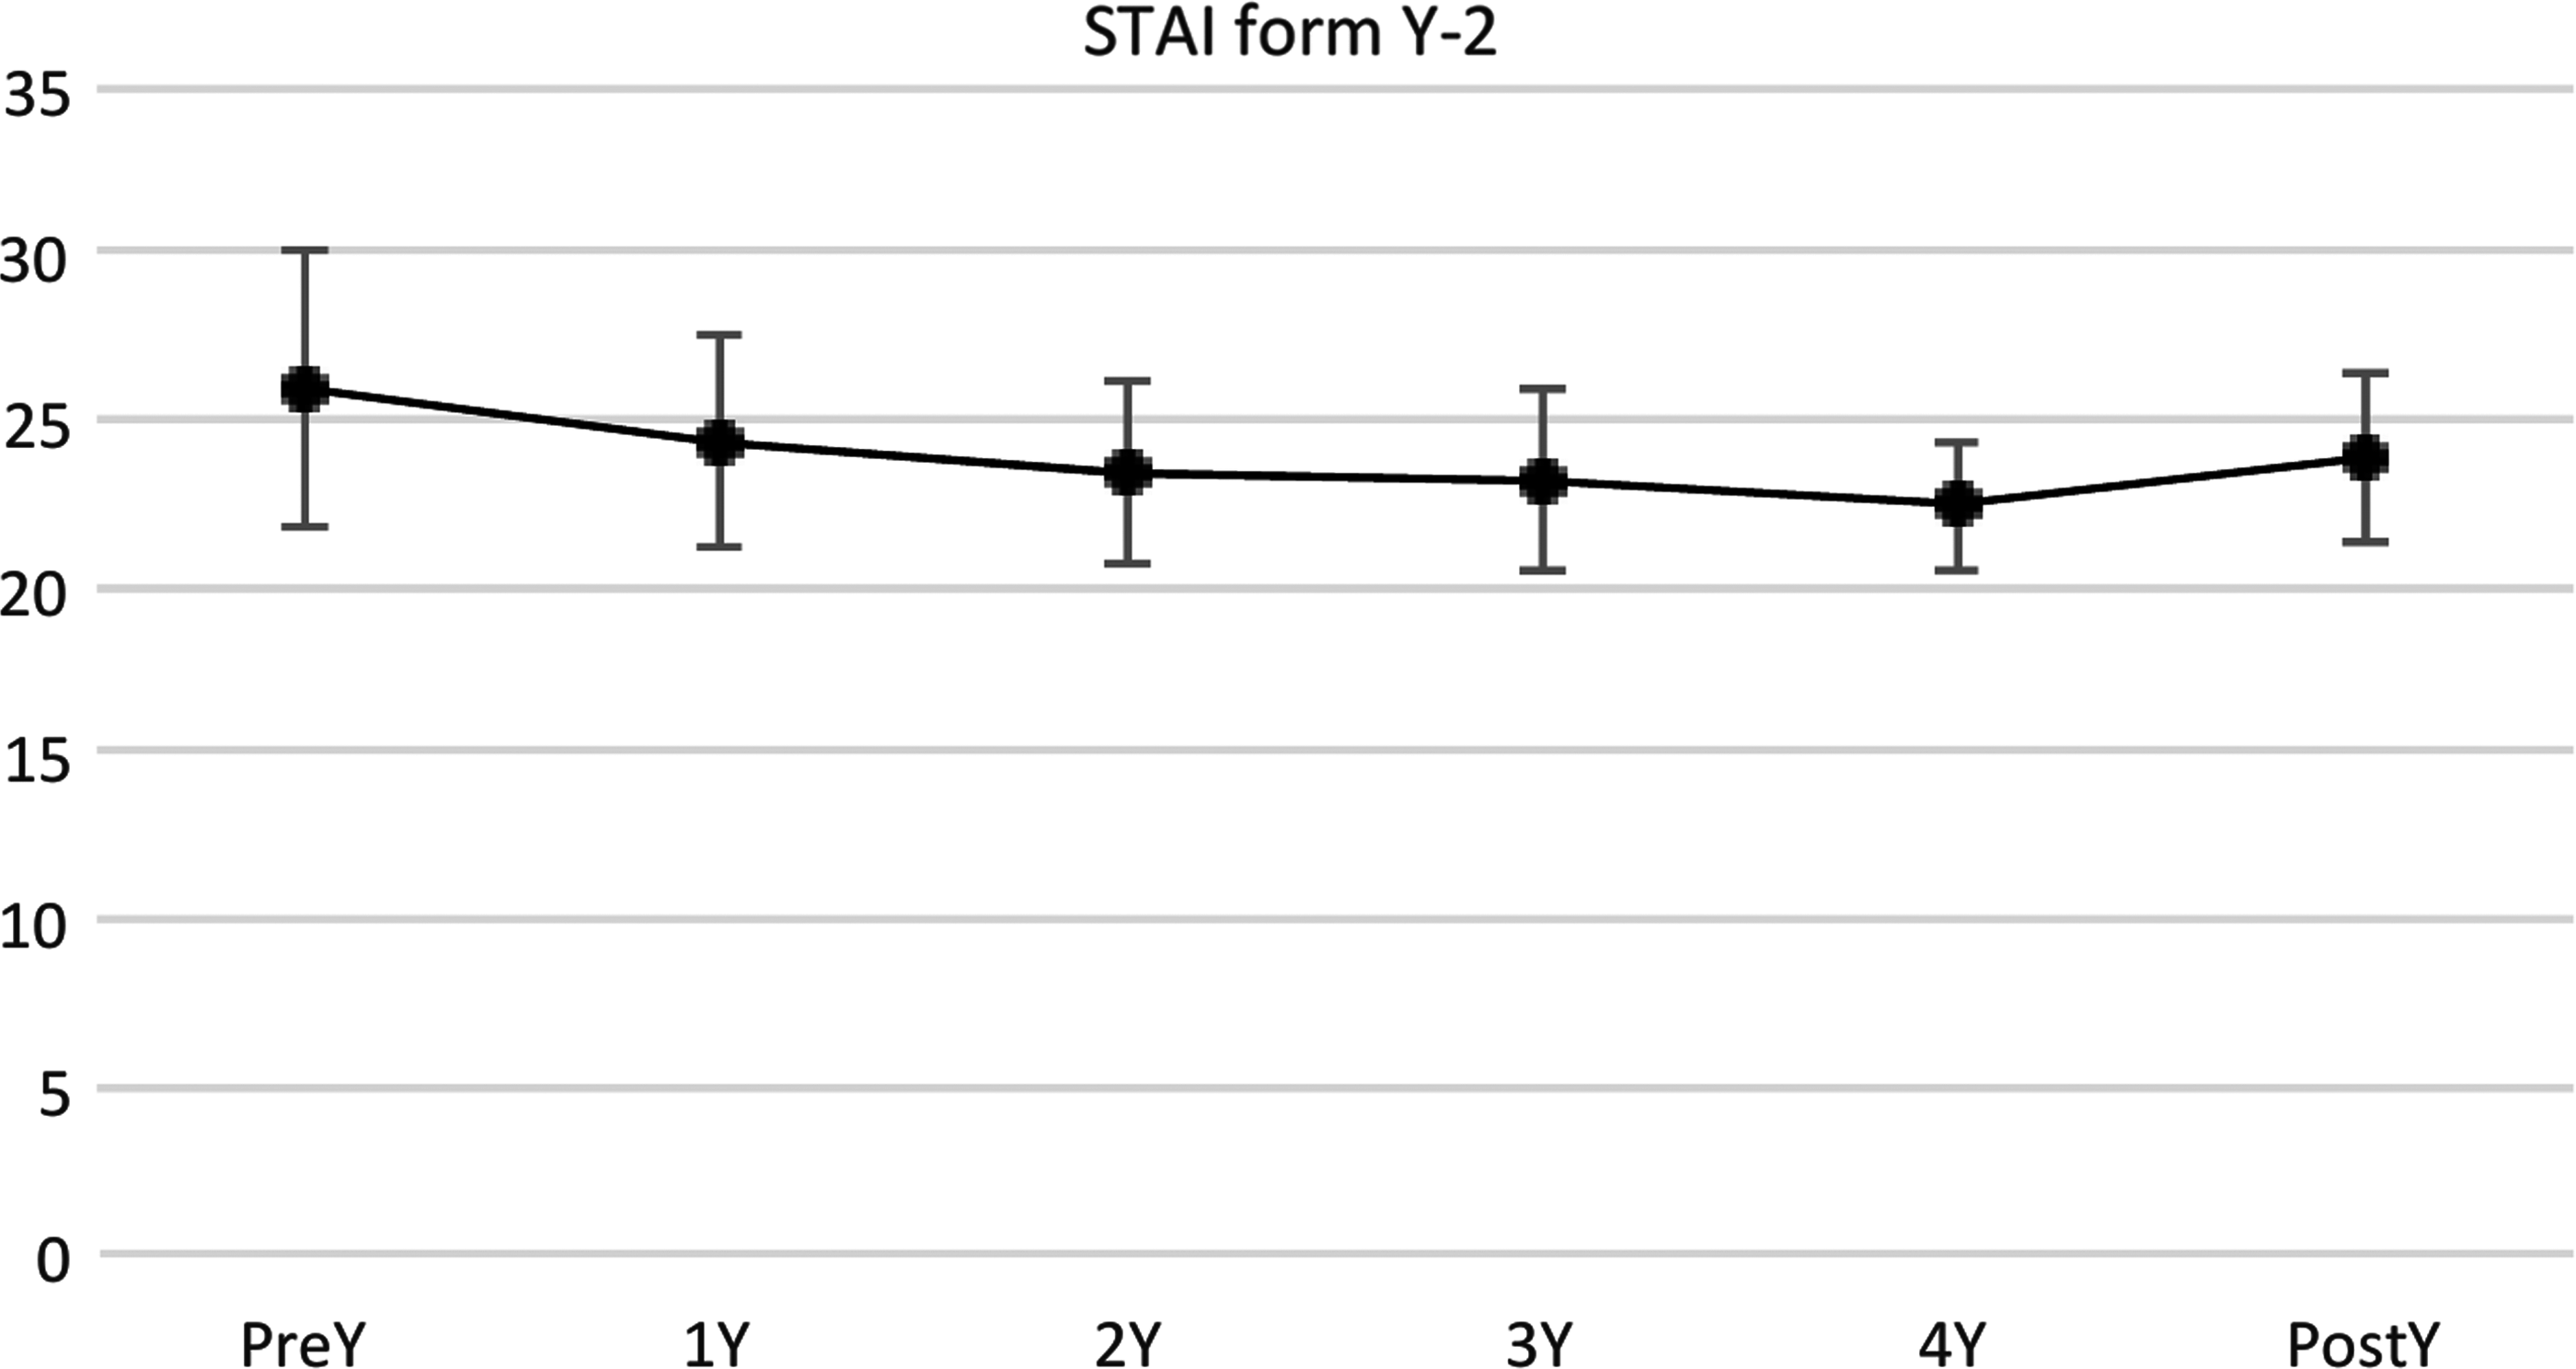
Trait anxiety during the expedition.
STAI, State-Trait Anxiety Inventory.
Psychological inflexibility (AAQ-II)
AAQ-II was completed once after the expedition. The individual data are presented in Table 4. The mean values of the total score were low throughout the sample (under 12) and showed low levels of inflexibility for all subjects. The inflexibility scores of the expedition group (M = 9.3, SE = 0.67) were different from the mean scores obtained from a comparable normal population (Smith et al., 2015: mean value for athletes = 14.46; t = −7.69, p < 0.000; 95% symmetric CI for mean: 7.8, 10.87) and, of course, from clinical values that may lie above 24 indicating a group better than normal in its relationship to its experiences.
Questions and scale from 1 “Never true” to 7 “Always true”:
1. My painful experiences and memories make it difficult for me to live a life that I would value.
2. I'm afraid of my feelings.
3. I worry about not being able to control my worries and feelings.
4. My painful memories prevent me from having a fulfilling life.
5. Emotions cause problems in my life.
6. It seems like most people are handling their lives better than I am.
7. Worries get in the way of my success.
Colorado perceptual speed test
In the Colorado perceptual speed (CPS) test, speed did differ in different phases of the expedition (Fig. 5). The number of mistakes was highest at the beginning and after the physically most demanding period. Within-subjects contrasts for CPS speed showed an upward linear (F = 6.020, p = 0.04) and a quadratic trend (F = 4.900, p = 0.058). Including the baseline phase, differences between the phases of the expedition in the CPS test emerged (F = 2.839, p = 0.041). The differences between pretest and the physically most demanding period (EBC4, BCI: 0.01, 4.43) and between EBC1 and EBC4 (BCI: 0.57, 4.99), between EBC2 and EBC4 (BCI: 0.45, 4.88), and between EBC3 and EBC4 (BCI: 1.12, 5.55) were significant, showing ever-improving results during the expedition. No differences between EBC2 and EBC3 occasions (after the mid-point of the expedition) were found. The number of false and omitted items was very low for the CPS tests and did not require statistical testing.
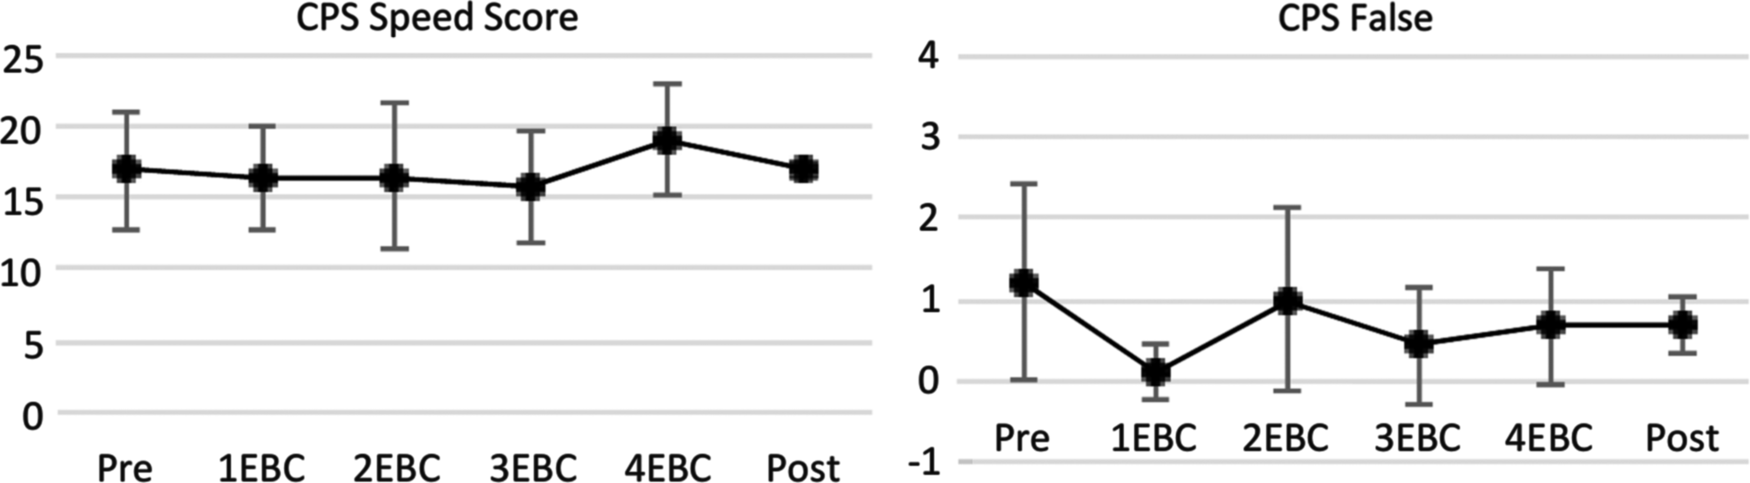
CPS tests speed at different phases of the expedition and the number of mistakes during CPS test. Pre- and posttests were made in Kathmandu and other tests at EBC at different phases of the expedition. CPS, Colorado perceptual speed.
Number comparison test
In NCT, speed was quite steady during the expedition (Fig. 6). The number of mistakes was highest after the most physically demanding period and at the end of the expedition. Tests of within-subjects contrasts showed no trends. Including the baseline phase, no differences between the phases of the expedition in the NCT were found (F = 2.046, p = 0.115). However, EBC2 and EBC3 were different from EBC4 (BCIs: 0.21, 3.04 and 0.33, 3.17, respectively); nor were any differences in NCT found between the second and third test occasions. Similar to the CPS Tests, the number of false items between the phases of the expedition was very low and did not require statistical testing in the NCT.

NCT speed at different phases of expedition and the mistakes during it. Pre- and posttests were made in Kathmandu and other tests at EBC at different phases of the expedition. NCT, number comparison test.
The scores and standard deviations of the both tests are presented in Table 5.
CPST, Colorado perceptual speed test; NCT, number comparison test.
Power calculations
Power calculations were made on some of the most important variables in the study to assess the internal validity of the study. Glass' Δ effect size for the CPS in different phases of the study was 0.259 and power 71%, the corresponding results for the NCT were 0.201 and 59%, for state anxiety (STAI) 0.286 and 76%, for trait anxiety (STAI) 0.447 and 93%, for vigor (POMS) 0.120 and 37%, and tiredness (POMS) 0.391 and 89%, respectively.
Discussion
The present study was designed to follow and to describe changes in the mood, anxiety level, and cognitive performance of mountain climbers during an expedition to Mount Everest lasting almost 3 months. A long-duration mission in austere and rough environments may cause significant decrements in human performance that may jeopardize individual health and well-being as well as the success of the mission as a whole (Palinkas et al., 1998). In our study, and in contrast to other studies, main variables in both performance and in moods improved constantly during the expedition. Thus our hypothesis that the stresses of a high altitude expedition induce behavioral and mood disturbances and other alterations in psychological functions, were not supported. The positive findings are encouraging regarding enhancing the motivation and condition of mountaineers. Some other studies have likewise reported no significant decrements in behavior and performance during long-duration missions (Issa, 2016; Malle et al., 2016). The EBC is not a very isolated environment. There may be more than one thousand habitants during the climbing season. Different expeditions set up their own camps, and even when there are opportunities for social networking, most expeditions try to limit visits to different camps because of competitiveness and in the interests of hygiene.
Bechtel and Berning have (1990) described the “Third Quarter Phenomenon,” in which performance is likely to decline during the third quarter of a mission in an isolated and confined environment regardless of the total duration of the mission itself. This phenomenon has been observed in several types of expeditions in different difficult environments, such as Polar or Antarctic expeditions, lasting from four weeks up to a year (Palinkas et al., 1998). We did not observe this phenomenon even if other differences were found on the CPS and NC tests.
Hornbein et al. conducted neuropsychological and physiological tests on 35 mountaineers before and one to 30 days after ascent to altitudes between 5488 and 8848 m, and on six subjects before and after simulation in an altitude chamber of a 40-day ascent to 8848 m (Hornbein et al., 1989). They found a decline in visual long-term memory after ascent compared with before ascent. Also, the mountaineers made twice as many aphasic errors after ascent. Bolmont et al. (2000) made a study of 31-day gradual decompression in a hypobaric chamber from sea level to 8848 m equivalent altitude. They tested visual reaction time, manual dexterity, and number ordination; anxiety responses and mood states were assessed using the STAI and the POMS, respectively. A significant positive correlation was found between the climbers' performance in reaction time and changes in state-type anxiety levels, suggesting that anxiety could lead to improved reaction time. In addition, significant negative correlations were also found between the climbers' performance in psychomotor ability, mental efficiency, reaction time, and several POMS factors, including tension, hostility, confusion, and fatigue.
During this expedition, the estimates of trait anxiety, forgetfulness, and slackening of the subjects fell steadily (Fig. 4), even if the anxiety level was lower than normal. Simultaneously, fatigue appeared to diminish and the CPS speed results improved. These results show that both cognitive performance and mood may improve at high altitudes when the group of mountaineers is homogenous.
The results of AAQ-II showed low levels of psychological inflexibility, thus supporting the interpretation of the sample as a homogenous and psychologically stable and harmonious group of participants. In addition, the results of the group also reflect their better-than-normal acceptance of their experiences.
Psychological testing at high altitudes frequently reports longer reaction times; subjects also tend to sacrifice reaction time to ensure accuracy when performing cognitive tasks under conditions of hypoxia (Cahoon, 1972). In this study, we found positive effects in the correct performances, and no increase in the number of mistakes made in the CPS or NC tests. Cognitive performance tests in simulated altitude environment have shown the effects of hypoxia, but the differences between chamber and expedition testing are apparent even when using the same cognitive test (Kida and Imai, 1985; Issa, 2016). Field study offers limited control over circumstances that are normally easily manipulated in a laboratory environment.
Oxygen is critical for neuronal functioning and growth in the brain. Although the human brain takes up only about 2% of the body weight, it consumes about 20% of the oxygen intake (Clark and Sokoloff, 1999). The amount of oxygen in the air decreases with increasing altitudes. The hypoxic condition at high-altitude regions poses significant challenge to the functioning of the brain (Leblond and Krnjevic, 1989). A reduction in cerebral oxygenation is partly associated with impairment of cognitive function (Shohei et al., 2016). The effect of AMS on cognitive functions is debatable. Some studies have shown no significant correlation between AMS scores and the extent of cognitive dysfunction (Abraini et al., 1998), and three studies have reported a correlation between AMS and impairment in conceptual tasks in short-term memory (Forster, 1985; Kramer et al., 1993; Issa, 2016). In acute hypoxia, the human body does have some capacity for acclimatization, which varies significantly across individuals (Kramer et al., 1993). Some cognitive impairments are associated with both acute and chronic exposure to high altitudes (Yan, 2014). In our study, one subject suffered AMS at Camp 2 and returned to EBC a day after, just before the d32 tests (LLS 4 and 3). During the tests, he was symptom free, but the effect of AMS was observed in POMS, in which all negative feelings and tiredness were exacerbated and vigor diminished. In addition, his anxiety was higher in STAI-1 (Table 2). The effect of AMS did not emerge in his NC and CPS tests.
The strengths of the present study are that the rate of ascent, altitude of origin, and time of day of testing are accurate. In addition, within each group, every climber had a similar diet, they were relatively homogenous in their exercise capacity, and they climbed the same mountain route over a short period with essentially the same snow and weather conditions. Barometric pressure varied from day to day, but was stable during the measurements. Furthermore, testing in field conditions is a more accurate reflection of the reality of the effects of altitude and the hazards of the long expedition experienced by climbers.
The subjects were studied under the same field conditions and after similar recovery times as regards the ascent. The ascent rate during the expedition was normal and widely used on this mountain. The main difference from an average Everest expedition was that this expedition was partly unsupported. This means that the members of the expedition carried all the equipment for higher camps above the Mount Everest Nepal side EBC by themselves. No porters or high-altitude Sherpas were used above EBC. The members of the expedition crossed the Khumbu glacier 98 times and the Lhotse face 43 times and the expedition was physically more demanding than an average Everest expedition. The tests we used are commonly used in similar studies, but they have not been used during these kinds of high-altitude expeditions.
The limitations of the present study include the relatively small study group and the background of the subjects because they were both self-selected and had undergone psychiatric screening during their military service. The possibility of a socially desirable tendency to respond associated with self-reported questionnaires also applies to our research.
All tests were conducted in the EBC, except for the pre and post-tests. Some of the tests were conducted shortly after ascents to more extreme altitudes and therefore may reflect the acute or delayed responses to hypoxia and/or the social stresses of the long expedition. The study design cannot separate these tests and exposures, but definitely reflects the situation in the field.
Power calculations were made on some of the most important variables in the study to assess the internal validity of the study. The results of the power calculations were variable. Lower power in some of the variables may have caused no differences to emerge in comparisons. This may not detract from the value of the significant changes found, but perhaps limits their number. Numerous differences in important variables between the phases of the expedition were seen as shown in the values of the Bonferroni intervals throughout. In addition, our power calculations were only approximate, but because the repeated measures ANOVA analyses were done using exact parametric tests, our power calculations may be thought to estimate the lower limits of the real power of the study.
Only a few field studies have been conducted where the cognitive effects of a gradual ascent or prolonged exposure to high altitude have been tested (Harris et al., 2009; Grocott et al., 2010; Issa, 2016), all of them with a relatively small number of subjects. In this study, we managed to follow a group of nine climbers throughout a 3-month Everest expedition. The tests in our study add to the batteries of tests used at high altitude and the results support the results in studies showing no worsening in similar simple cognitive tests in ascents to the mountains. To the contrary, the homogenous sample of subjects showed improvements in their situation on the mountains.
Conclusion
The most important finding in this study was that a well-motivated and trained, self-selected group of individuals, who volunteered for a long-duration mission, was able to maintain high levels of performance, steady mood state, and good level of vigor throughout an expedition to Mount Everest lasting almost 3 months. These results show that both cognitive performance and mood may improve at high altitudes when the group of mountaineers is homogenous. For instance, forgetfulness, slackening, and trait anxiety decreased and fatigue appeared to improve toward the end of the expedition. Most expedition members suffered mild symptoms of AMS during the first days in EBC, but this did not affect the speed or the number of mistakes made in the CPS or NC tests. On the contrary, the speed in the CPS test improved. In this study, the subjects were selected and this may be one reason why the cognitive performance in simple working memory and mood tests did not deteriorate. During long-duration expeditions like the Mount Everest expedition, the environmental, psychological, and physiological situation may change suddenly and the consequences of an erroneous or delayed decision may be life threatening. Our study showed, however, that a motivated, strong, and healthy group can cope well with different challenges associated with mountaineering. In the future, more complex cognitive processes such as decision making could also be investigated. It would also be important to study individual reactions in different situations and their significance for decision making.
Footnotes
Acknowledgments
The authors would like to thank the members of the Airborne Ranger Club of Finland Mount Everest expedition; Niilo Konttinen for his advice during the writing; and Annamari Tuulio-Henriksson for advice during the planning of the study. They are also grateful to Jyrki Ollikainen and Tapio Nummi for statistical advice.
Authors' Contribution
The contributing authors are identified by their initials in parentheses after each category. The following categories are used as appropriate: planning of the study (H.M.K.), drafting of the article (H.M.K.), critical revision, and rewriting of the article (H.M.K., M.T.T.), and approval of final article (H.M.K., M.T.T.).
Author Disclosure Statement
No competing financial interests exist.