
Abstract
Abstract
Zhang, Zhiqing, Zhonghai Xiao, Bingnan Deng, Xiaohua Liu, Wei Liu, Hongjing Nie, Xi Li, Zhaoli Chen, Danfeng Yang, and Ruifeng Duan. Therapeutic efficacy of methazolamide against intermittent hypoxia-induced excessive erythrocytosis in rats. High Alt Med Biol 19:69–80, 2018.—This study aimed to determine whether methazolamide is effective for the treatment of chronic mountain sickness. Forty-eight male Wistar rats were randomly divided into eight groups: normoxia control, hypoxia control, hypoxia + acetazolamide (30 mg·kg−1·d−1), and five hypoxia + methazolamide groups (5, 10, 30, 90, and 120 mg·kg−1·d−1). Excessive erythrocytosis was induced through 4 weeks of hypobaric hypoxia (8 hours O2 10%/16 hours O2 21%). Rats were then treated for 4 weeks, and their body weight was measured. Hematological, hemorheological, and biochemical parameters were analyzed. Renal hypoxia-inducible factor-1alpha (HIF-1α) and vascular endothelial growth factor (VEGF) levels were detected by immunohistochemistry. Proteomic analysis of plasma was conducted to determine the most differentially expressed proteins. Methazolamide with doses lower than 30 mg·kg−1·d−1 had no significant effects on body weight compared with the hypoxia control group (p > 0.05). Methazolamide dose-dependently reduced the hemoglobin concentration, hematocrit (Hct), and blood viscosity. Hct/blood viscosity, an oxygen delivery index, dose-dependently increased after methazolamide treatment. A methazolamide dose of 10 mg·kg−1·d−1 showed similar efficacy to an acetazolamide dose of 30 mg·kg−1·d−1 for all the above parameters. Plasma levels of low-density lipoprotein cholesterol, total cholesterol, creatinine, and hemoglobin increased substantially after long-term hypoxia, but decreased after methazolamide treatment. HIF-1α and VEGF both increased substantially after long-term hypoxia and decreased in the kidney after methazolamide treatment. The most differentially expressed protein was haptoglobin, an endogenous protective factor, which was depleted in rats with excessive erythrocytosis and increased substantially after methazolamide treatment. In summary, methazolamide exhibits dose-dependent efficacy for the treatment of excessive erythrocytosis induced by long-term hypoxia. It also has beneficial effects on oxygen transport and lipid metabolism, which are encouraging with regard to the development of methazolamide-based chronic mountain sickness therapies.
Introduction
C
Acetazolamide is a promising therapeutic agent for the treatment of chronic mountain sickness, which has been attributed mainly to an acetazolamide-induced increase in ventilation and arterial O2 saturation (Swenson, 1998, 2014; Richalet et al., 2005, 2008; Rivera-Ch et al., 2007; Pichon et al., 2012). However, previous studies have shown that acetazolamide has dose-dependent side effects, including increased perception of leg fatigue during hypoxic exercise (Garske et al., 2003), impaired respiratory muscle function (Gonzales and Scheuermann, 2013), and paresthesia (Low et al., 2012). Methazolamide, another carbonic anhydrase inhibitor, has a longer half-life, lower protein binding, less renal excretion, and fewer side effects than acetazolamide (Forster, 1982). Methazolamide (150 mg daily) was reportedly as effective as acetazolamide (500 mg daily) for preventing the symptoms of acute mountain sickness, and paresthesia tended to be reduced at high altitudes (Wright et al., 1983, 2008). Furthermore, methazolamide does not cause respiratory muscle weakening at elevated levels of ventilatory drive (Kiwull-Schöne et al., 2009). Antifatigue effects of methazolamide at high altitude have also been reported (Zhang et al., 2012; Scalzo et al., 2015). Therefore, methazolamide may be a good candidate for chronic mountain sickness treatment, but currently no data on the therapeutic efficacy of methazolamide for the treatment of chronic mountain sickness are available.
The present study was designed to evaluate the efficacy of methazolamide in rats with hypoxia-induced excessive erythrocytosis and identify the proteins that may be involved in the underlying molecular mechanisms of the effects of methazolamide on chronic mountain sickness.
Materials and Methods
Experimental protocol
The male Wistar rats used in the current study were bred at the Animal Center of the Tianjin Institute of Health and Environmental Medicine. The study was performed in strict accordance with the recommendations in the Guide for the Care and Use of Laboratory Animals of the National Institutes of Health. The protocol was approved by the Tianjin Institute of Health and Environmental Medicine Animal Care and Use Committee. An intermittent hypoxia exposure model was used to induce excessive erythrocytosis, the details of which have been reported previously (Li et al., 2014). The experimental protocols used for normoxia control and hypoxia control with and without drug treatment are shown in Figure 1. Forty-eight male Wistar rats (3 months old, weighing ∼250 g) were bred under normoxic conditions unless otherwise stated. All the animals were given water and a pelleted diet ad libitum. Rats were randomly divided into the following eight groups (six rats per group): normoxia control, hypoxia control, hypoxia + acetazolamide (30 mg·kg−1·d−1), and five hypoxia + methazolamide groups (5, 10, 30, 90, and 120 mg·kg−1·d−1, respectively). All groups except the normoxia control group were exposed to hypoxia at a simulated altitude of 5500 m in a hypobaric chamber (08-Y1300-004; Yantai Hongyuan Oxygen Industry Co., Ltd., Shandong, China) for 8 hours (9:00 a.m.−17:00 p.m.) per day over 8 weeks. Saline and drugs suspended in equal volumes of saline were administered to all rats orally through gavage from the fifth to the eighth week. Using the body surface area normalization method (Reagan-Shaw et al., 2008), doses of 5, 10, 30, 90, and 120 mg·kg−1 methazolamide in rats correspond to respective human equivalent doses of 0.8, 1.6, 4.9, 14.6, and 19.4 mg·kg−1, which in turn equate to respective doses of 48.6, 97.2, 291.6, 875.4, and 1166.4 mg of methazolamide for a 60 kg person. The body weight of the rats after 8 weeks of hypoxia in control and experimental groups was measured.

Experimental protocols for a rat model of excessive erythrocytosis and drug administration.
Hematological, hemorheological, and biochemical parameters
After hypoxia exposure for 4 weeks, venous blood was collected from each rat's tail, and hemoglobin concentration was immediately determined through the cyanmethemoglobin method (Zwart et al., 1996) to establish excessive erythrocytosis. After hypoxia exposure for 8 weeks, rats were anesthetized using chloral hydrate. The abdomen was opened and the abdominal aorta was located. A model 22G blood collection needle was inserted into the abdominal aorta. Blood samples of ∼4 mL were collected into vacuum blood collection tubes with a suitable amount of K2-EDTA for whole blood cell analysis using a Sysmex XT 2000i hematology analyzer (Roche Diagnostics, Rotkreuz, Switzerland). Additional blood samples of ∼4 mL were collected into vacuum blood collection tubes with a suitable amount of K2-EDTA and centrifuged at 760 g for 20 minutes at room temperature, and aliquots of plasma were transferred into Eppendorf tubes. The plasma was stored at −80°C immediately. An aliquot of plasma was used for biochemical analyses using a Toshiba TBA-40FR autoanalyzer (Toshiba Medical Systems Corporation, Tokyo, Japan). Plasma hemoglobin concentration was measured using the Harboe method (Harboe, 1959; Malinauskas, 1997). Blood samples of ∼4 mL were collected into vacuum blood collection tubes with a suitable amount of lithium heparin for blood viscosity determination using an Automatic Blood Rheometer SA-6900 (Beijing Success Technology Development Co. Ltd., Beijing, China).
Immunohistochemistry
After hypoxia exposure for 8 weeks, kidneys from three animals in the normoxia control, hypoxia control, and 30 mg·kg−1·d−1 methazolamide groups were rapidly excised and immediately immersed in 10% formalin, then embedded in paraffin. Sections (5 μm thick) were deparaffinized in xylene, rehydrated through serial dilutions of alcohol, and washed in PBS (pH 7.2), which was used for all subsequent washes. Rabbit polyclonal anti-hypoxia-inducible factor-1alpha (HIF-1α) antibody (diluted 1:80, K377; Bioworld Technology, MN) and mouse monoclonal antivascular endothelial growth factor (VEGF) antibody (diluted 1:50, C-1; Santa Cruz Biotechnology, CA) were used for immunohistochemical staining for 60 minutes at 25°C. The conventional streptavidin peroxidase method was used to develop the signals, and the samples were counterstained with hematoxylin. Immunopositivity for HIF-1α and VEGF in the tubular cells of the cortex was photographed using an Olympus BX-51 microscope (Olympus, Japan).
Two-dimensional gel electrophoresis
Plasma from rats in the normoxia control group, hypoxia control group, and 30 mg·kg−1·d−1 methazolamide group was analyzed through two-dimensional gel electrophoresis, which was conducted as reported previously (Cui et al., 2004). The protein concentration of the plasma was determined using the Bradford method, and 190 μg of plasma protein was used per gel. Separate protein spots on the gels were visualized using silver staining that was compatible with mass spectrometry.
Image analysis
Three gels from each group were scanned with an ImageScanner (Amersham Biosciences, Uppsala, Sweden) and analyzed using the ImageMaster™ 2D Platinum, version 5.0, software (Amersham Biosciences). Spots were detected and quantified automatically. The normalized volume (vol%) was calculated to correct the differences in sample loading. Seven spots that indicated differential expression in normalized volumes were analyzed through a Reflex III MALDI-TOF mass spectrometer (Bruker Daltonics, Germany).
In-gel enzymatic digestion of protein spots and MALDI-TOF mass spectrometry
In-gel enzymatic digestion and Matrix-Assisted Laser Desorption/Ionization Time of Flight (MALDI-TOF) mass spectrometry were performed as reported previously (Cui et al., 2004, 2005). Peptide mass fingerprinting results were obtained using the Reflex III MALDI-TOF mass spectrometer and analyzed by searching the NCBI database using the Mascot search software. A minimum score of 63 and a significant difference in the number of matched peptides to the next potential hit indicated a statistically positive identification of the protein.
Western blot assays
After the amount of protein was determined, 50 μg of protein for each sample was diluted with sample buffer and boiled for 5 minutes. The protein samples were separated using sodium dodecyl sulfate–polyacrylamide gel electrophoresis (SDS-PAGE) on a 12% polyacrylamide resolving gel and transferred to a polyvinylidene fluoride membrane (Millipore Corp., Bedford, MA). The membranes were stained with Ponceau S and photographed to confirm that similar amounts of protein were loaded into the gels. The membrane was blocked with 3% bovine serum albumin in tris-buffered saline containing 0.1% Tween-20 for 1 hour at room temperature, followed by incubation with rabbit monoclonal anti-Haptoglobin antibody (1:10000 dilution, ab131236; Abcam, Cambridge, United Kingdom) overnight at 4°C and an additional incubation with rabbit HRP-conjugated anti-rabbit IgG (1:2000 dilution; Santa Cruz Biotechnology, Santa Cruz, CA) for 1 hour at room temperature. The blots were washed three times for 10 minutes each with tris-buffered saline containing 0.1% Tween-20. Protein bands were visualized on Kodak film using the Electro Chemiluminescence Kit (Santa Cruz Biotechnology), and films were photographed using an Image Master VDS apparatus (Pharmacia Biotech, Uppsala, Sweden). Protein band densities were quantified using the ImageJ software (version 1.44) and normalized against the density of Ponceau S bands.
Statistical analyses
Results are presented as mean ± SD. Statistical analyses were performed using SPSS (version 11.5; Chicago, IL). Group comparisons were performed using one-way analysis of variance (ANOVA) or Student's t-test, as appropriate. If ANOVA indicated a significant difference among the means, specific comparisons were analyzed through Fisher's least significant difference test. All p-values were two-tailed, and differences were considered significant at p < 0.05.
Results
Body weight changes after 8 weeks of hypoxia in control and experimental groups
After exposure to hypoxia for 8 weeks, the rats' body weight was measured. There were no significant changes in body weight in the normoxia control and hypoxia control groups after 8 weeks of hypoxia (p > 0.05) (Fig. 2). Rats that received methazolamide doses lower than 30 mg·kg−1·d−1 for 4 weeks exhibited no significant changes in body weight compared with those in the hypoxia control group (p > 0.05).
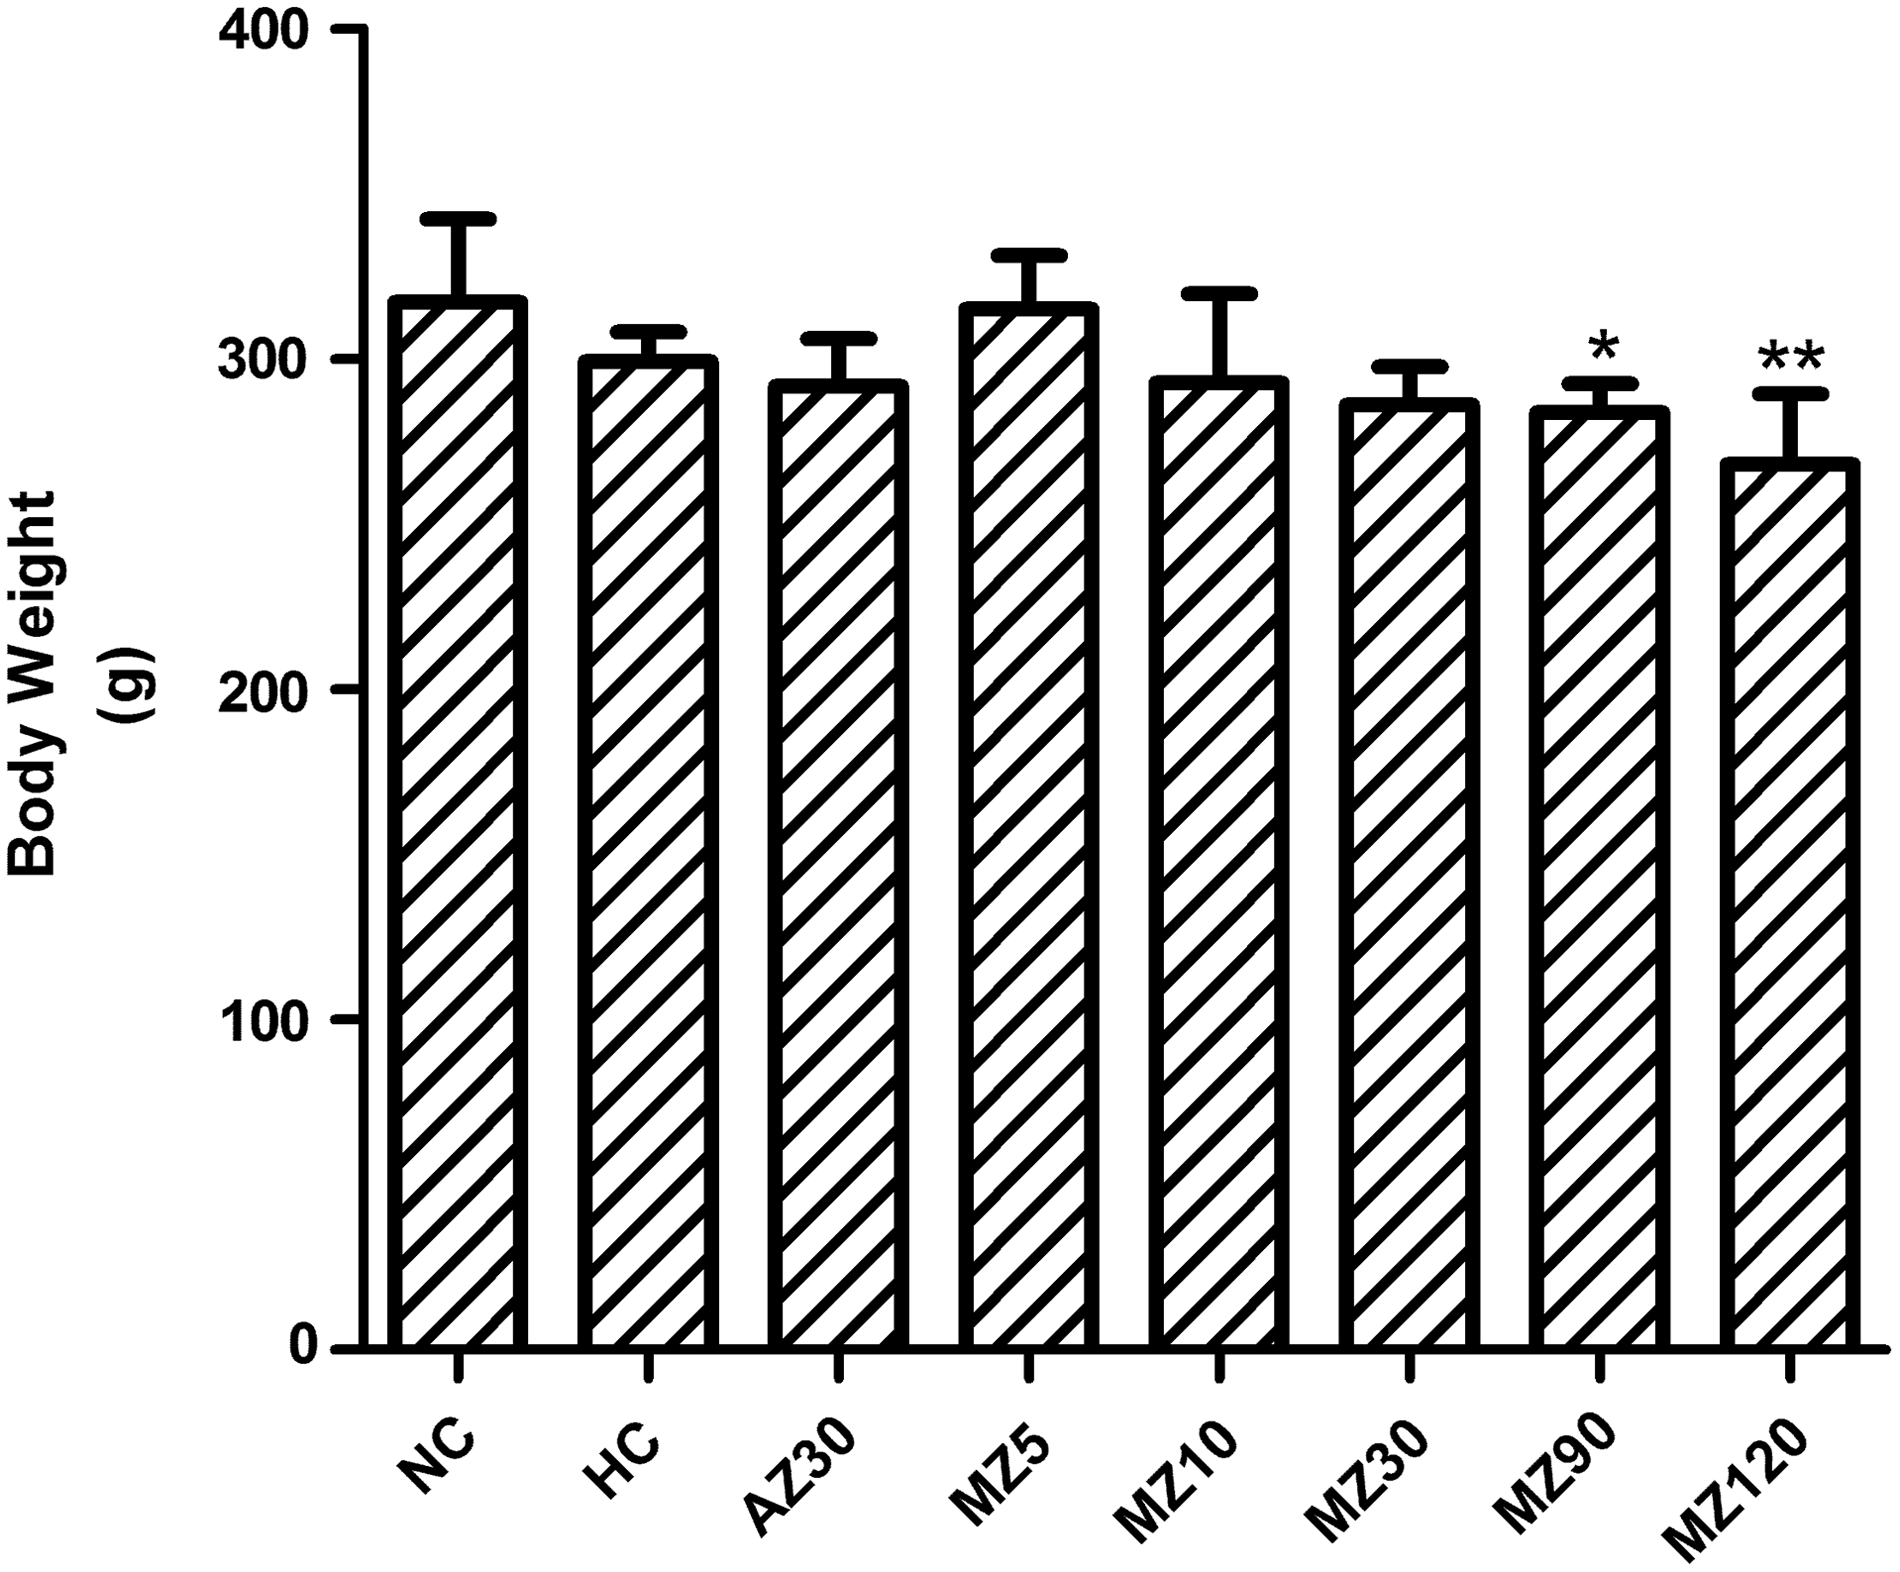
Changes in body weight after 8 weeks of hypoxia in control and experimental groups. *p < 0.05 and **p < 0.01 versus the hypoxia control group. All measurements were performed in normoxia. AZ30, 30 mg·kg−1·d−1 acetazolamide group; HC, hypoxia control group; MZ5, 5 mg·kg−1·d−1 methazolamide group; MZ10, 10 mg·kg−1·d−1 methazolamide group; MZ30, 30 mg·kg−1·d−1 methazolamide group; MZ90, 90 mg·kg−1·d−1 methazolamide group; MZ120, 120 mg·kg−1·d−1 methazolamide group; NC, normoxia control group.
Effects of 4 weeks of hypoxia on hemoglobin concentration
After exposure to hypoxia for 4 weeks, hemoglobin concentration was determined using the cyanmethemoglobin method (Zwart et al., 1996). The mean hemoglobin concentration in the hypoxia group (21.2 ± 3.1 g·dL−1) was significantly higher than that in the normoxia control group (15.0 ± 1.5 g·dL−1) (p < 0.001).
Hematological changes after 8 weeks of hypoxia in control and experimental groups
There were significant increases in hemoglobin concentration and Hct in rats subjected to hypoxia for 8 weeks, indicating that the rats had excessive erythrocytosis. These parameters decreased dose-dependently in the methazolamide administration groups compared with the hypoxia control group. With regard to hemoglobin, methazolamide has a clear dose–response relationship. Furthermore, doses of 5, 10, 30, 90, and 120 mg·kg−1 methazolamide in rats correspond to respective hemoglobin% decreases of 6, 8, 17, 28, and 31 compared with the hypoxia control group, which can be described using the following formula: y = 8.1849ln(x) −9.1748, R2 = 0.9792; x, dose of methazolamide (mg·kg−1); y, hematocrit decrease (%) (Fig. 3A). With regard to hematocrit, methazolamide has also a clear dose–response relationship. Furthermore, doses of 5, 10, 30, 90, and 120 mg·kg−1 methazolamide in rats correspond to respective hematocrit% decreases of 4, 7, 16, 26, and 30 compared with the hypoxia control group, which can be described using the following formula: y = 8.2556ln(x) −10.809, R2 = 0.9863; x, dose of methazolamide (mg·kg−1); y, hematocrit decrease (%) (Fig. 3B). A dose of 30 mg·kg−1·d−1 acetazolamide also improved these parameters and showed efficacy similar to 10 mg·kg−1·d−1 methazolamide (Fig. 3).

Changes in hematological parameters after 8 weeks of hypoxia in control and experimental groups.
Changes in hemorheological parameters after 8 weeks of hypoxia
There were significant increases in blood viscosity (1 second−1, 10 seconds−1, 100 seconds−1, 200 seconds−1, and Casson viscosity) in rats subjected to hypoxia for 8 weeks. These parameters were reduced dose-dependently in the methazolamide administration groups compared with the hypoxia control group. A dose of 5 mg·kg−1·d−1 methazolamide significantly improved all of these parameters, as did a dose of 10 mg·kg−1·d−1, and both doses showed similar efficacy to that of 30 mg·kg−1 acetazolamide (Fig. 4A–E). Hct/blood viscosity decreased after exposure to 8 weeks of hypoxia. A dose of 10 mg·kg−1·d−1 methazolamide increased Hct/blood viscosity and exhibited efficacy similar to that of 30 mg·kg−1·d−1 acetazolamide (Fig. 4F).
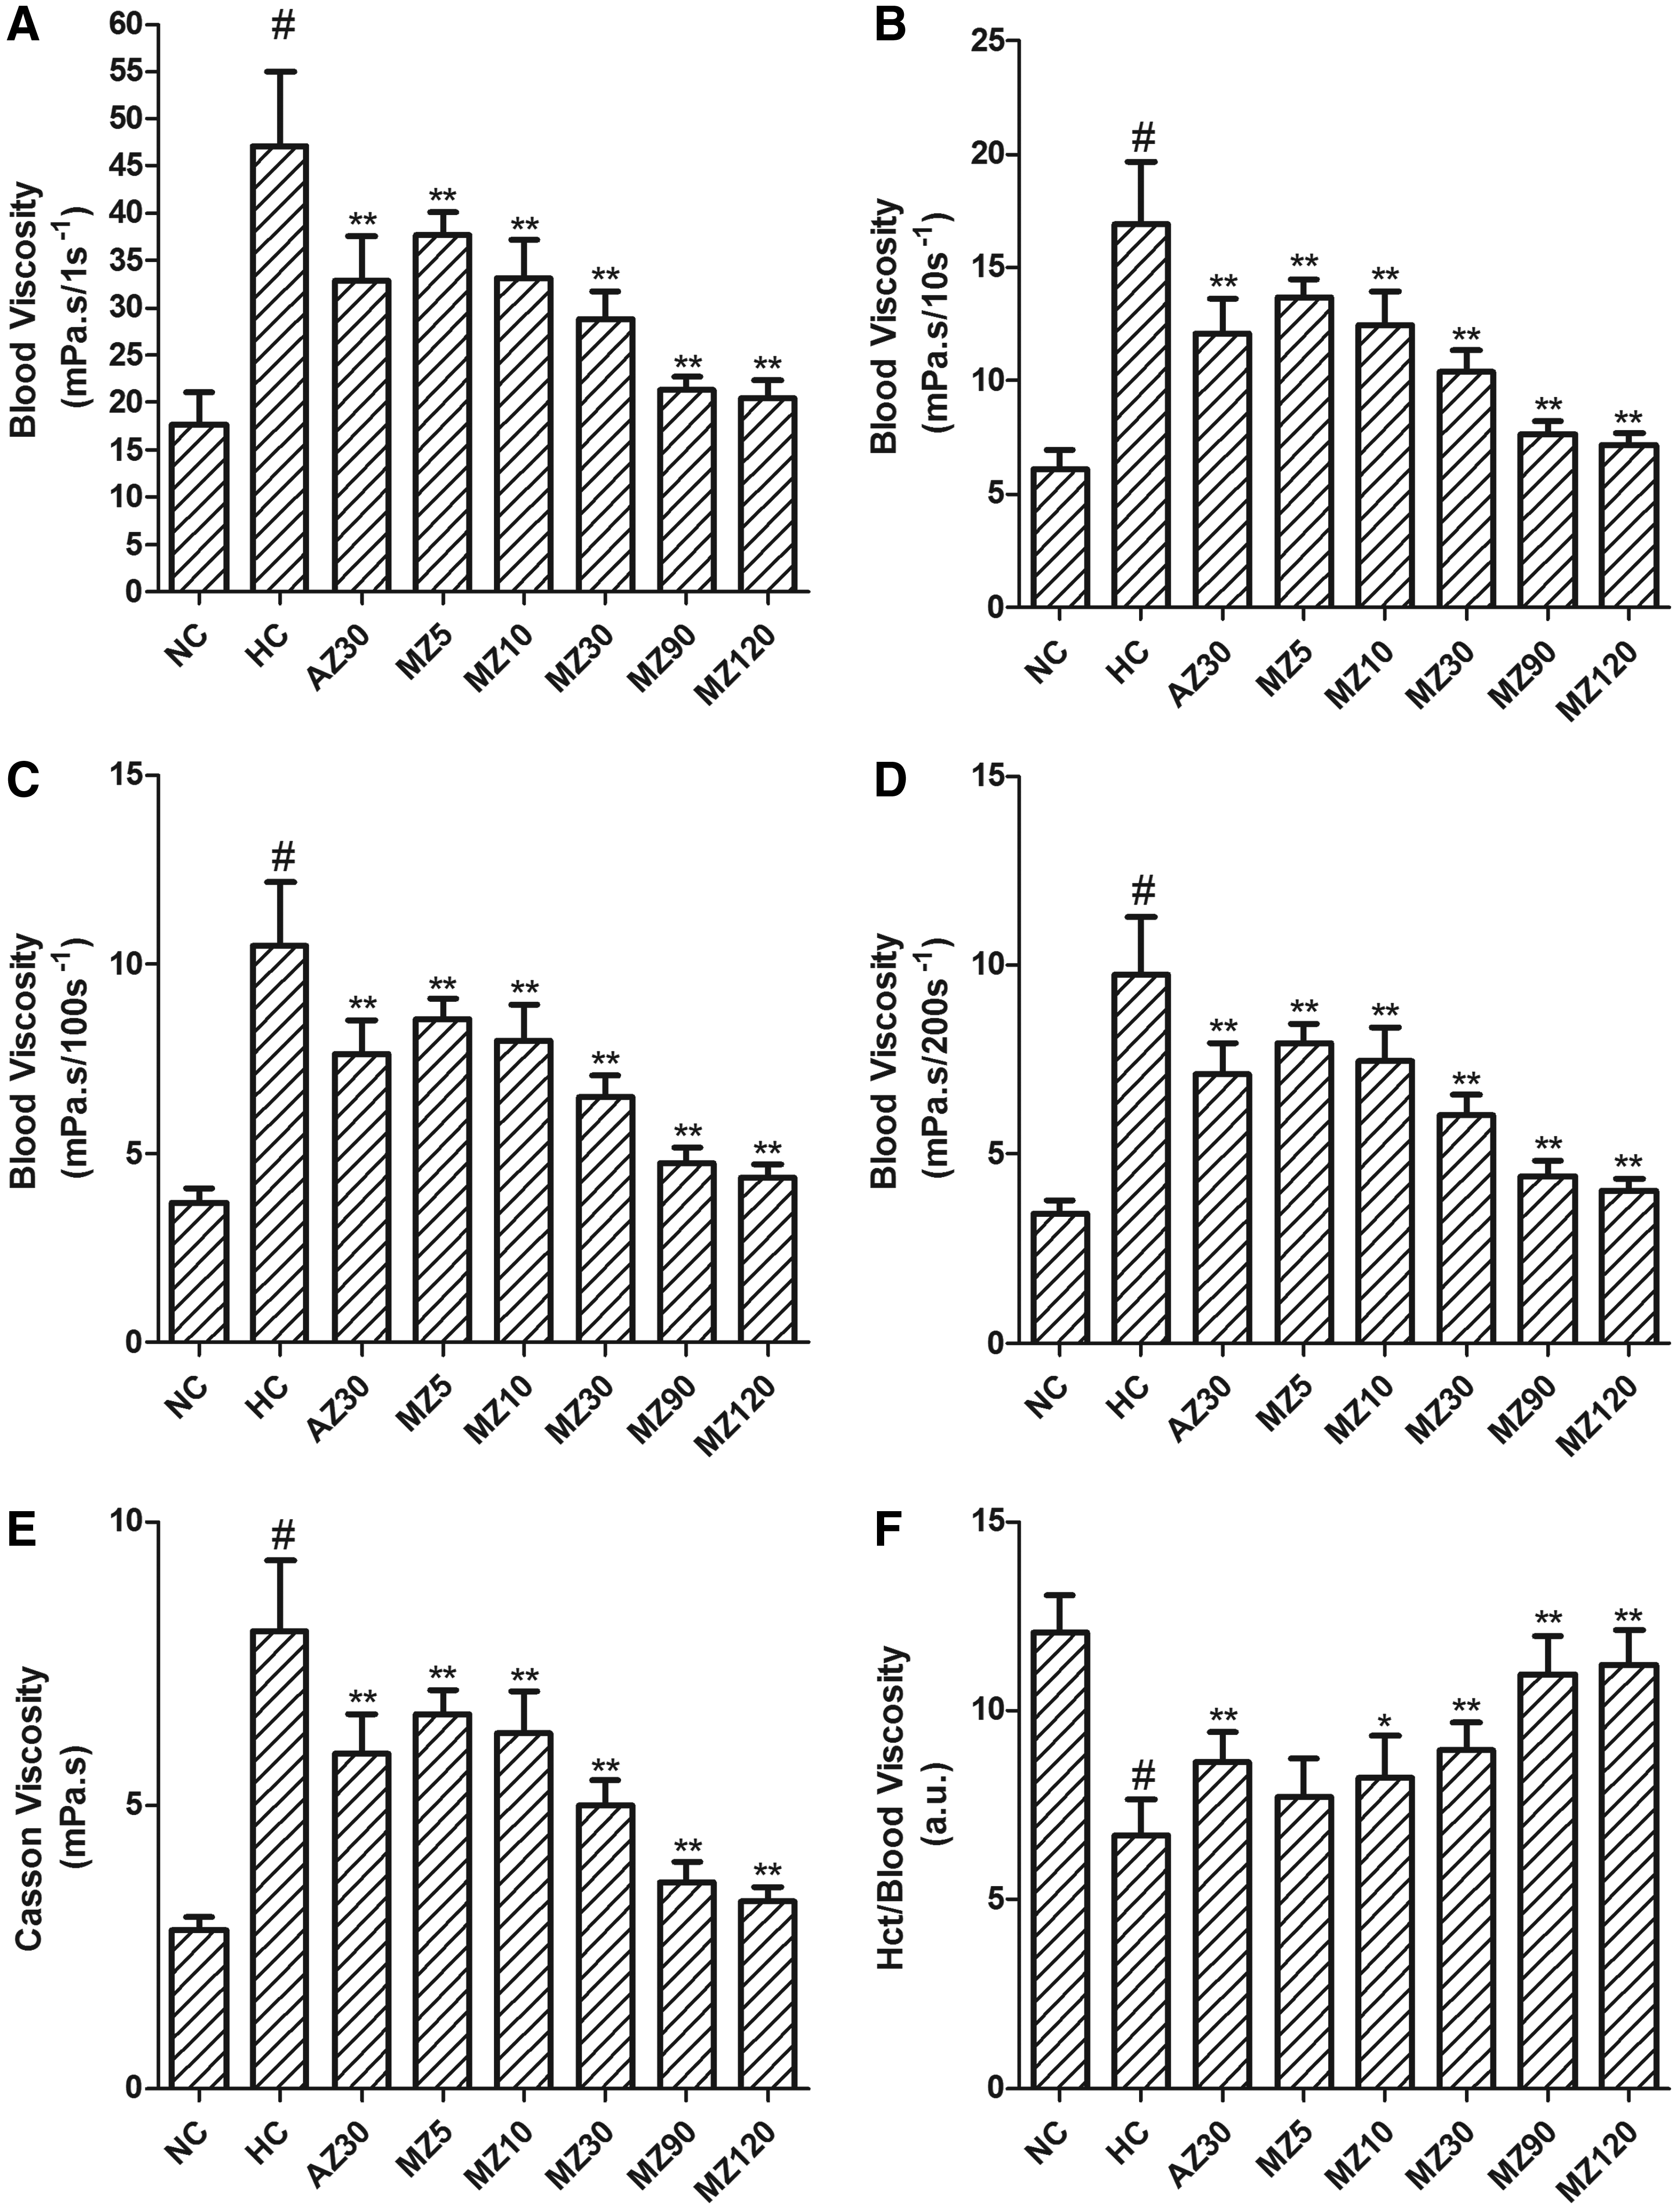
Changes in hemorheological parameters after 8 weeks of hypoxia in control and experimental groups.
Changes in biochemical parameters after 8 weeks of hypoxia
Low-density lipoprotein cholesterol and total cholesterol increased substantially after hypoxia exposure (p < 0.05). These parameters were improved and the plasma level of high-density lipoprotein cholesterol increased after methazolamide treatment, demonstrating the efficacy of methazolamide with regard to the improvement of lipid metabolism. Hypoxia and drugs did not affect blood urea nitrogen levels. However, blood creatinine increased after hypoxia and was reduced by methazolamide. Hemoglobin plasma levels increased significantly after hypoxia exposure (p < 0.05) and were significantly reduced after methazolamide treatment (Table 1).
Values are the mean ± SD, one-way analysis of variance, LSD multiple comparison test. n = 6.
p < 0.05 versus the normoxia control group; *p < 0.05, **p < 0.01 versus the hypoxia control group. All measurements were performed in normoxia.
AZ30, 30 mg·kg−1·d−1 acetazolamide group; BUN, blood urea nitrogen; CRE, creatinine; HC, hypoxia control group; HDL, high-density lipoprotein cholesterol; LDL, low-density lipoprotein cholesterol; MZ5, 5 mg·kg−1·d−1 methazolamide group; MZ10, 10 mg·kg−1·d−1 methazolamide group; MZ30, 30 mg·kg−1·d−1 methazolamide group; MZ90, 90 mg·kg−1·d−1 methazolamide group; MZ120, 120 mg·kg−1·d−1 methazolamide group; NC, normoxia control group; pHb, plasma hemoglobin; TCHO, total cholesterol.
HIF-1α and VEGF expression in the kidney after 8 weeks of hypoxia
HIF-1α and VEGF were expressed predominantly in the cytoplasm of tubular epithelium in the kidneys. HIF-1α and VEGF levels were low in the normoxia control group. Both were substantially increased in the hypoxia control group, indicating that the degree of hypoxia was greater in the kidneys in the hypoxia control group. HIF-1α and VEGF levels were significantly decreased in the methazolamide groups compared with the hypoxia control group (Fig. 5).
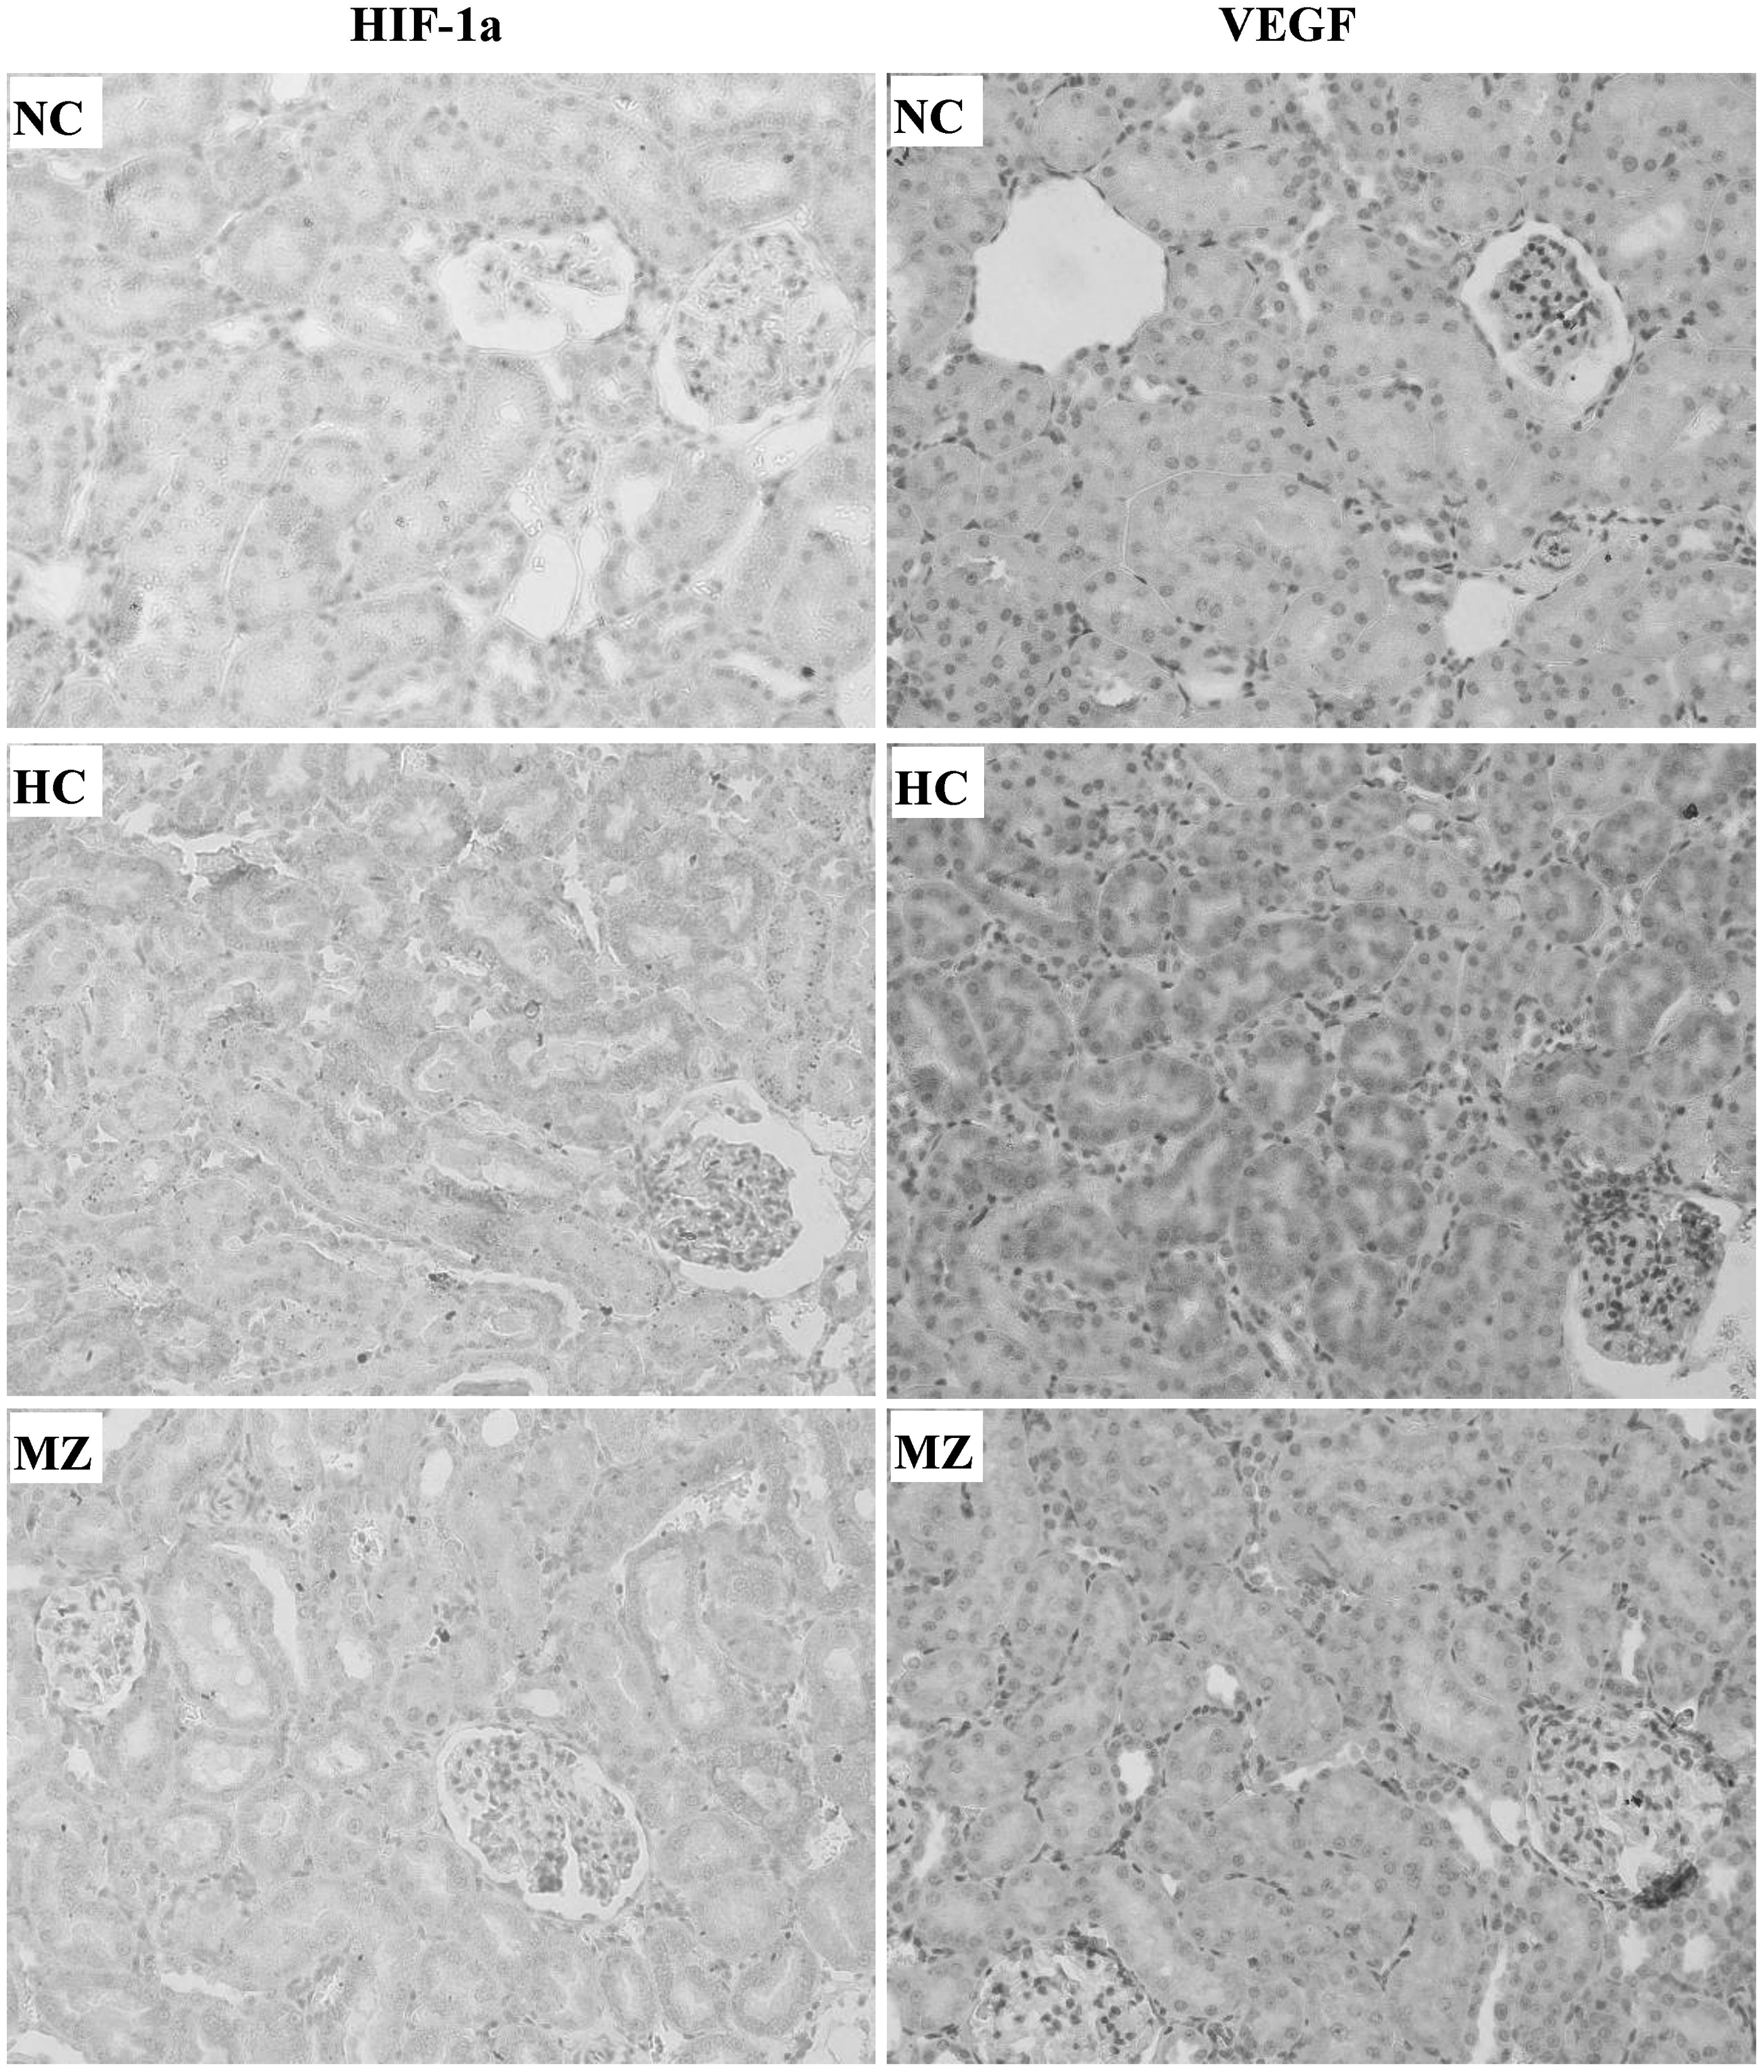
Hypoxia-inducible factor 1-alpha and erythropoietin expression in the epithelium of the cortical tubules of the kidney (400 × ). HC, hypoxia control group; MZ, 30 mg·kg−1·d−1 methazolamide group; NC, normoxia control group.
Plasma proteome changes in rats with excessive erythrocytosis and methazolamide-treated rats
Representative, silver-stained, two-dimensional electrophoresis gels of the plasma proteomes of normoxia control, hypoxia control, and methazolamide-treated rats are shown in Figure 6. Approximately 738 (626–892) protein spots were detected per gel. Seven protein spots were almost absent in hypoxia control rats, but they were normalized after methazolamide treatment. All the spots were identified as haptoglobin (Table 2). The MALDI-TOF mass spectrometry analysis of protein spot 4 and its matching peptides is shown as a representative result (Fig. 7).
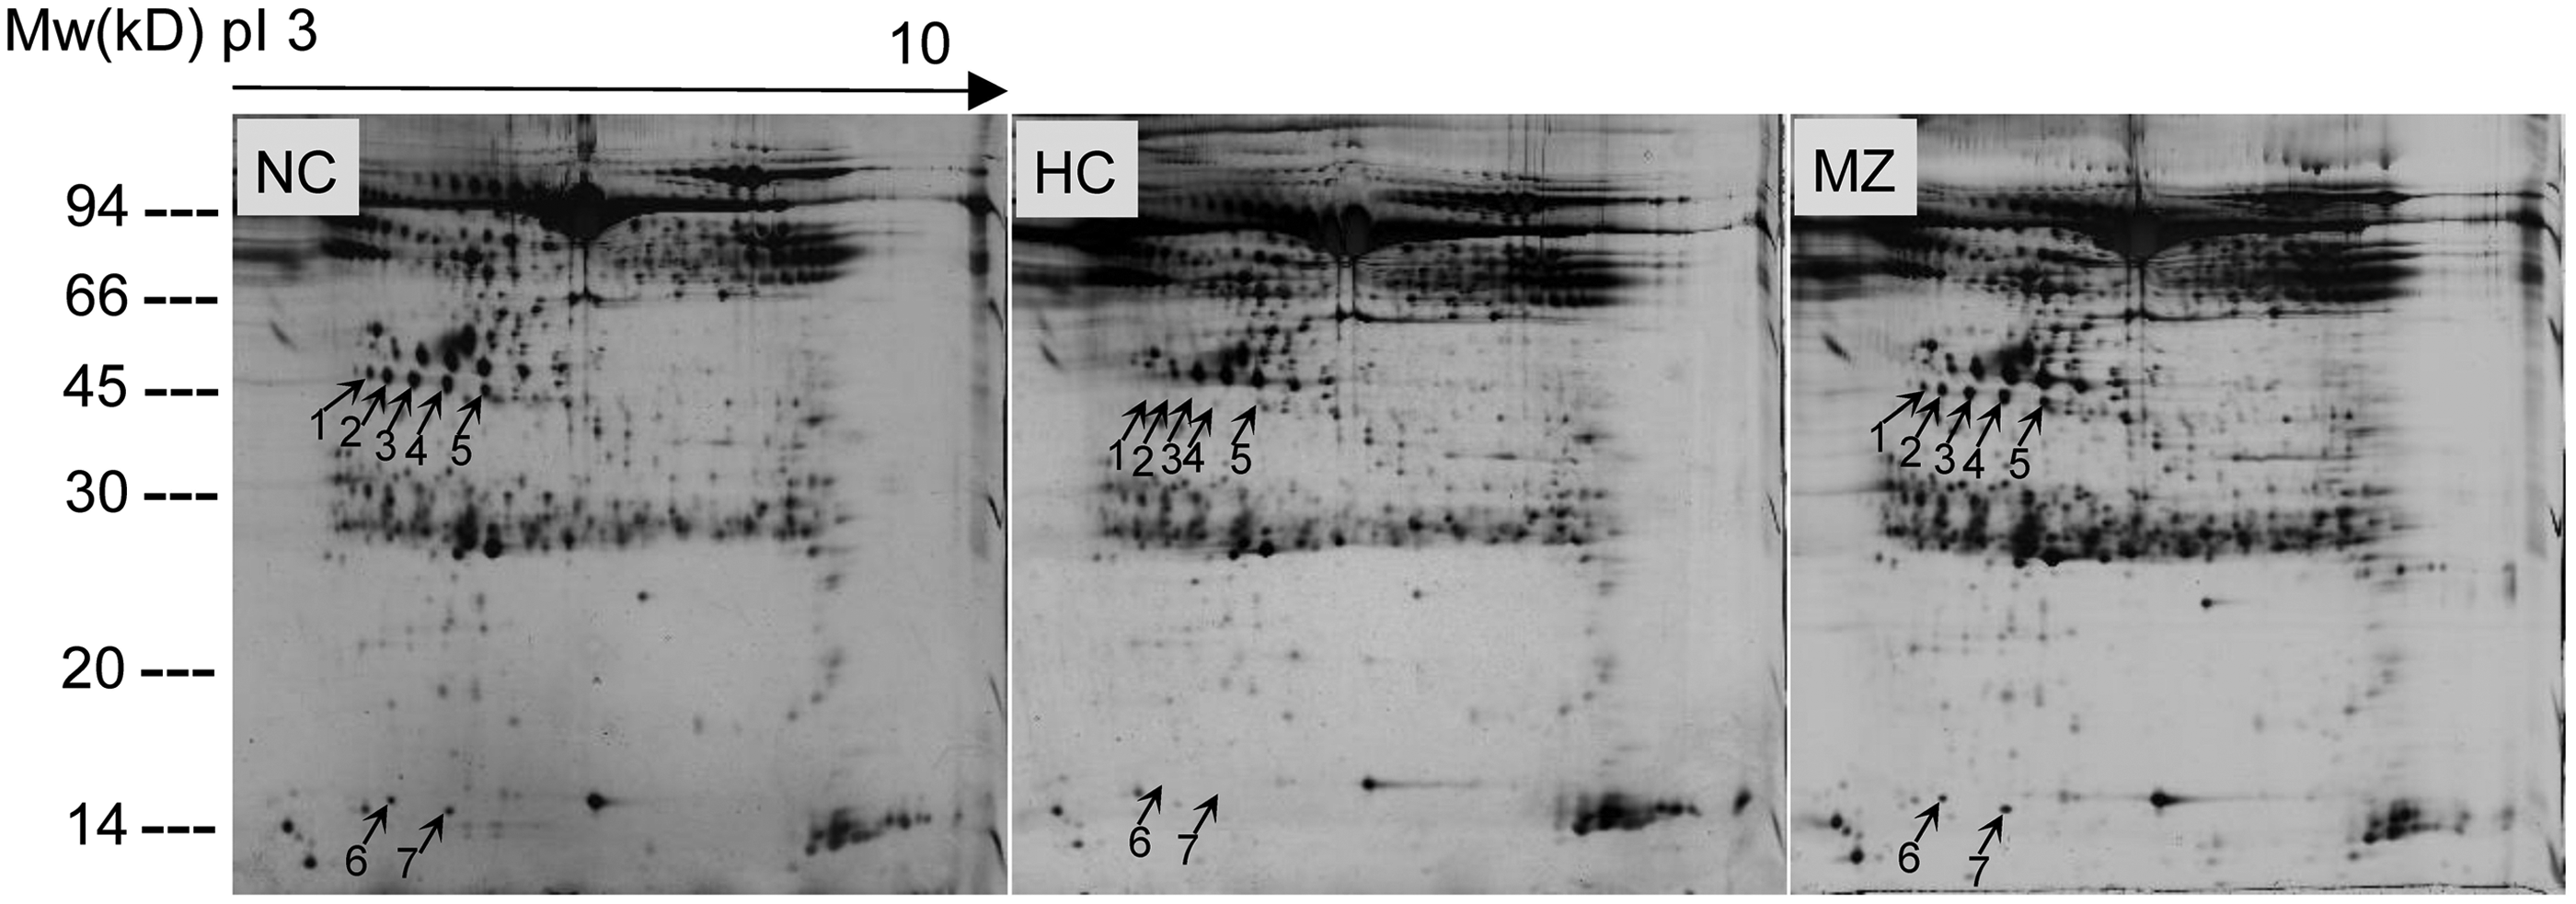
Representative, silver-stained, two-dimensional electrophoresis gels of plasma proteins. Plasma from rats in NC, HC, and MZ groups was analyzed by two-dimensional gel electrophoresis. x-axis: isoelectric point from 3 to 10; y-axis: molecular weight. Seven differentially expressed protein spots are marked by an arrow and a number. HC, hypoxia control group; MZ, 30 mg·kg−1·d−1 methazolamide group; NC, normoxia control group.
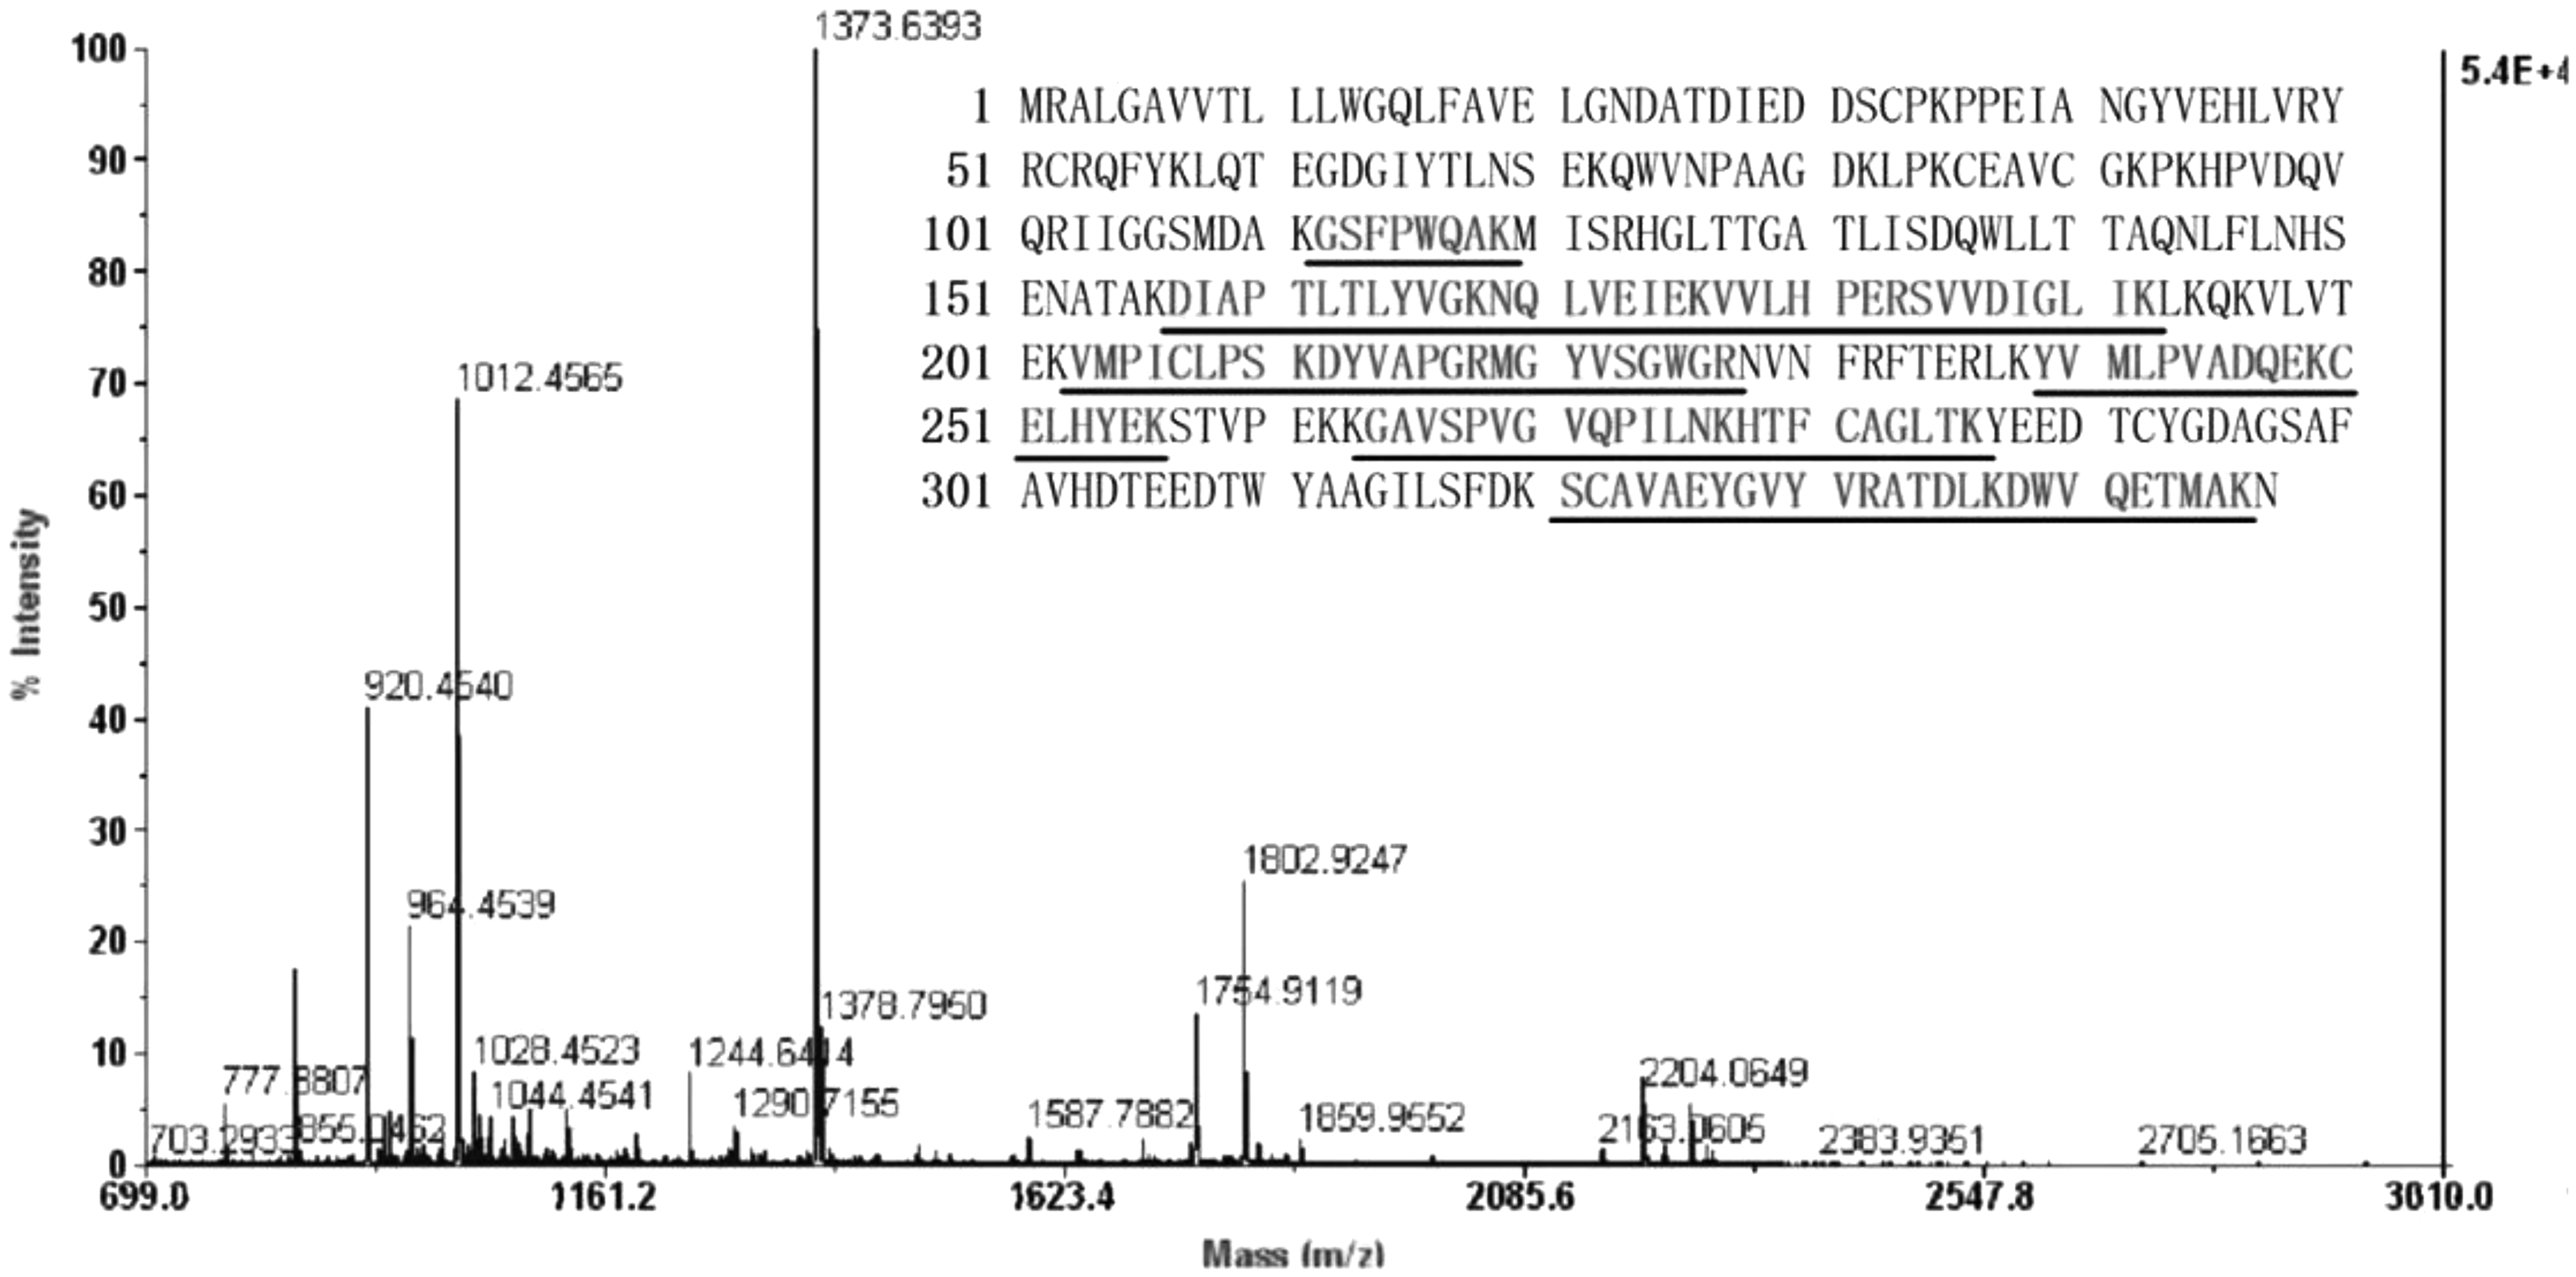
Peptide mass fingerprinting spectrum and its matching peptides. Protein spot 4 was subjected to tryptic digestion and analyzed by Matrix-Assisted Laser Desorption/Ionization Time of Flight mass spectrometry (MALDI-TOF-MS). Sequence with underline shows peptides that are matched with peptides from haptoglobin and indicates sequence coverage of 34%.
Spot numbers are defined according to spot positions in two-dimensional electrophoresis gels.
The protein symbols are provided by the Rat Genomic Nomenclature Committee.
The GI numbers are a series of digits assigned consecutively by the NCBI to each sequence.
Probability-based Mowse score. Ion score is −10*Log(p), where p is the probability that the observed match is a random event.
Protein scores are derived from ion scores as a nonprobabilistic basis for ranking protein hits. Protein scores greater than 59 are significant (p < 0.05).
Sequence coverage calculated as the percentage of identified sequence compared with the complete sequence of the matched protein.
GI, GenInfo Identifier; MW, molecular weight.
Changes in plasma haptoglobin confirmed by western blotting
The effect of methazolamide on plasma haptoglobin expression in rats with excessive erythrocytosis was further confirmed through western blotting. Methazolamide treatment greatly increased plasma haptoglobin protein levels in rats with excessive erythrocytosis, which was substantially depleted by long-term hypoxia (Fig. 8).
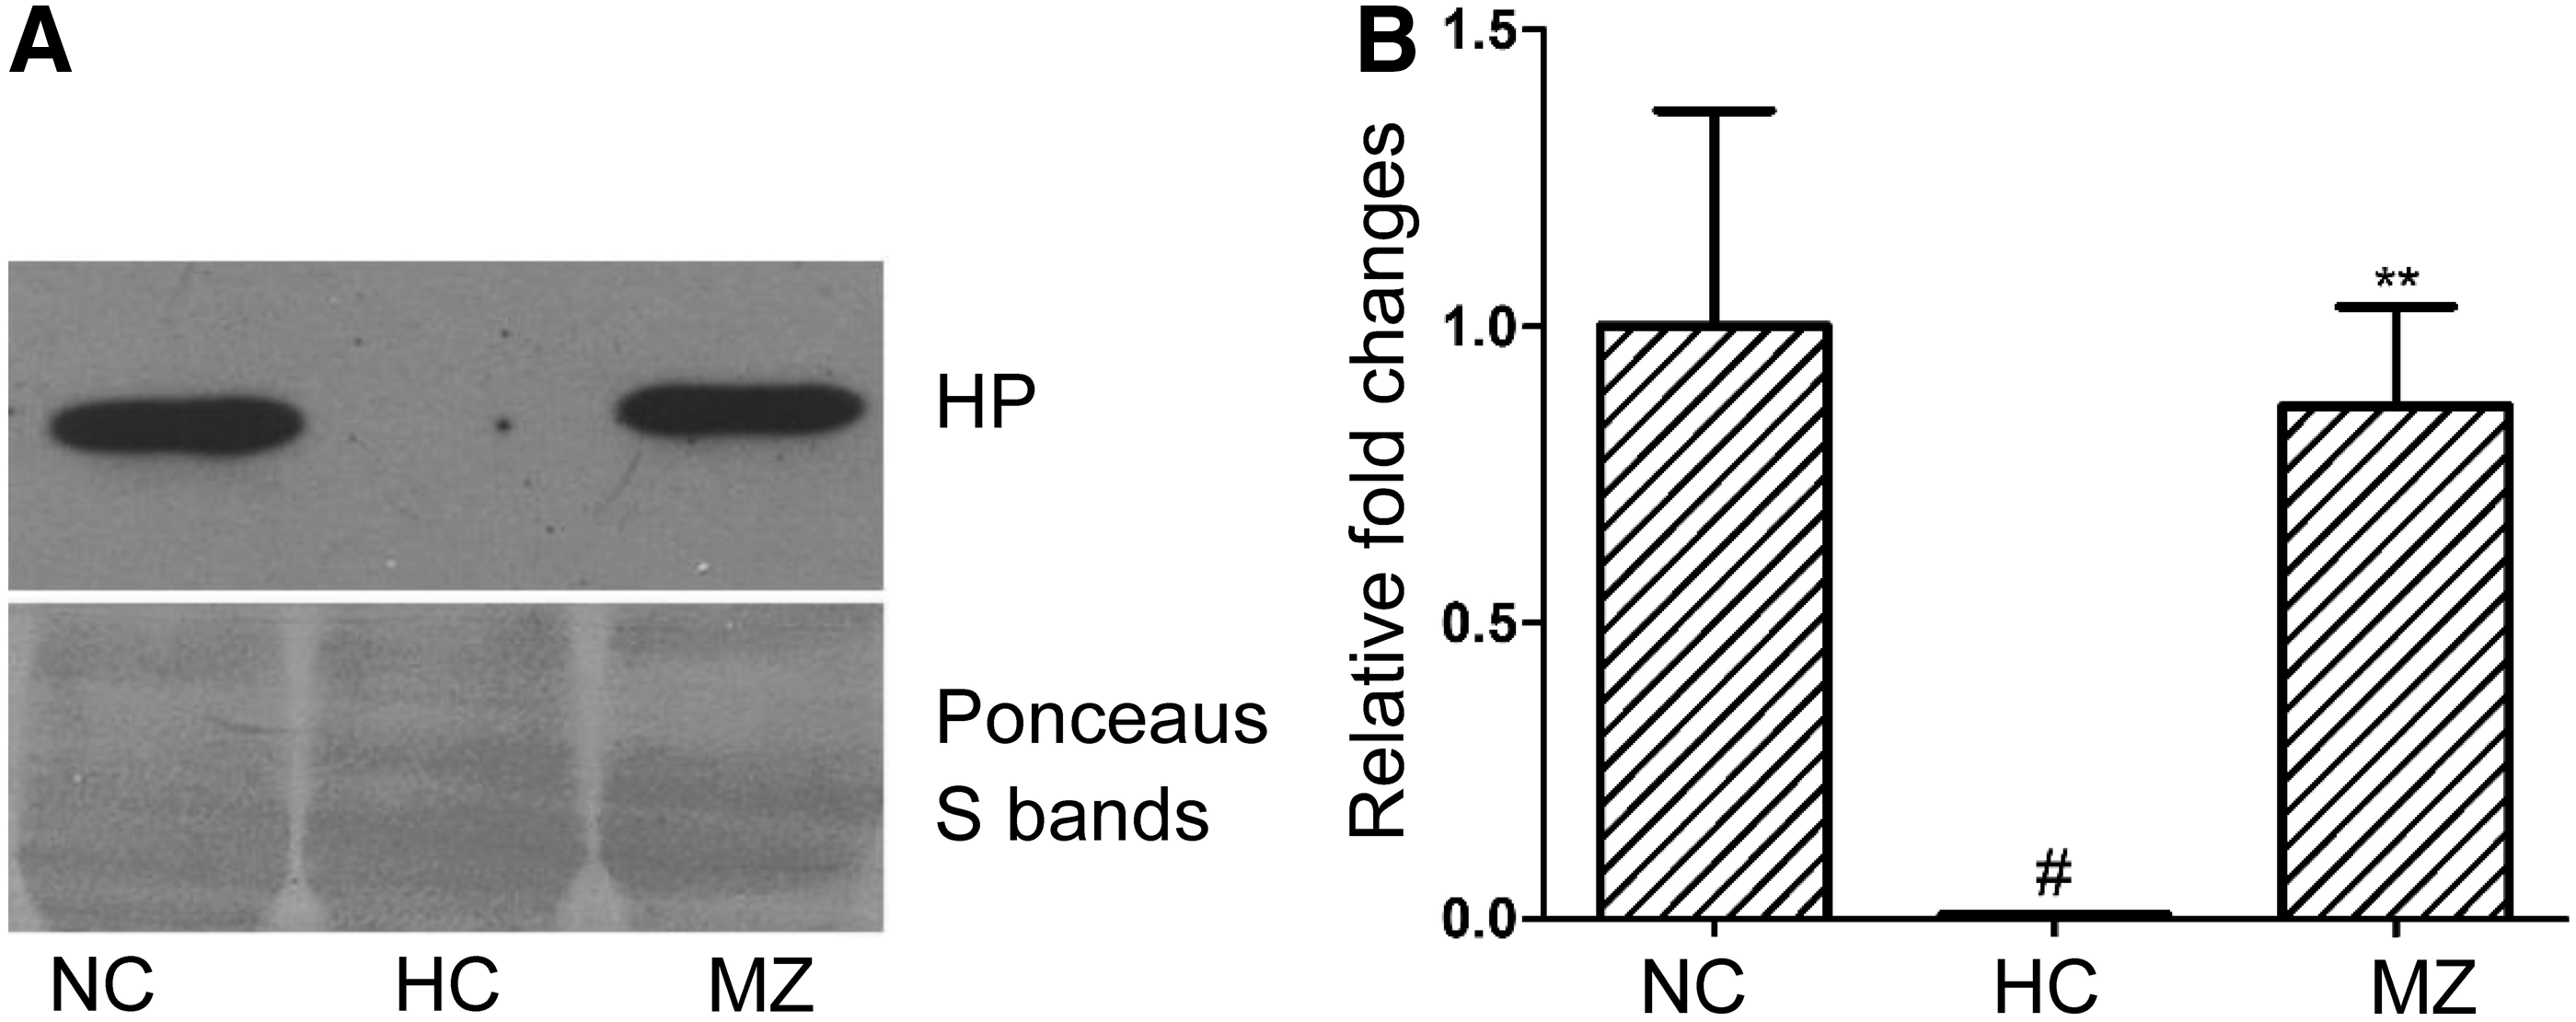
Effect of methazolamide on plasma haptoglobin expression in rats with excessive erythrocytosis. Samples were analyzed by Western blotting with a monoclonal antibody specific to haptoglobin. Representative blots of plasma haptoglobin from the normoxia control group, hypoxia control group, and 30 mg·kg−1·d−1 methazolamide groups are given in
Discussion
Excessive erythrocytosis (hemoglobin >21 g·dL−1 or Hct >63%) characterizes Monge's disease or chronic mountain sickness (Monge and Whittembury, 1976; Villafuerte et al., 2014; Villafuerte, 2015), and exposure to intermittent hypoxia reportedly leads to excessive erythrocytosis (Iwamoto et al., 2005; Siqués et al., 2006; Ishii et al., 2010). In humans, exposure to long-term intermittent hypoxia cycles of weeks causes changes in the total hemoglobin mass and red cell volume similar to those observed in chronic hypoxia (Heinicke et al., 2003). Long-term intermittent hypoxia and permanent hypoxia may have similar total hemoglobin mass and red cell volume as well as similar cardiovascular risk (Heinicke et al., 2003; Herrera et al., 2015). In the current study, the rats exposed to intermittent hypobaric hypoxia (5500 m, 8 hours per day) for 4 weeks exhibited excessive erythrocytosis, as has been reported previously (Li et al., 2014). It was convenient to ensure an 8-hour (9:00 a.m.−17:00 p.m.) hypoxia exposure in the working hours and to replenish food and water supplies and providing clean cages every day. The most important point for using this model is that hemoglobin concentration was above 21 g·dL−1 after exposure to intermittent hypoxia for 4 weeks. In this model, rats with excessive erythrocytosis continued to exhibit elevated hemoglobin (23.2 ± 0.6 g·dL−1) and elevated Hct (64.1% ± 1.1%) after 8 weeks of hypoxia exposure (Fig. 3). These data confirmed that a Wistar rat model of excessive erythrocytosis could be established by intermittent hypobaric hypoxia (5500 m, 8 hours per day) for 4 weeks, and this model could be used to evaluate the efficacy of methazolamide on excessive erythrocytosis.
For the first time, the efficacy of methazolamide (doses of 5–120 mg·kg−1·d−1) in rats with excessive erythrocytosis was investigated. Methazolamide exhibited dose-dependent therapeutic efficacy in the treatment of rats with excessive erythrocytosis, indicating that it may exhibit significant efficacy in human patients with chronic mountain sickness. According to the body surface area normalization method (Reagan-Shaw et al., 2008), doses of 5, 10, 30, 90, and 120 mg·kg−1 methazolamide in rats correspond to respective human equivalent doses of 0.8, 1.6, 4.9, 14.6, and 19.4 mg·kg−1, which equate to respective doses of 48.6, 97.2, 291.6, 875.4, and 1166.4 mg of methazolamide for a 60 kg person. However, dose equivalents between rat and man based on dosing equivalences of the Reagan-Shaw formula is only a starting point. Differing pharmacokinetics likely exist for acetazolamide and methazolamide between rat and man, this may be as a limitation of using dosing equivalences by the Reagan-Shaw formula.
Many studies in rats and humans regarding excessive erythrocytosis treatment with acetazolamide have been published, which may be used for estimations of dose equivalents. Richalet et al. (2005) found that acetazolamide decreased hematocrit by 7.1% and 6.7% for patients with an excessive polycythemia treated with 250 and 500 mg of acetazolamide for 3 weeks, respectively. Acetazolamide decreased hematocrit from 69% to 64% in patients with an excessive polycythemia receiving 250 mg of acetazolamide for 12 or 24 weeks (Richalet et al., 2008). Pichon et al. (2012) found that in a male Wistar rat model, acetazolamide treatment (40 mg·kg−1.day−1) in hypoxic rats decreased hematocrit by about 10%. In this study, acetazolamide treatment (30 mg·kg−1·day−1) in hypoxic rats decreased hematocrit by about 5% and methazolamide treatment (10 mg·kg−1·day−1) in hypoxic rats decreased hematocrit by about 7%. Therefore, 30 mg·kg−1 dose of acetazolamide or 10-mg·kg−1 dose of methazolamide in the rats in this study might have efficacy similar to that of about 250 to 500 mg of acetazolamide in man with regard to decrease in hematocrit, which is in accordance with the result obtained by the Reagan-Shaw formula. Similar pharmacokinetics likely exist for acetazolamide and methazolamide between rat and man.
Richalet et al. reported that prolonged treatment with 250 mg·d−1 acetazolamide (6 months) is well tolerated and efficient in reducing hematocrit, increasing the arterial oxygen pressure, and increasing cardiac output (Richalet et al., 2008). In the current work, a methazolamide dose of 10 mg·kg−1·d−1 has shown similar efficacy to an acetazolamide dose of 30 mg·kg−1·d−1 for all the tested parameters and had no significant effects on body weight (p > 0.05) (Figs. 2, 3, and 4). The subjects took methazolamide, 50 mg, twice daily on the day before ascent and 100 mg twice daily thereafter when methazolamide was used in the prophylaxis of acute mountain sickness (Forster, 1982). Oral methazolamide (40 mg b.i.d.) for 24 weeks for type 2 diabetes patients has been proven safe (Simpson et al., 2014). Therefore, a lower dose of methazolamide (such as 1.6 mg·kg−1 or 100 mg·d−1) might have significant efficacy in patients with excessive erythrocytosis induced by long-term hypoxia (hemoglobin >21 g·dL−1). However, applying these findings to chronic mountain sickness treatment must be done carefully. We caution that extension of the greater protective effects of the very high dosing of methazolamide in rats may not be achievable in humans due to an array of unpleasant side effects particularly if the drug has to be used chronically.
Whole blood viscosity and its oxygen binding capacity are mainly determined by Hct. With increasing Hct, viscosity increases exponentially and oxygen capacity increases linearly. Thus, the Hct-to-viscosity ratio has been widely used as an estimate of red blood cell oxygen transport effectiveness into the microvasculature and as an oxygen delivery index (Nemeth et al., 2009; Waltz et al., 2015; Tikhomirova et al., 2017). In the current study in rats, after long-term hypoxia, the Hct-to-viscosity ratio was reduced substantially, but it increased dose-dependently after methazolamide treatment, indicating that methazolamide improved oxygen delivery capacity in rats with excessive erythrocytosis (Fig. 4F). HIF-1α and VEGF levels were also both substantially increased after long-term hypoxia, and both were reduced by methazolamide treatment, which may indicate that methazolamide improved the oxygen supply to the kidney (Fig. 5). Improved oxygen transport may be an important mechanism contributing to the efficacy of methazolamide.
In previous studies, mice and rats that were chronically exposed to hypobaric conditions developed hemoglobinemia and the depletion of plasma haptoglobin. Hemoglobinemia is associated with the increased hematopoietic effort and it is reversed when the hematopoietic demands are removed, which is consistent with the hypothesis that the hemoglobinemia is secondary to ineffective hematopoiesis (Ou and Smith, 1978; Smith et al., 1979; Bonkovsky et al., 1986). The level of haptoglobin in patients with chronic mountain sickness also decreased with increasing altitude (Zhou et al., 2008). The results of the current study are consistent with these previous reports that plasma hemoglobin was substantially increased, but haptoglobin was depleted after long-term hypoxia. We further found that plasma haptoglobin increased, but plasma hemoglobin decreased after methazolamide treatment (Table 1, Figs. 6 and 8). Owing to the daily cycles of intermittent hypoxia in this study, it is reasonable to consider that with relief of hypoxia, there is a sudden drop in EPO, and the newest released red cells may be degraded by the spleen and reticuloendothelial system, with perhaps some hemolytic products gaining access to the circulation (Rice and Alfrey, 2005). Therefore, it is possible that neocytolysis, the selective destruction of a population of young red blood cells, may have led to the hemoglobinemia and haptoglobin depletion observed in our study and in the other works (Ou and Smith, 1978; Bonkovsky et al., 1986).
Haptoglobin is an a2 glycoprotein that binds free hemoglobin in the plasma of humans and other mammals (Yang et al., 1983). For glycoproteins, the sialic acid content of their different glycoforms shows a negative linear correlation with the pI (isoelectric point), which allows them to be discriminated by two-dimensional gel electrophoresis (Barrabés et al., 2010). Therefore, seven spots with different pIs on the two-dimensional electrophoresis gels were identified to be haptoglobin in the current study (Fig. 6 and Table 2). The resulting circulating haptoglobin–hemoglobin complexes are rapidly taken up by monocytes and tissue macrophages through the CD163 receptor, preventing the generation of reactive oxygen species and renal damage (Thomsen et al., 2013). Haptoglobin concentrations are decreased when free hemoglobin enters the plasma space. Chronic hypoxia is involved in the pathogenesis of chronic renal injury (Fine et al., 2000; Reeves and Leon-Velarde, 2004; Nangaku, 2006; Luks et al., 2008; Shoji et al., 2014). Haptoglobin can attenuate the vascular oxidation and inflammation induced by plasma hemoglobin (Banerjee et al., 2012; Irwin et al., 2015). Haptoglobin treatment also reduces hemoglobin-mediated oxidative toxicity in the kidneys following hemolysis (Chintagari et al., 2015). Haptoglobin may be an important molecular target for chronic mountain sickness-related renal damage treatment and a key molecular indicator of the efficacy of methazolamide. Extracellular hemoglobin was associated with enhanced oxidative reactions, which would induce red blood cell aging and impair oxygen delivery (Rother et al., 2005; Schaer et al., 2013; Mohanty et al., 2014; Rifkind et al., 2015). Therefore, an increase in plasma haptoglobin after methazolamide treatment may be an important mechanism in the improvement of oxygen delivery.
In the current study, chronic hypoxia induced a significant increase in plasma creatinine concentration compared with the normoxia controls, indicating that long-term hypoxia could affect kidney function. The reduction in plasma creatinine in rats with excessive erythrocytosis after methazolamide treatment might indicate the beneficial effect of methazolamide on renal function. However, blood urea nitrogen was unaffected by either chronic intermittent hypoxia or drugs in this study (Table 1). Blood creatinine and urea nitrogen are frequently used as renal injury biomarkers. However, both creatinine and urea nitrogen levels can be affected by several factors other than renal dysfunction and hence their sensitivities were limited only to a certain degree of renal injury (Vaidya et al., 2010). In other words, the changes in creatinine and urea nitrogen may not depend only on changes in renal blood flow and glomerular filtration rate. Therefore, more sensitive and specific renal injury biomarkers should be detected to determine the effects of chronic intermittent hypoxia and methazolamide on renal function.
In the current study, we found that methazolamide exhibits dose-dependent efficacy for the treatment of excessive erythrocytosis induced by long-term intermittent hypoxia. The tested range of 10 to 120 mg·kg−1·d−1 in rats corresponds to human equivalent doses of 0.8 to 19.4 mg·kg−1·d−1 (Reagan-Shaw et al., 2008). However, why did we observe considerably more efficacy with doses of methazolamide that go far beyond those necessary to inhibit carbonic anhydrase (10 mg·kg−1)? Methazolamide is a carbonic anhydrase inhibitor of strength equal to acetazolamide, but it is less bound to plasma proteins, and diffuses more rapidly into tissues (Maren et al., 1993; Wright et al., 2008). The finding that a methazolamide dose of 10 mg·kg−1·d−1 has similar efficacy to an acetazolamide dose of 30 mg·kg−1·d−1 for all the tested parameters in the current study indicates that it has about two times more efficacy than acetazolamide. This is in accordance with the previous report that methazolamide (150 mg·d−1) was as effective as acetazolamide (500 mg·d−1) in preventing the symptoms of acute mountain sickness (Wright et al., 1983). Methazolamide is simply acetazolamide that has a methyl group added to the thiadiazole ring. Therefore, it is to be expected that methazolamide may share many of acetazolamide's effects. The carbonic anhydrase inhibitors, acetazolamide and methazolamide, may act on other mechanisms unrelated to carbonic anhydrase inhibition, including a reduction in aquaporin-mediated transmembrane water transport, antioxidant actions, vasodilation, and anti-inflammatory effects (Swenson, 2016).
Chronic hypoxia also has a role in lipid metabolism (Mälkönen et al., 1982; Siques et al., 2014). In the current study, chronic hypoxia increased the levels of total plasma cholesterol and low-density lipoprotein cholesterol. After methazolamide treatment, these parameters were improved. Plasma high-density lipoprotein levels were unaffected by chronic hypoxia, but methazolamide did increase those levels slightly (Table 1). This implies that methazolamide has beneficial effects on lipid metabolism at high altitudes.
Conclusion
Methazolamide exhibited a dose-dependent efficacy for the treatment of excessive erythrocytosis induced by long-term hypoxia. It improved oxygen transport effectiveness and lipid metabolism. A 10 mg·kg−1·d−1 dose of methazolamide exhibited similar efficacy to a 30 mg·kg−1·d−1 dose of acetazolamide. Although higher doses of methazolamide showed even greater improvements, such a high level of dosing may not be tolerable in humans. Additionally, haptoglobin is a key molecular indicator of the efficacy of methazolamide. The results of the current study support the development of methazolamide-based chronic mountain sickness therapies.
Footnotes
Acknowledgments
This work was supported by the National Key Research Program of China (grant number 2011ZXJ09105-05B), the National Natural Science Foundation of China (grant number 81302415), and the Natural Science Foundation (grant number 16QNP131).
Author Disclosure Statement
No competing financial interests exist.