
Abstract
Abstract
Berendsen, Remco R., Marieke E. van Vessem, Marcel Bruins, Luc J.S.M. Teppema, Leon P.H.J. Aarts, and Bengt Kayser. Electronic nose technology fails to sniff out acute mountain sickness. High Alt Med Biol. 19:232–236, 2018.
Aim:
The aim of the study was to evaluate whether an electronic nose can discriminate between individuals with and without acute mountain sickness (AMS) following rapid ascent to 4554 m.
Results:
We recruited recreational climbers (19 women, 82 men; age 35 ± 10 years, mean ± standard deviation [SD]) upon arrival at 4554 m (Capanna Regina Margherita, Italy) for a proof of concept study. AMS was assessed with the Lake Louise self-report score (LLSRS) and the abbreviated Environmental Symptoms Questionnaire (ESQc); scores ≥3 and ≥0.7 were considered AMS, respectively. Exhaled air was analyzed with an electronic nose (Aeonose; The eNose Company, Netherlands). The collected data were analyzed using an artificial neural network. AMS prevalence was 44% with the LLSRS (mean score of those sick 4.4 ± 1.4 [SD]) and 20% with the ESQc (1.2 ± 0.5). The electronic nose could not discriminate between AMS and no AMS (LLSRS p = 0.291; ESQc p = 0.805).
Conclusion:
The electronic nose technology utilized in this study could not discriminate between climbers with and without symptoms of AMS in the setting of an acute exposure to an altitude of 4554 m. At this stage, we cannot fully exclude that this technology per se is not able to discriminate for AMS. The quest for objective means to diagnose AMS thus continues.
Introduction
A
AMS research relies on questionnaires that score the severity of AMS-related symptoms, such as the Lake Louise self-report score [LLSRS; (Roach et al., 1993)] and the (abbreviated) Environmental Symptoms Questionnaire-III [ESQc; (Beidleman et al., 2007)]. Relying on subjective appreciation of symptom intensity (Bartsch et al., 2004; Roach and Kayser, 2007), neither of these questionnaires can, in our opinion, be considered a gold standard. A reliable biomarker or another objective method to diagnose AMS would help AMS research (Roach and Kayser, 2007). We attempted to discriminate participants with and without AMS with electronic nose technology.
Exhaled gas contains traces of volatile organic compounds (VOCs), like acetone, methanol or isoprene (Miekisch et al., 2004), and small inorganic molecules, like nitric oxide, carbon monoxide (Kharitonov and Barnes, 2001), or carbonyl sulfide (Studer et al., 2001). Some diseases are associated with high concentrations of VOCs, such as untreated diabetes (acetone) or renal insufficiency (isoprene, ammonia) (Buszewski et al., 2007). Exhaled breath analysis by means of electronic nose technology is based on pattern recognition with neural network-based learning without distinguishing specific components (Kort et al., 2017). This technology can differentiate between exhaled VOC profiles of patients and healthy people (Fens et al., 2011a; Bruins et al., 2013; Burfeind et al., 2014; de Heer et al., 2016).
We explored the potential of exhaled VOC analysis for the diagnosis of AMS. Our rationale was based on three premises: (i) Oxidative stress may be involved in AMS pathophysiology (Bailey et al., 2004, 2009a; Bailey et al., 2009b) and at 5000 m a correlation between LLSRS with changes in exhaled malondialdehyde was reported (Araneda et al., 2005); (ii) Systemic disease may lead to changes in absorption, distribution, biotransformation, and/or excretion rate of exogenous VOCs, allowing differentiation with healthy people; and (iii) AMS is accompanied by metabolic stress, which may alter fat, protein, and sugar metabolism, potentially leading to changes in exhaled VOCs patterns (Corradi et al., 2010). We therefore performed a proof of concept study to test whether individuals diagnosed with AMS, according to the LLSRS or ESQc, would be identifiable by their exhaled VOC breath profile measured by an electronic nose.
Materials and Methods
Location and participants
Data were collected at the Capanna Regina Margherita (CRM, 4554 m). Climbers arriving at the CRM during seven consecutive days were invited to participate. The study was observational and registered before data collection (http://trialregister.nl/trialreg/admin/rctview.asp?TC=4073). Purpose and procedure of the study were explained, and written informed consent for participation and publication of anonymized research results obtained. The exclusion criteria were as follows: age <18 years, use of corticosteroids, beta-adrenergic agonists, acetazolamide, or antibiotics, and/or respiratory infection in last 4 weeks. The Medical Ethics Committee of the Leiden University Medical Center approved the study.
Expired air analysis, AMS assessment and clinical measurements
Exhaled breath analysis in rest was done with an electronic nose (The Aeonose™; The eNose Company, Zutphen, The Netherlands). AMS was assessed by the LLSRS and the ESQc. The LLSRS quantifies five symptoms on a 0–3 scale: headache, gastrointestinal distress, fatigue and/or weakness, dizziness and/or light-headedness, and difficulty sleeping. Scores (0: symptom not present, 3: severe or incapacitating) are summed (range 0–15). We defined AMS as presence of headache, plus at least one other symptom, and a total score ≥3 (Roach et al., 1993). The ESQc has 11 questions using a six-point scale, 0 indicating absence of the symptom and 5 indicating maximum intensity. Each item is weighted by a specific factor. The scores are then summed, multiplied by 5 and divided by 25.95, so that the maximum score is 5.0. We used ≥0.7 as cutoff score for AMS (Sampson et al., 1983). Resting heart rate (HR, /min), end-tidal CO2 (ETCO2; kPa), respiratory rate (f, /min), and SpO2 were measured in sitting position, with a handheld monitor (Nellcor OxiMax™ N-85™; Covidien, The Netherlands).
Electronic nose
The electronic nose we used is composed of three small hotplate metal-oxide sensors with varying metal-oxide types and catalyzing agents (Applied Sensors GmBH, Reutlingen, Germany). These sensors behave as semi-conductors at higher temperatures. Depending on temperature oscillations, redox-reactions for different VOCs occurring at the sensor surface result in varying changes in resistance. The electronic nose samples the changes in resistance every 20 seconds using a 32-step sinusoidal modulation of the sensor surface temperature between 260°C and 340°C, which results in a vector of 64 values, every 20 seconds, for each of the three sensors [for more technical information see (Kort et al., 2017)]. These signals then produce a unique ensemble profile. Since sampling takes about 5 minutes, and desorption, cooling and recovery about 10 minutes, we used three devices in parallel to include more participants, so that a maximum of 12 subjects per hour could be recruited.
Data analysis
Data are reported as proportions and means ± standard deviation. The unpaired Student t-test was used to evaluate the differences between groups when continuous data were normally distributed; otherwise the Mann–Whitney U test was used. Cohen's kappa coefficient was used to determine concordance between the LLSRS (≥3), LLSRS, (≥3 without sleep) and the ESQc (>0.7). The data generated by each electric nose were compressed and transformed into a classification model (AMS vs. no AMS) using an artificial neural network (ANN). An ANN is a nonlinear statistical data modeling tool where the complex relationships between input and output are modeled and typical patterns identified. The performance of a good ANN improves over time because it learns from the observation of different data sets. The data analysis was performed with the proprietary software package provided by the company (Aethena; The eNose Company). The software uses similar mathematical ANN routines as in the statistical package R (https://r-project.org/), optimized for this specific type of data [see (Kort et al., 2017)]. ANN output was compared to the dichotomous output of having AMS as defined by a LLSRS (≥3) or an ESQc (≥0.7).
The ANN result is a similarity indication and the chosen threshold value determines the ratio between the outcomes. All possible outcomes were plotted on a receiver operating characteristic (ROC) curve. A diagonal line was drawn in the ROC curve indicating the result when the outcome would be completely random (line of no-discrimination). The larger the distance between the observed results and this line, the better the classification of the results. For both the LLSRS and ESQc the area under the ROC curve (AUC) was calculated. The three devices were mutually compared for outcome differences by logistic regression. SPSS (version 24.0; IBM, Chicago) was used for all statistical analyses, and the significance level was set at p < 0.05. Missing data were ignored. Prism 7 for Mac OS X was used to create the graphs (GraphPad Software, version 7.0a, La Jolla, CA).
Results
Climbers were approached upon arrival, after a strenuous climb up to the CRM, according to assessment capacity (up to maximal 12 participants/h), nobody refused; 101 climbers arriving at the hut (one in three) could be included (Table 1). Average sleeping altitude the night before arrival was 3626 ± 347 m. With the exception of four (two CRM staff members and two participants returning from a day climb) measurements were done within 4 hours after climbing up to the CRM. There were two missing ESQc scores.
Participants are divided according to the LLSRS (≥3) and ESQc (≥0.7, 2 missing values, N = 99).
Mean ± standard deviation. *p < 0.050 compared to non-AMS.
LLSRS, Lake Louise Self-Report Score; ESQc, Environmental Symptoms Questionnaire; AMS, acute mountain sickness; BMI, body mass index; HR, heart rate; f, breathing frequency; ETCO2, end-tidal CO2 (mmHg).
LLSRS AMS prevalence was 44% with an average score of the sick of 4.3 ± 1.4; ESQc AMS prevalence was 20%, with an average score of the sick of 1.2 ± 0.5. Concordance (Cohen's κ) between LLSRS ≥3 and ESQc ≥0.7 was 0.41 (95% confidence interval [CI], 0.25–0.57; p < 0.005), that is, moderate (Landis and Koch, 1977). Analysis was repeated after exclusion of the LLSRS sleep item because it is not part of the ESQc and all participants except four had slept at lower altitudes than 4554 m. Concordance then increased to 0.60 (95% CI, 0.42–0.78; p < 0.0005), also moderate (Landis and Koch, 1977). HR, SpO2, and ETCO2 differed significantly between AMS and non-AMS according to the LLSRS. Only HR showed a significant difference between AMS and non-AMS according to the ESQc (Table 1).
Logistic regression showed no difference between the three noses (p = 0.307). Exhaled breath analysis showed no ANN predicted value differences between AMS and no AMS according to both the LLSRS and ESQc scores. ROC curves could not discriminate between AMS and no AMS. The AUC for the LLSRS was 0.56 ± 0.06 (95% CI, 0.443–0.680; p = 0.288) and the AUC for the ESQc was 0.52 ± 0.08 (95% CI, 0.356–0.680; p = 0.800) (Fig. 1a, b).
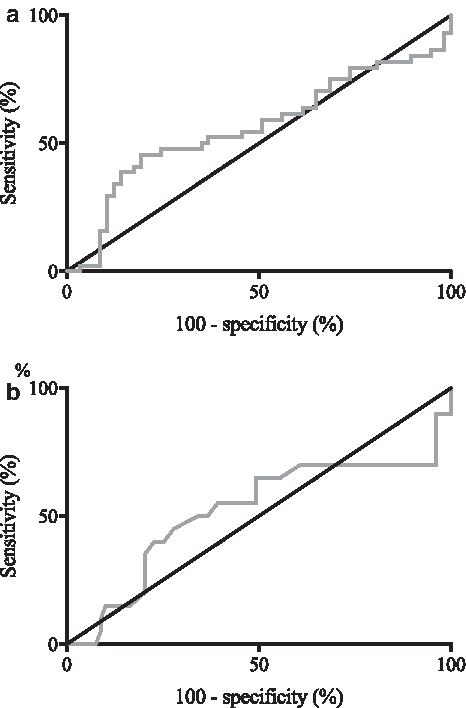
ROC curve for diagnosing AMS with the eNose
Discussion
We tested whether an electronic nose, by means of exhaled VOC analysis, can discriminate climbers with AMS from healthy climbers. The ancient Greek already knew that some diseases could be diagnosed from the characteristic odor of the patients' breath (sweet, fruity, acetone odor in patients with uncontrolled diabetes; musty, fishy reek of advanced liver disease; see Gordon, 1949). Exhaled air testing started when Nobel Prize winner Linus Pauling reported the presence of 250 VOCs in exhaled air (Pauling et al., 1971).
Modern electronic nose technology does not detect individual compounds but assesses an ensemble signature reflecting overall exhaled VOC content. The nose we used, is able to diagnose tuberculosis (Bruins et al., 2013), acute puerperal metritis in cows (Burfeind et al., 2014), invasive pulmonary aspergillosis in cystic fibrosis patients (de Heer et al., 2016), and can discriminate between asthma with persistent airflow limitation and COPD (Fens et al., 2011b). We expected exhaled breath analysis with this particular electronic nose to be a potential noninvasive method for detection of a specific breath profile related to AMS. Our results indicate that, in our particular experimental conditions and with the applied technology, this was not possible. It follows that the quest for an objective method for the diagnosis of AMS is still open.
Our negative findings are compatible with five nonmutually exclusive possible explanations: (i) the technology used was not sensitive enough to detect subtle early changes in moderate AMS; average LLSRS in those with a score ≥3 was 4.3 ± 1.4, which according to Luks et al. (2014) stands for mild AMS; (ii) the neural network learning algorithms may not be sensitive enough to pick up subtle differences; (iii) an absence of changes in VOCs in AMS; (iv) an effect of the lower partial pressure of oxygen at altitude on the sensor reaction of the electronic nose; and (v) the absence of a reliable gold standard for diagnosing AMS may introduce a fuzzy frontier between AMS and no AMS, confusing the neuronal network.
This electronic nose uses metal-oxide sensors (e.g., SnO2) and under normal circumstances oxygen blocks the electron transitions at the surface of the SnO2 sensor grid. The redox reaction with the VOCs causes the electron transitions to open, creating a current. Unpublished data showed an asymptotic increase in conductivity with decreasing oxygen fraction. In the absence of oxygen no reaction will take place at the sensor no matter how much VOCs there are in the sample. Tests in the 15%–21% FiO2 range showed normal function of the sensor. Since the average barometric pressure at the CRM (591 ± 1 hPa) corresponds to 12.3% O2 FiO2 at 1 atm, some effect of decreased O2 may have played a role, but would have affected both groups equally.
Our study was sufficiently powered to identify any clinically relevant differences between participants with and without AMS. AMS prevalence was 44% with the LLSRS and 20% with the ESQc. The ESQc cutoff has been reported before to lead to lower prevalence of AMS than the LLSRS and these questionnaires do not identify the same population as suffering from AMS. After adjusting the cutoff of the LLSRS to 5, to come to similar prevalence (Dellasanta et al., 2007), Cohen's κ coefficient reached 0.58 (95% CI, 0.36–0.79; p < 0.0005), a moderate strength of agreement. Although there were sufficient climbers suffering from AMS to allow identification of a strong signal in the exhaled breath samples, the severity of AMS in our sample was limited; there were only few participants with moderate or severe AMS (LLSRS ≥6; N = 6), leaving the possibility open that more severe AMS might lead to measurable VOCs changes.
Limitations and strengths
Some limits to our study design should be taken into account. First, electronic nose technology is rapidly developing and still in its infancy. Our negative findings do not exclude that a subsequent generation of similar technology might discriminate between AMS and no AMS.
Second, for the majority of participants, time between exposure to the CRM altitude and the measurement was short (<4 hours). AMS was therefore still in the dynamics of its early phase so we cannot exclude that longer exposure, after spending a night at the hut, would lead to differences. The participants answered the question about sleep, in the LLSRS, in respect to their last night spent, for most at an altitude below 4554 m. Some of the participants with scores below the threshold might have been on the way of passing the threshold and if exposure had been prolonged they would presumably have fallen sick. Perhaps the changes in exhaled VOCs appear after AMS symptoms manifest and therefore AMS score increases, and the relationship would only have shown up at a later stage, since scores are generally greatest in the early morning.
Third, given the fact that there are no objective means to diagnose AMS, we had to rely on the results of two popular questionnaires, the LLSRS and ESQc. We were therefore forced to use the prevalence estimates from these questionnaires, which suffer from bias related to the use of questionnaires in general and that of altitude illness questionnaires in particular. But since no objective method exists there was no alternative.
And fourth, since we recruited at the CRM among an international public coming from all over Europe it was impossible to obtain paired low altitude data for comparison.
As strengths of our study the number of included participants is worth mentioning, making the risk of a type-II error more unlikely, and the relative high prevalence of AMS in this particular study setting allowing for sufficient contrast between sick and healthy participants.
Conclusion
Currently, the used electronic nose technology cannot discriminate between climbers with and without symptoms of AMS in the setting of an acute exposure to an altitude of 4554 m. At this stage, we cannot fully exclude that this technology per se is not able to discriminate for AMS. The quest for objective means to diagnose AMS thus continues and it remains to be investigated whether another electronic nose might be of use for the diagnosis of AMS in other settings or of other altitude-related illnesses.
Footnotes
Acknowledgments
We would like to thank the staff of the Capanna Regina Margherita (CRM) for their hospitality and generosity. A very special gratitude goes out to all the participants without whom this study was not possible. Further, we are grateful to the Dutch Climbing and Mountaineering federation for their support with housing in the CRM. Finally, we would like to thank Ron Wolterbeek for his support with the statistics and Marloes Bolman with the data collection in the CRM.
Author Disclosure Statement
R.R.B. has no relevant financial or nonfinancial relationships to disclose. M.E.v.V. has no relevant financial or nonfinancial relationships to disclose. M.B. is employed by the company producing the electronic nose used for this study. The company provided the devices, mouth pieces, and filters free of cost. The field data were collected without presence of company members. The collected nose data were transferred to the company for analysis with their proprietary Aethena software. The company was not involved in any other analysis. There was prior formal agreement that the study results would be published whatever the outcome. L.J.S.M.T. has no relevant financial or nonfinancial relationship to disclose. L.P.H.J.A. has no relevant financial or nonfinancial relationships to disclose. B.K. has no relevant financial or nonfinancial relationships to disclose.