
Abstract
Abstract
Huang, Shu-Chun, Kuo-Cheng Liu, Alice M.K. Wong, Shih-Chieh Chang, and Jong-Shyan Wang. Cardiovascular autonomic response to orthostatic stress under hypoxia in patients with spinal cord injury. High Alt Med Biol. 19:201–207, 2018.
Aims:
Determining whether systemic hypoxia aggravates the severity of autonomic cardiovascular dysfunction in orthostatic stress among patients with spinal cord injuries (SCIs).
Methods:
Twenty-four male patients with chronic SCI whose neurological levels were above T6 were recruited. Twenty-five healthy men were enrolled in the control group. Five-minute supine rest (SR) and head-up tilt (HUT) at 60° were performed in normoxia and after 1 hour, 13.5% fraction of inspired O2 exposure. A noninvasive cardiac output (CO) monitor was used to measure stroke volume (SV), CO, total peripheral resistance (TPR), and blood pressure (BP), whereas heart rate variability (HRV) was performed to determine cardiac autonomic activity. Digital volume pulse analysis was applied to measure arteriolar tone.
Results:
In normoxia from SR to HUT, systolic and diastolic BPs declined, SV decreased, and heart rate increased, whereas CO and TPR showed a declining trend in the SCI group. Sympathetic activation and vagal withdrawal were also disclosed in the HRV analysis. In hypoxia, the change of these cardiovascular responses from SR to HUT exhibited no difference to normoxia in the SCI group. No significant difference in arterial desaturation was observed between the two groups (82.9% vs. 80.4%).
Conclusions:
Cardiovascular adaptation to orthostatic stress is not affected by subacute steady-state hypoxia in chronic SCI patients with neurological levels higher than T6.
Introduction
H
Nonetheless, few studies have investigated the combined influence of hypoxia and posture change on the cardiovascular autonomic system in patients (Pokorski et al., 1990a, 1990b) with SCIs. Compared with the healthy population, patients with SCI who are exposed to hypoxic environments might have several cardiovascular disadvantages. First, hypoxia causes peripheral vascular dilatation, which might exacerbate orthostatic hypotension (Klausen, 1966; Vogel et al., 1974). Second, our previous study showed that autonomic cardiac response is attenuated in 12% hypoxia in healthy men (Huang et al., 2009), which might aggravate orthostatic hypotension as well. Meanwhile, the cardiovascular deconditioning, commonly observed in patients with SCI, impaired vasomotor response during posture change (Krassioukov et al., 2009). In addition, the prevalence of anemia is roughly 50% in the SCI population, which decreases tissue oxygen delivery (Hirsch et al., 1991; Lipetz et al., 1997). Pulmonary vasoconstriction caused by systemic hypoxia may further decrease venous return (Moudgil et al., 2005).
We hypothesized that hypoxia exacerbates orthostatic hypotension in patients with SCI compared with normoxia. In the present study, a 13.5% normobaric hypoxia was given to patients with high-level SCI. Hemodynamic characteristics were measured during posture change under steady-state hypoxia to investigate the combined effect of physical and chemical stimulations on the autonomic cardiovascular system.
Materials and Methods
Participants
Twenty-four male patients with SCI whose neurological levels were above T6 were recruited. The bone injury level ranged from C2 to T6 spine. Among them, two had a neurologic injury in the thoracic level. The duration after disease onset ranged from 3 to 289 months (46 ± 15 months). Twenty-five age- and body mass index-matched healthy men without cardiovascular illness were enrolled in the healthy control group. The patients were assessed in accordance with the International Standards for Neurological Classification of Spinal Cord Injury in 2000 (Marino et al., 2003) (Table 1). The study was performed in accordance with the Declaration of Helsinki and was approved by the Institution Review Board of Chang Gung Memorial Hospital. All the participants gave informed consent after the experimental procedures were explained.
Mean ± standard error of mean.
BMI, body mass index; SaO2, oxygen saturation, arterial; SCI, spinal cord injury.
Protocol
The participants were asked to refrain from caffeine, alcohol, or staying up late at night 24 hours before the test. Food or water intake was prohibited for 2 hours before the test. All the subjects arrived at the testing center at 10:00 AM to eliminate any possible diurnal effect. The participants underwent cardiovascular measurement in normobaric normoxic and hypoxic conditions, respectively, in random order on separate days. They were instructed to wear a breathing facemask connected to a hypoxic air generator (Colorado Altitude Training™) set at 13.5% oxygen concentration. Hypoxia exposure was started 1 hour before the autonomic cardiovascular measurement. The test was discontinued if the blood oxygen saturation decreased to <75%. Before the test, all the participants were asked to keep supine rest (SR) for 15 minutes in a quiet and temperature-controlled testing room under 24°C. During the test, the subjects were asked to maintain SR posture and then head-up tilt (HUT) at 60° for 5 minutes, respectively. Cardiovascular response to hypoxia and HUT were evaluated at the 1st, 3rd, and 5th minute during each posture, including noninvasive cardiac output (CO) monitor, heart rate variability (HRV), and digital volume pulse (DVP) (Fig. 1).
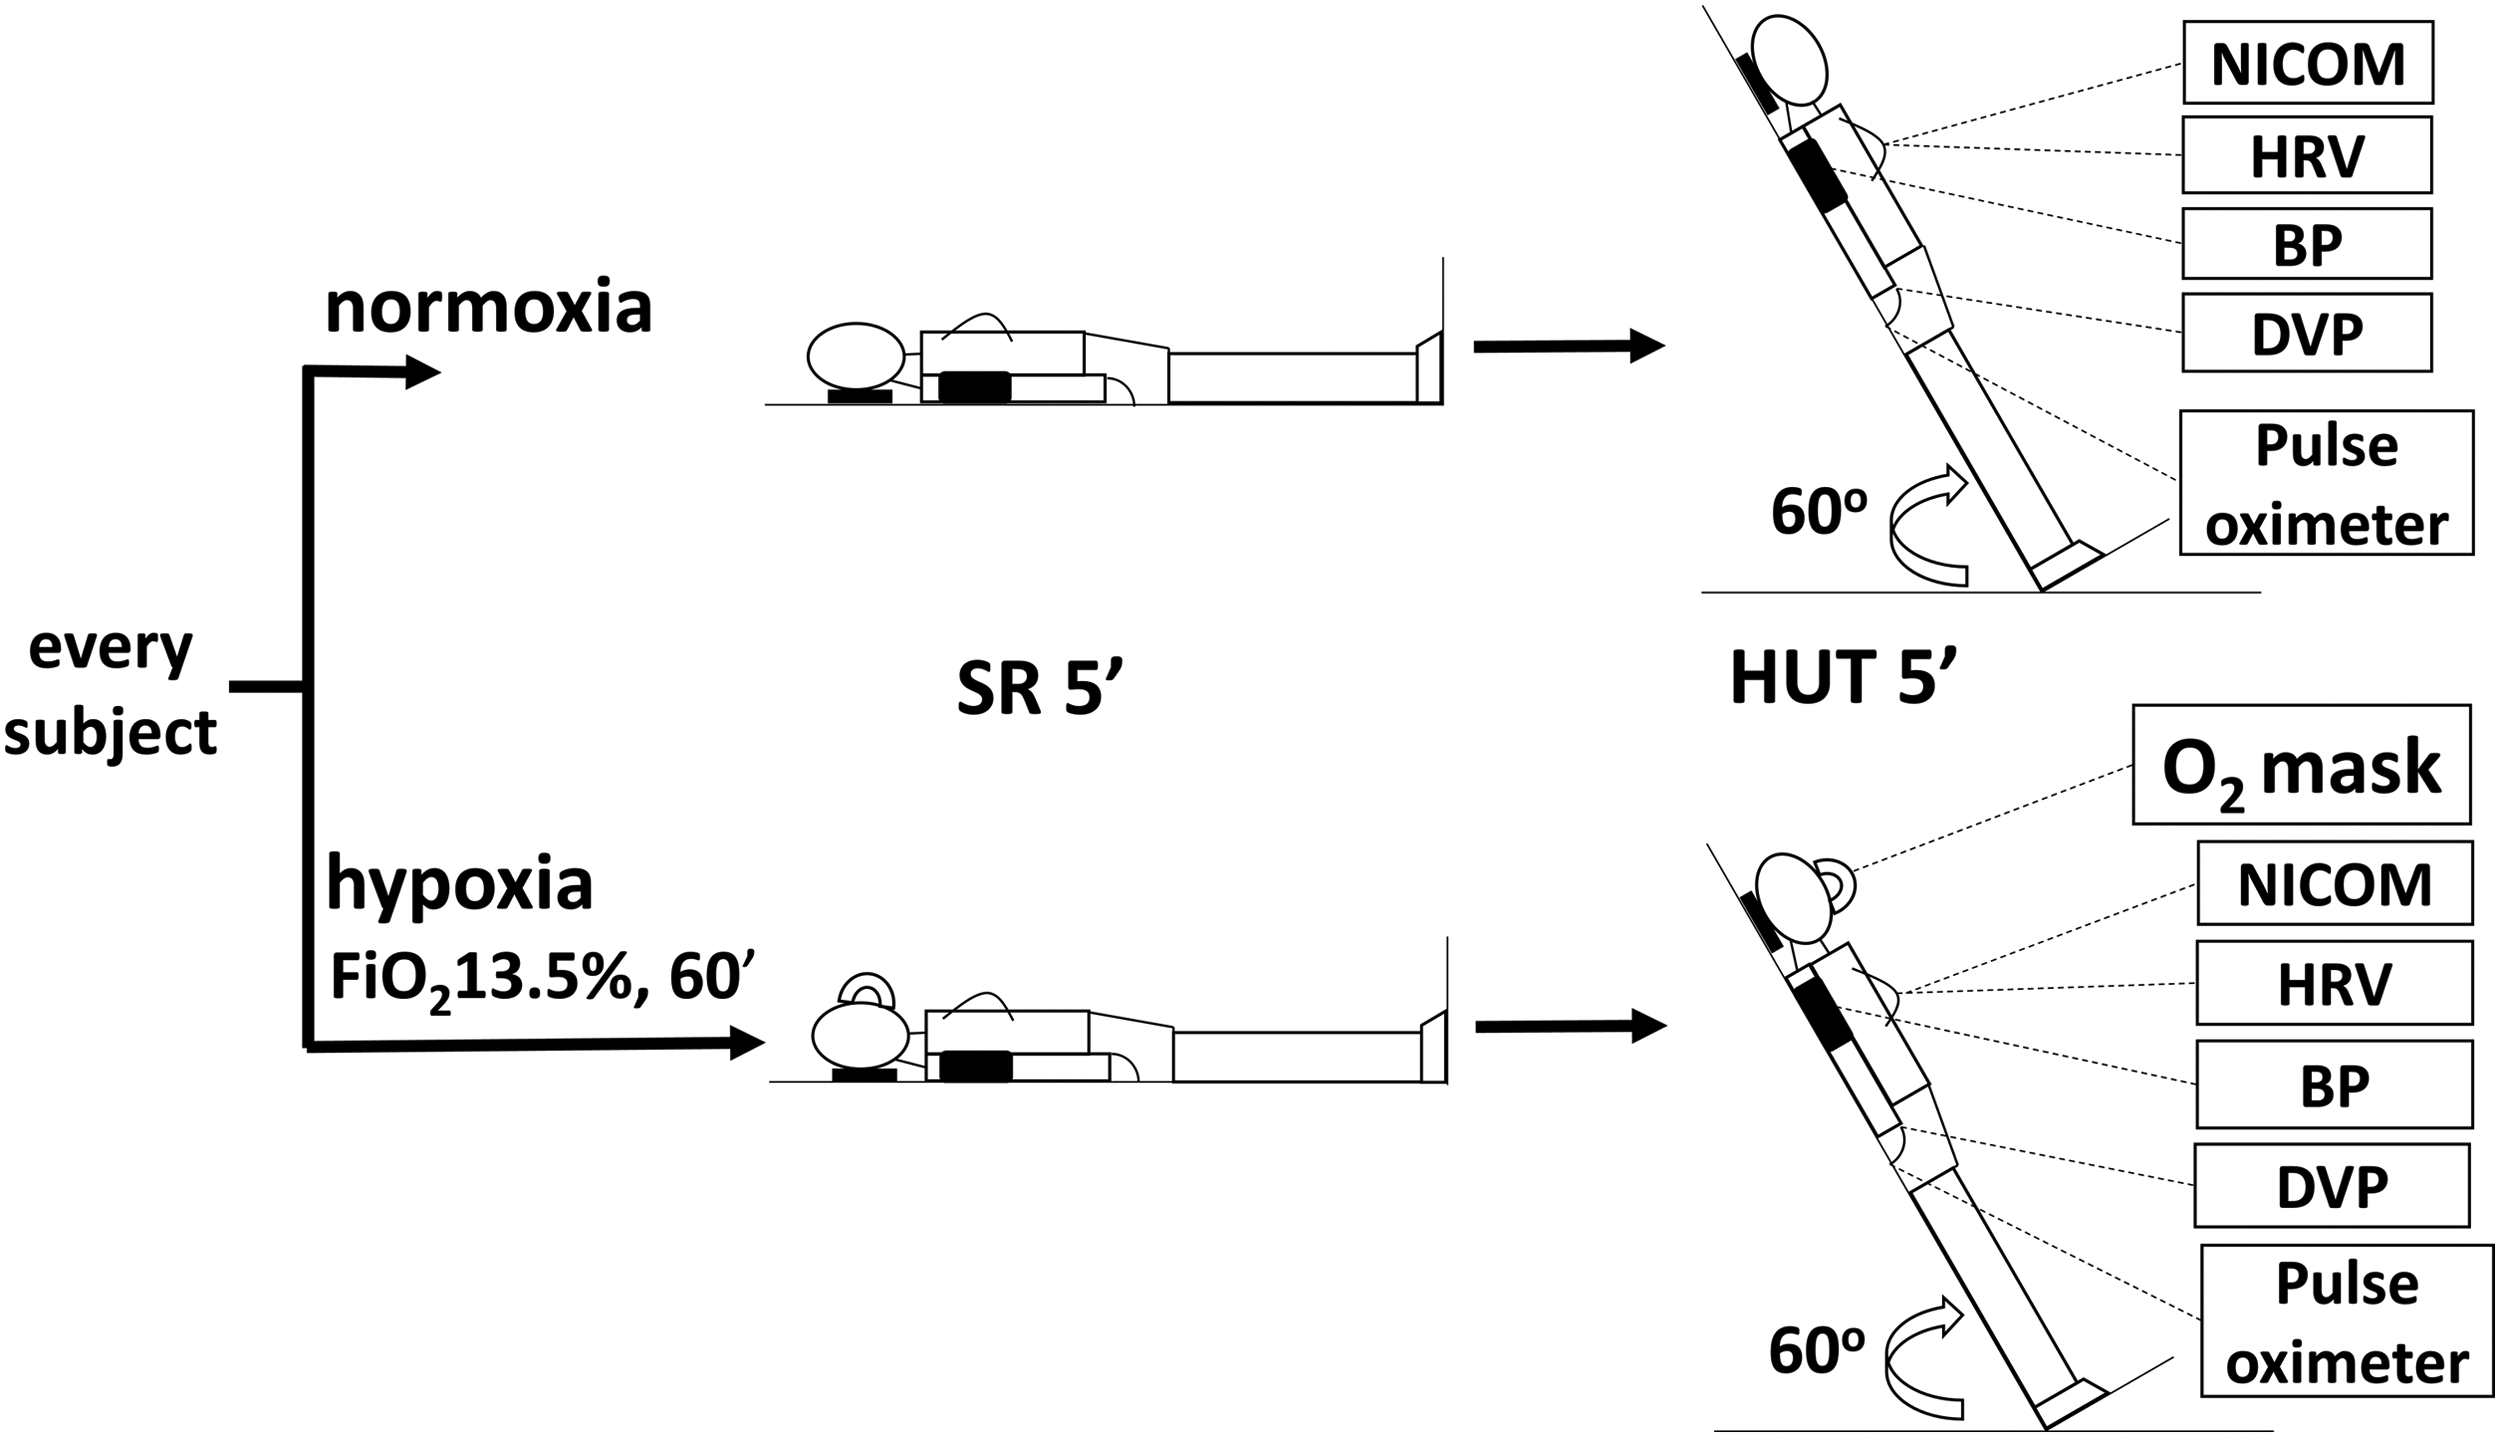
Every participant received the tests under normoxia and hypoxia in a random order on separate days. Before the hemodynamics was collected, all the participants were asked to keep SR for 15 minutes in a quiet and temperature-controlled testing room under 24°C. Cardiovascular response to hypoxia and HUT were evaluated at the 1st, 3rd, and 5th minute during each posture. BP, blood pressure; DVP, digital volume pulse; HUT, head-up tilt; NICOM, noninvasive cardiac output monitor; SR, supine rest.
Noninvasive CO monitor
Cardiac hemodynamics was measured using noninvasive cardiac output monitor (NICOMRa; Cheetah Medical, Wilmington, DE). The validity and reliability of CO measurement at rest in healthy people and patients with heart failure were already established, and its use has been reported in several studies (Keren et al., 2007; Myers et al., 2007; Maurer et al., 2009; Rosenblum et al., 2010; Huang et al., 2015). The regression of CO measured from the NICOM in comparison with that measured from the thermos-dilution method for 27 cardiac patients showed good correlation (R = 0.9). Four dual-surface electrodes were placed on the anterior chest to establish electrical contact with the body. The phase shifts (dΦ) derived from the contraction of the left ventricle followed by blood flow into the thoracic aorta were recorded. The greater the cardiac stroke volume (SV), the more significant these phase shifts become. Therefore, this device measures SV (mL/beat) and CO (L/min) in a noninvasive, continuous manner and in real-time. SV is estimated with the product of C·VET·dΦ/dtmax, where C is a constant of proportionality and VET denotes the ventricular ejection time determined from the NICOM and electrocardiographic signals. Other hemodynamic variables were calculated using the following equation: CO = SV × HR, where HR is heart rate; total peripheral resistance (TPR) = mean arterial pressure (MAP)/CO.
Heart rate variability
Spectral analysis of HRV was used to evaluate the cardiac autonomic nervous system activity. In the HRV measurement, power spectra were calculated by computing the magnitude squared of the fast Fourier transform based on data points obtained from the 300-second tachometer signal. The recorded ECG signals were retrieved to measure the consecutive R-R intervals, which are the time intervals between successive pairs of QRS complexes, by using the software for the detection of R waves. The main outcome variables in frequency domain involved total power (TP), power spectral densities in very low frequency (VLF; 0–0.04 Hz), low frequency (LF; 0.05–0.15 Hz), high frequency (HF; 0.15–0.40), normalized LF and HF [i.e., normalized low-frequency power (nLF) = 100 × LF/(TP − VLF) and normalized high-frequency power (nHF) = 100 × HF/(TP − VLF), respectively], and ratio of LF to HF (LF/HF). Cardiac vagal activity is the major contributor to the HF component. Although the LF rhythm appears to have a widespread neural genesis, nLF mainly reflects the sympathetic modulation of the heart. Moreover, the LF/HF ratio is considered to mirror sympathovagal balance or to reflect sympathetic modulations (Malik, 1996; Huang et al., 2009).
Digital volume pulse
DVP (Micro Medical Trace, PT1000) is a photoelectric plethysmograph, which measures pulsatile change in blood volume during the cardiac cycle. Two variables are recorded. Reflection index (RI) equals the amplitude of reflection wave divided by the directly transmitted wave. Stiffness index (SI; m/s) equals body height divided by peak-to-peak time (pulse propagating time) (Laurent et al., 2006; Millasseau et al., 2006). It has been validated in different settings and diseases (Millasseau et al., 2000, 2002, 2006; Laurent et al., 2006; Tsai et al., 2012). In accordance with the device program, each value is yielded by averaging the values in a 10-second period. The recorded SI and RI values were then processed to determine a final value by the following rule. The first three SI values produced a median. If the other two values were within 10% discrepancy compared with the median, the three values were averaged. If one or both values were beyond 10% discrepancy, DVP was continuously recorded until two other new values were obtained. The five values were ranked by size and yielded a new median. The second, fourth, and median values were averaged if they were within 10% discrepancy compared with the median. If not, the other two new values were consecutively obtained and produced seven values and so on. The three RI values selected to be averaged were based on the simultaneous SI that were selected. Test–retest reliability was determined in 10 subjects on separate days. The intraclass correlation coefficient of SI and RI were 0.99 and 0.93, respectively.
Statistical analyses
Data are expressed as mean ± standard error of the mean. The statistical software package SPSS 18.0 version was adopted. A paired t-test was used to compare the hemodynamics during hypoxia versus normoxia or SR versus HUT. An independent t-test was used to compare the SCI and control groups. Two-way repeated measure analysis of variance (ANOVA) was adopted to compare the conditions in normoxia and hypoxia between the two groups. Significance was defined as a p value of <0.05. GPower 3.1 was used to calculate effect size and power.
Results
The demographic characteristics, including age, body height, body weight, and body mass index, showed no significant differences between the two groups (Table 1). After 60-minute 13.5% fraction of inspired oxygen (F
In normoxia from SR to HUT, systolic blood pressure (SBP) and diastolic blood pressure (DBP) decreased (Fig. 2), SV decreased, and HR increased significantly (Fig. 3), whereas CO and TPR showed a declining trend in the SCI group (Fig. 4). Meanwhile, increases in LF/HF and nLF in association with reduced high-frequency power (HFP) and nHF were disclosed (Table 2).

SBP and DBP of SCI patients and normal control at SR and HUT during normoxia and hypoxia are demonstrated in
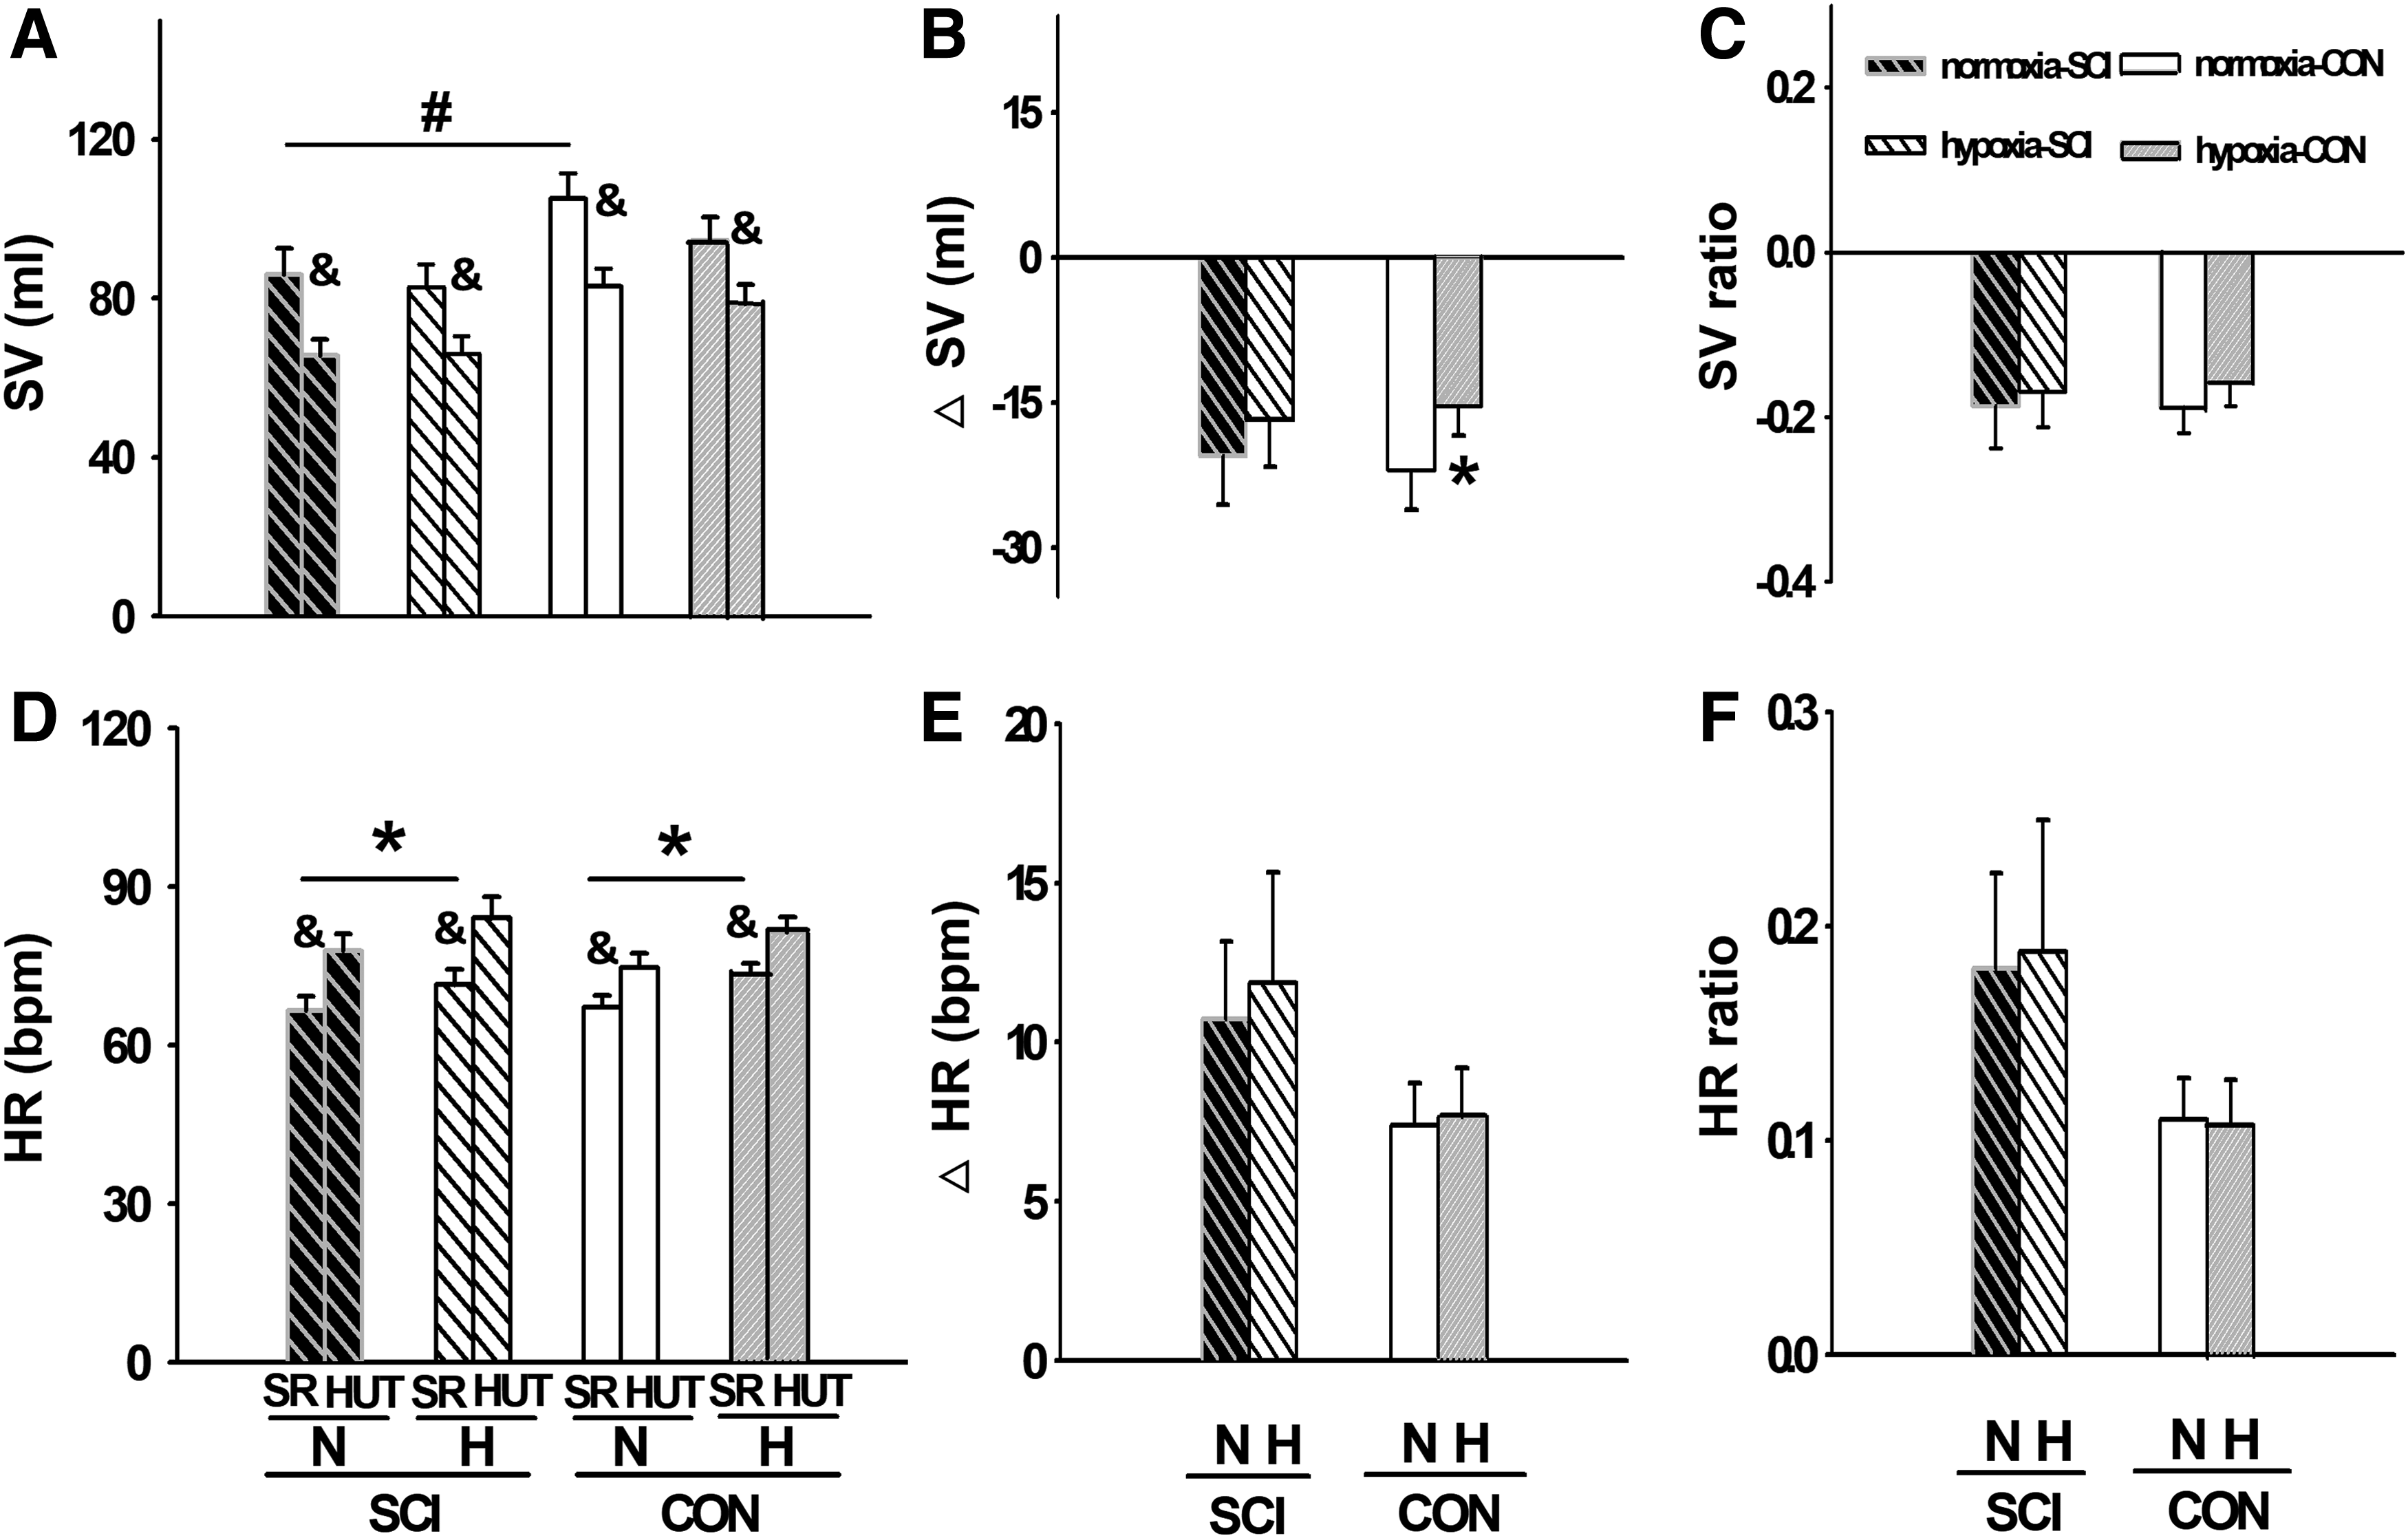
SV and HR of SCI patients and normal control at SR and HUT during normoxia and hypoxia are demonstrated in
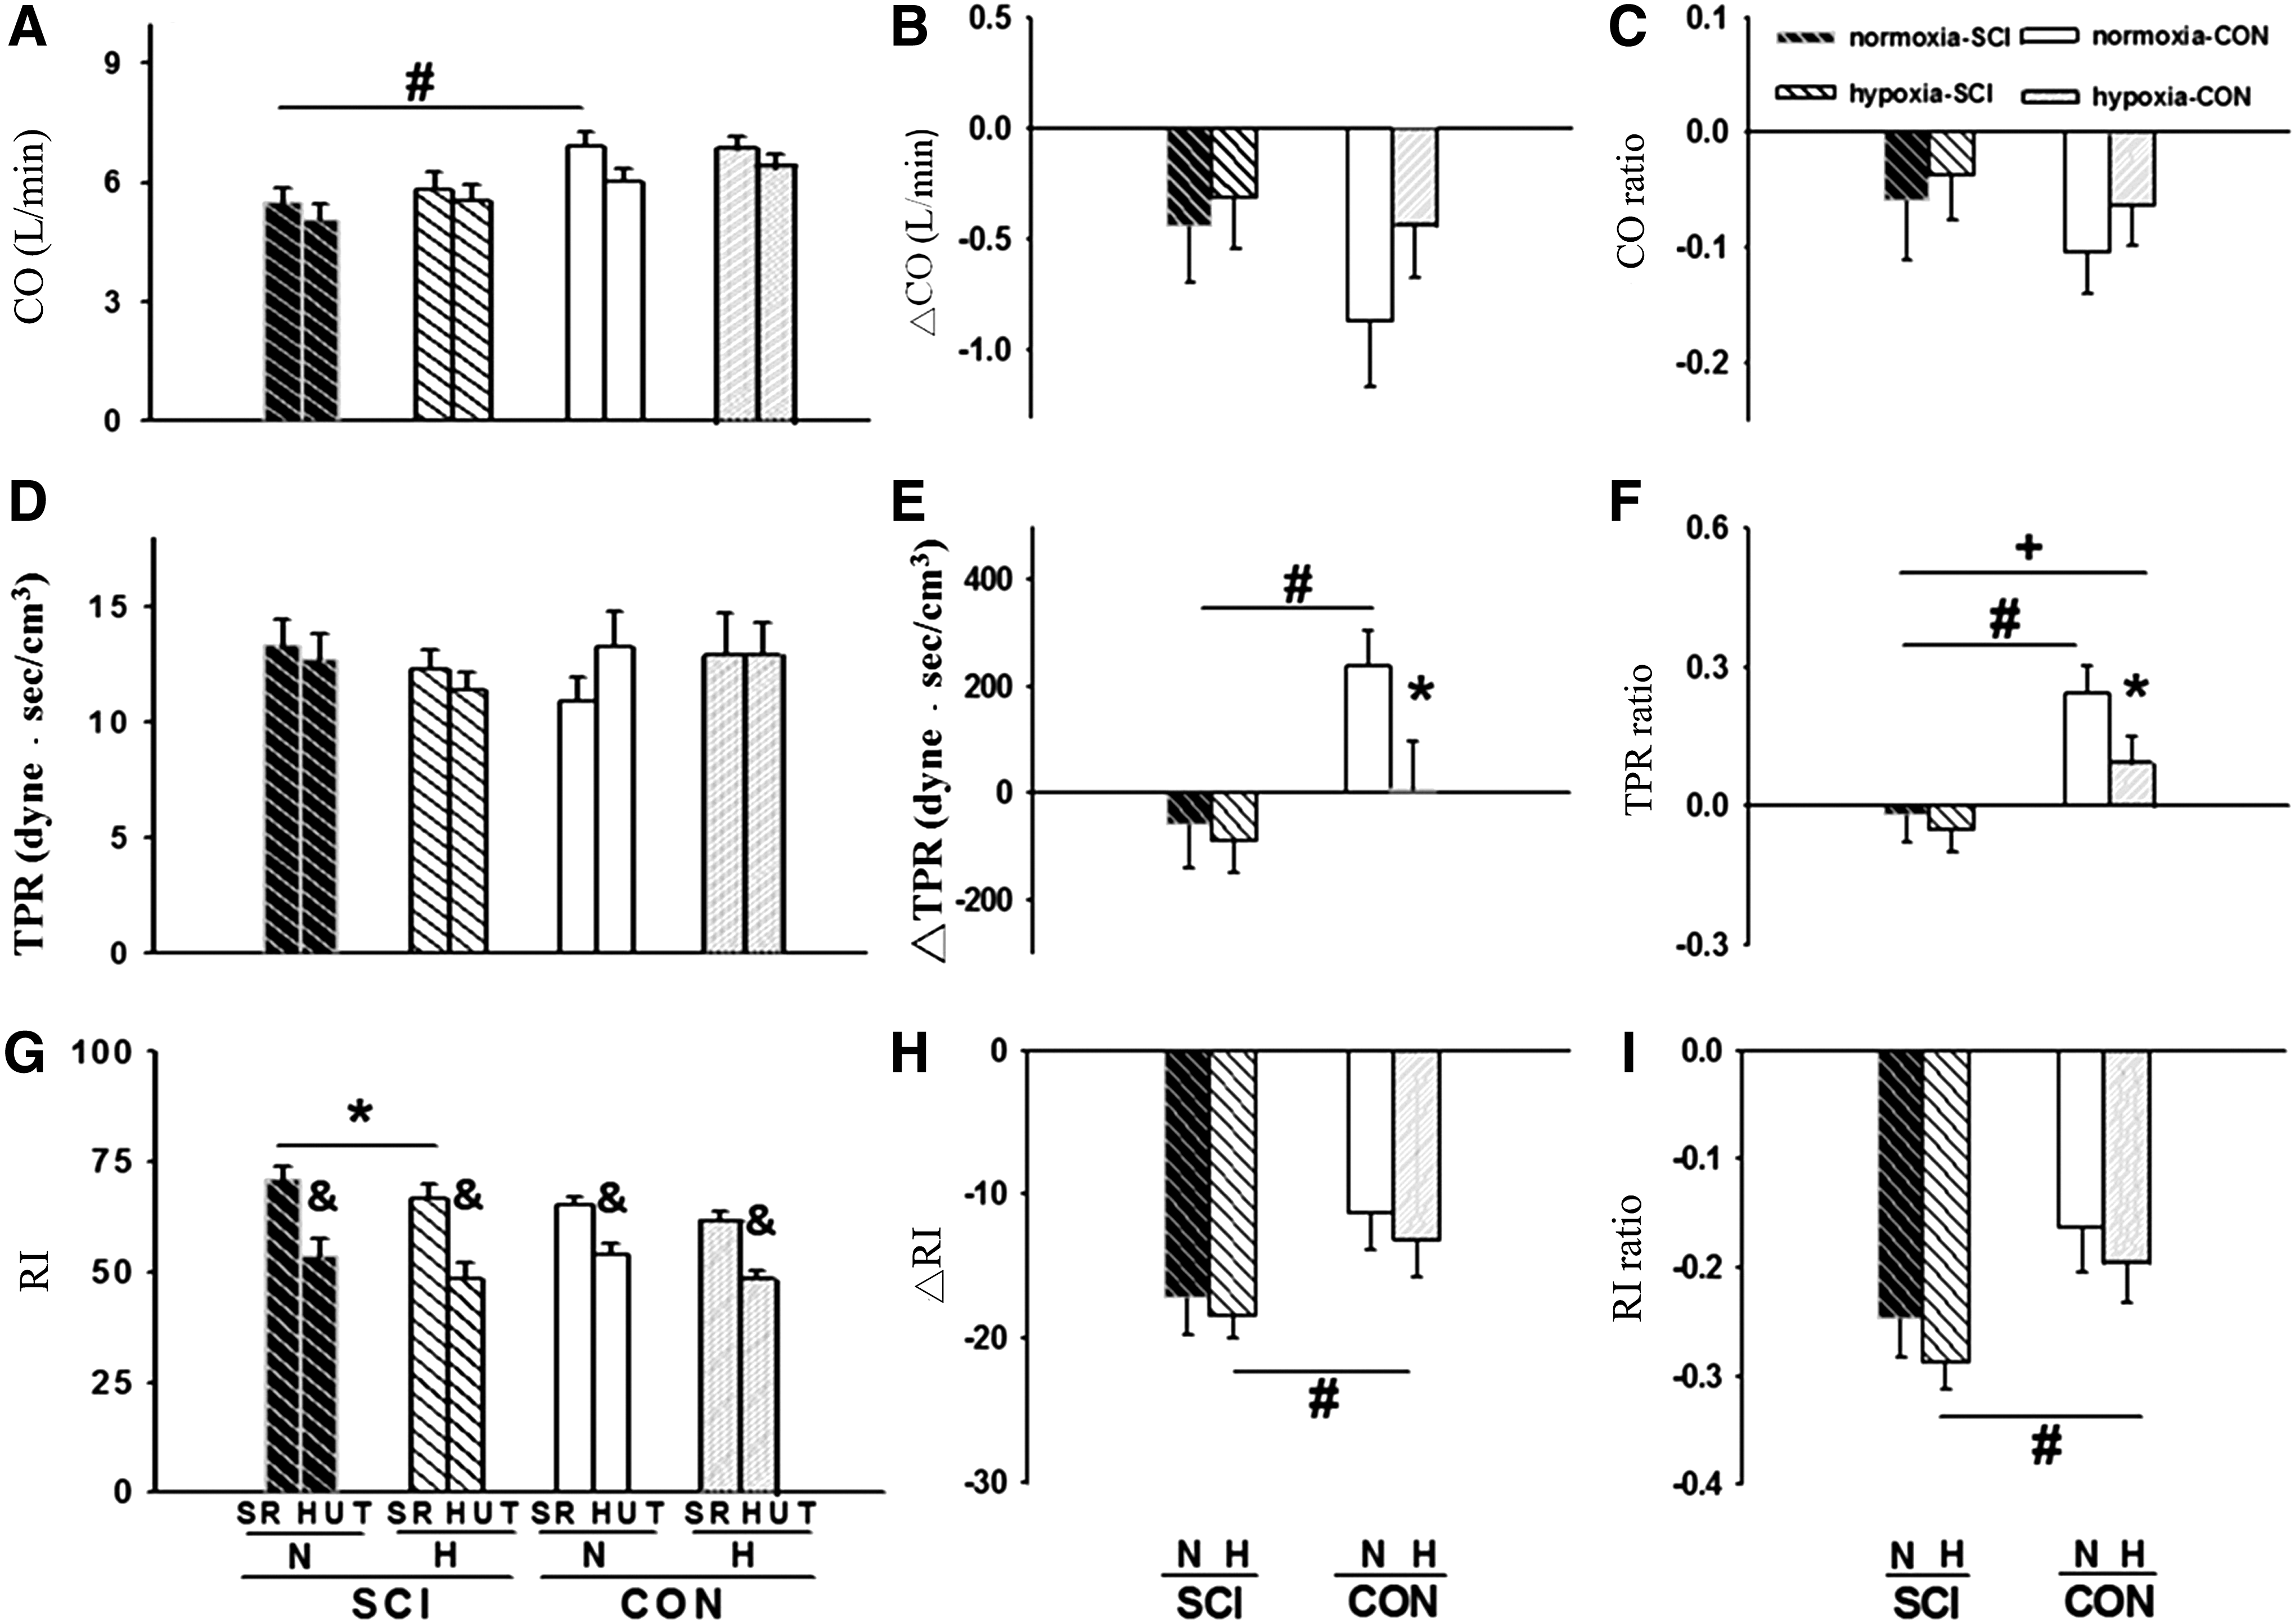
CO, TPR and RI of SCI patients and normal control at SR and HUT during normoxia and hypoxia are demonstrated in
Mean ± standard error of the mean.
SR versus HUT, paired-t test.
Normoxia versus hypoxia, paired-t test, SR, CD, and CR analyzed; p < 0.05.
SCI versus control, independent t-test, only normoxia during SR analyzed; p < 0.05.
CD, change difference; CR, change ratio; HF, high frequency; HFP, high-frequency power; HUT, head-up tilt; LF, low frequency; nHF, normalized high-frequency power; nLF, normalized low-frequency power; SR, supine rest.
During hypoxia in SR, HR increased and RI decreased in the SCI group (Figs. 3D and 4G). Otherwise, SBP, DBP, SV, CO, and TPR demonstrated no significant difference with those in normoxia (Figs. 2A, 2D, 3A, 4A, and 4D). Regarding cardiac autonomic activity, LF/HF and nLF increased, and HFP and nHF decreased in hypoxia compared with those in normoxia during SR in both groups (Table 2).
In combined hypoxia and HUT stimulation, orthostatic hypotension (▵SBP) did not show a significant difference in the SCI group (Fig. 2B, C). The degree of SV decrease or cardioacceleration from SR to HUT also exhibited no significant difference between normoxia and hypoxia in the SCI group (Fig. 3B, C, E, F). In the control group, SBP declined from SR to HUT in hypoxia instead of increasing in normoxia (Fig. 2A–C). During HUT in normoxia, TPR increased in the control group, but decreased in the SCI group. The degree of TPR decrease from SR to HUT revealed no significant difference between normoxia and hypoxia in the SCI group. On the contrary, the extent of TPR increase in the healthy subjects was attenuated during hypoxia compared with that during normoxia (Fig. 4E, F) (Supplementary Table S1; Supplementary Data are available online at www.liebertpub.com/ham). Regarding cardiac autonomic activity from SR to HUT, no significant difference in change difference (CD) or change ratio was found between normoxia and hypoxia in both groups by two-way repeated measure ANOVA (Table 2). The effect size and power (α error probability set 0.05) of hemodynamic variables in normoxia against hypoxia in the SCI group were as follows: ▵SBP: 0.03, 0.05; SBP-ratio: 0.01, 0.05; ▵DBP: 0.09, 0.07; DBP ratio: 0.07, 0.06; ▵SV: 0.26, 0.19; SV-ratio: 0.11, 0.08; ▵HR: 0.18, 0.12; HR-ratio: 0.22, 0.14; ▵CO: 0.12, 0.08; CO-ratio: 0.11, 0.08; ▵TPR: 0.10; 0.07; TPR ratio: 0.13, 0.09; ▵RI: 0.27, 0.22; RI ratio: 0.38, 0.29.
Discussion
In brief, no alteration was found in both cardiac or peripheral vascular level in response to posture change after 1-hour steady-state 13.5% F
Few studies investigated how hypoxia influences the autonomic cardiovascular system in patients with chronic high-level SCI. Pokorski et al. (1990a, 1990b) found that cervical SCI does not alter cardiac and ventilatory response to hypoxia. Sankari et al. (2015) also found that HR responses to hypoxia are acutely present in patients with cervical SCI and showed no difference compared to thoracic SCI or able-bodied control. The present study has similar findings. During SR, the cardioacceleration and sympathetic activation reaction to 13.5% F
Regarding the combined stimulation of hypoxia and posture change (SR to HUT) in patients with chronic high-level SCI, to the best of our knowledge, no study has been published in Medline. In our study, the CD or ratio of SV, HR, and CO showed no significant difference between normoxia and 13.5% F
In brief, in the SCI group, concerning the effect of hypoxia alone, HRSR increased, and it was accompanied by a shift in the autonomic balance toward the sympathetic side. The present study expanded on the previous studies by adding another physical stimulus HUT. Again, there was no major difference in the cardiovascular regulation between normoxic and hypoxic conditions, including the extent of orthostatic hypotension. The findings demonstrated a high degree of compensatory adaption in cardiovascular function, which well fits into the preserved respiratory adaption to the loading of quadriplegics with chemical stimuli shown in the previous studies (Pokorski et al., 1990a, 1990b; Sankari et al., 2015).
This study has limitations. First, although 13.5% hypoxia is in simulation of 3500-m altitude, we should be cautious to claim that this altitude does not cause any problems in the SCI population on the basis of the results of the present study. After all, other than hypoxia, cold temperature, hypobaria, ascending velocity, and duration of stay in high altitude all relate to the development of acute mountain sickness (Imray et al., 2010). Second, in our previous study, 12% F
Conclusion
Patients with chronic SCI whose neurological levels are higher than T6 generally revealed no obvious hemodynamic change under 1-hour steady-state 13.5% F
Footnotes
Acknowledgments
The authors thank the Chang Gung Medical Research Program (CMRPG3G0601) and Ministry of Science and Technology, ROC (NMRPG3G6231) for the financial support.
Disclosure Statement
The authors declare that there are no conflicts of interest.
References
Supplementary Material
Please find the following supplemental material available below.
For Open Access articles published under a Creative Commons License, all supplemental material carries the same license as the article it is associated with.
For non-Open Access articles published, all supplemental material carries a non-exclusive license, and permission requests for re-use of supplemental material or any part of supplemental material shall be sent directly to the copyright owner as specified in the copyright notice associated with the article.