




Abstract
Abstract
High altitude-induced gastrointestinal (GI) problems are potentially life-threatening. GI tract bleeding and inflammation are the major problems induced by hypobaric hypoxia (HH). In this study, effects of acute exposure to HH up to 14 days at 7620 m on GI immune function have been studied. To fulfill these objectives, Sprague-Dawley (SD) rats were divided into five groups namely Control and HH exposed (1, 3, 7, and 14 days). All groups except control were exposed to 7620 m of HH in an animal decompression chamber for the respective time intervals. Different degrees of intestinal mucosal damage in terms of increased mucosal permeability and disruption of intestinal villi were observed for different time intervals. HH exposure also upregulated secretory immunoglobulin A (sIgA) and proinflammatory cytokines in GI lavage along with proinflammatory markers such as toll-like receptor 4 (TLR4) and inducible nitric oxide synthase (iNOS). HH exposure of rats for 7 days significantly increased interleukin-17 (IL-17) and natural killer (NK) cell and dendritic cell populations compared with unexposed control rats. However, the number of naive T cells was significantly decreased in Peyer's patches. Our results connect HH to GI immune axis and highlight Th17 cells and proinflammatory molecules as potential therapeutic targets to counteract HH-induced GI dysfunction.
Introduction
I
There are some reports suggesting that hypobaric hypoxia (HH) could lead to GI bleeding in people ascending to HA. The incidences of GI bleeding were reported during expeditions to Mt. Karakoram, Mt. Qomolungma (Everest), and also the Qinghai–Tibetan railroad and highway construction (Saito, 1989; Wu, 2001; Wu et al., 2007).
The intestine is a reservoir of different bacteria and endotoxins. Any breach in the intestinal mucosal barrier can lead to the escape of these bacteria and endotoxins into the portal or systemic circulations resulting in multiple organ dysfunction syndrome (Swank and Deitch, 1996). HH can severely induce intestinal mucosal barrier injury and promote bacteria and endotoxin translocation from the gut lumen to cause severe health problems (Zhou et al., 2011). Some studies suggest that HH-induced intestinal barrier injury may be due to downregulation of different tight junction proteins and upregulation of proinflammatory protein, that is, inducible nitric oxide synthase (iNOS) (Zhang et al., 2015b; Luo et al., 2017).
GI inflammation, which is another manifestation seen with HH exposure, has been reported in some human and animal studies (Luo et al., 2012; Vavricka et al., 2014). These studies suggest that HH exposure affects the gut immune axis in many ways (Khanna et al., 2017). HH has also been shown to alter gut microbiota (Kleessen et al., 2005; Adak et al., 2014a, 2014b; Li and Zhao, 2015) and hence it may be a cause of HA-induced alterations in gut immune cells and proinflammatory cytokines. Researchers showed that expeditions above an altitude of 5000 m cause significant problems in the digestive tract (Hamad and Travis, 2014).
The present study highlights the effects of HH on intestine and its barrier function in Sprague-Dawley (SD) rats at 7620 m in a time-dependent manner. It also describes the time-dependent changes in intestinal barrier function, secretory immunoglobulin A (sIgA), proinflammatory cytokines, inflammatory proteins, and different immune cells. Our results demonstrate HH exposure-related altered GI immune axis and highlight Th17 cells and proinflammatory molecules as potential therapeutic targets to counteract HH-induced GI problems.
Materials and Methods
Ultrapure molecular-grade chemicals were used in the whole study. All chemicals were purchased from Sigma-Aldrich (St. Louis, MO) or as otherwise stated. Antibodies were purchased from Abcam (Cambridge, MA) or as otherwise stated.
Ethics approval
Male SD rats were bred in an IEAC (Institutional Ethics Committee on Animal Experimentations)-approved animal facility of DIPAS (Defence Institute of Physiology and Allied Sciences), Delhi, India (Approval No. IAEC/DIPAS/2015-05). Animals were kept in 12-hour light/dark cycles under free conditions on a bedding of rice husk in polypropylene cages. Animals were fed with rodent pellet and water ad libitum at 25°C ± 1°C, 55% ± 10% humidity. All experiments conformed to the National Guidelines on the Care and Use of Laboratory Animals, India. Experiments were performed in strict compliance with the guidelines of “Committee for the Purpose of Control and Supervision of Experiments on Animals (CPCSEA),” Government of India.
Simulated hypobaric hypoxia exposure
Animals (male SD rats) weighing 220 ± 20 g were divided into the following five groups (Table 1: n = 10/group).
Grouping and Exposure of Animals
The HH group animals were exposed continuously to simulated HH in an animal decompression chamber at a pressure of 282 Torr (equivalent to 7620 m) for 1, 3, 7, and 14 days to determine the time interval at which maximal GI mucosal injury occurs. The immunological changes in GI system were studied at the day of maximum damage, that is, 7th day.
The animal decompression chamber was opened each day for 15-minute intervals for water, food, bedding, and cage replenishment. A continuous supply of fresh air was provided at a rate of 8 L/min to prevent accumulation of carbon dioxide. The rate of change in ambient pressure was maintained to 35 mmHg/min to avoid any tissue injury resulting from a sudden drop or increase in ambient pressure. Animals in the control group were kept in the same environment, but without hypoxia exposure. After completion of exposure, animals were euthanized by giving an overdose of sodium thiopental (90 mg/kg). Blood and small intestine samples were taken and processed for further experiments. The tissue samples were obtained while the animals were still hypoxic and processed for immunoblotting and immunohistochemistry (IHC).
Hematoxylin and eosin staining
Jejunum tissues were excised from animals of all groups just after sacrifice and stored in 4% formalin until further processing. Tissues were cut into 2 × 3 cm blocks and paraffin embedded; 5-μm-thick sections were cut and mounted on a microscopic slide. Deparaffinization was done using two changes of xylene for 10 minutes and then sections were washed with acetone. Rehydration was performed using ethanol for 5 minutes. After washing for 2 minutes under running water, hematoxylin solution was added for 8 minutes. After washing under running water for 1 minute, differentiation in 1% acid alcohol was done for 30 seconds. Sections were again washed in running water for 3 minutes and eosin was added. On washing sections in alcohol, acetone, and xylene, a mounting medium was added. Morphological changes in the villi were studied using digital images of the stained sections using a brightfield microscope at 10 × magnification (Olympus).
Immunohistochemistry
Sections were taken from each group for IHC. After deparaffinization and rehydration with xylene and different concentrations of ethanol, respectively, antigen retrieval was done by boiling sections in citrate buffer and after phosphate-buffered saline (PBS) washes, peroxidase blocking was done for 30 minutes. Blocking was done with serum for 90 minutes. After PBS washing, a primary antibody (anti-HIF-1α 1:100, ab463; Abcam) was incubated overnight at 4°C. On the next day, three PBS washes were done. A secondary antibody (rabbit anti-mouse horseradish peroxidase [HRP] 1:200, ab97046; Abcam) was added to the sections for 60 minutes. The color was developed using 3,3′-diaminobenzidine (DAB) and sections were counterstained with hematoxylin. Dehydration was done and sections were mounted with coverslips. Mounted sections were analyzed under a brightfield microscope and analysis was done using ImageJ software, version 1.4.3.67 (NIH).
Serum collection
Blood was collected from all groups on respective days in nonpyrogenic and endotoxin-free tubes. Blood samples were allowed to clot for 2 hours at room temperature before centrifugation at 1000 × g for 10 minutes. The supernatant (serum) was collected and stored at −20°C until measurements were performed.
GI lavage preparation
The small intestine was removed from animals of all groups. Two milliliters of PBS with protease inhibitor cocktail (P8340; Sigma) was injected into the lumen of the excised intestine and secretions were collected in a Petri dish. The solution was transferred to a microcentrifuge tube and centrifuged for 10 minutes at 650 × g at 4°C. One hundred millimolars of phenylmethylsulfonyl fluoride (PMSF; P7626; Sigma) was added to the supernatant and centrifuged for 20 minutes at 4
Enzyme-linked immunosorbent assay for IgA, TNF-α, and IL-1β
IgA, tumor necrosis factor alpha (TNF-α), and interleukin 1 beta (IL-1β) levels were estimated using commercially available kits (8850480; eBiosciences; 900-K73; PeproTech; and 900-K91; PeproTech) by the sandwich enzyme-linked immunosorbent assay (ELISA) method. GI lavage samples of control, 1d, 3d, 7d, and 14d groups were added to plates and the assay was done as per the manufacturer's instructions. Readings were taken using a microplate reader (BioTek Instruments, Winooski, VT), sample concentrations were estimated using curve expert 1.4, graphs were plotted using GraphPad Prism 5.01 software (San Diego, CA), and one-way analysis of variance (ANOVA) followed by Bonferroni post hoc test was applied for statistical significance.
Immunoblot analysis
Equal concentrations of proteins (40 μg) from all groups were separated by 10% SDS-PAGE (sodium dodecyl sulfate/polyacrylamide gel electrophoresis), and proteins were transferred to PVDF (polyvinylidene difluoride) membrane (Millipore). The membrane was probed with 3% bovine albumin serum (Merck, Mumbai, India) blocking buffer for 1 hour and then incubated with the primary antibody (anti-HIF-1α 1:100, ab463; anti-occludin 1:1000, ab167161; anti-TLR4 1:1000, ab30667; anti-iNOS 1:100, ab15323; anti-MyD88 1:1000ab131071; all from Abcam; anti-p38 MAP kinase 1:1000, M0800; Sigma; and anti-phospho p38 MAPK 1:1000, MA5-15218; Thermo Fisher) for 2 hours at room temperature. Membranes were washed with Tris-buffered saline with 0.1% Tween-20 (TBST) and the secondary antibody (goat anti-rabbit HRP 1:10,000, ab6721; rabbit anti-mouse HRP 1:10,000, ab97046; all from Abcam) was added for 1.5–2 hours at room temperature. Membranes were washed with TBST, incubated with chemiluminescent substrate (Merck-Millipore), and digital images were taken using UVP BioSpectrum instrument. Quantification was done using ImageJ software.
Peyer's patch isolation
Small intestines were excised from all animals. Hanks' balanced salt solution (HBSS) with 1M 4-(2-hydroxyethyl)-1-piperazineethanesulfonic acid (HEPES) was used to flush fecal matter and secretions from the small intestine. Peyer's patches were excised using sharp scissors and isolated as per the protocol explained by Lefrançois and Lycke (2001).
Surface staining and flow cytometric analysis
Peyer's patches were isolated from small intestine of control as well as 7-day-exposed HH group, cells were counted, and then labeled with fluorochrome-labeled antibodies as per the company's recommendation (PE mouse anti-rat CD161a, 555009; BD Biosciences; FITC mouse anti-rat CD3, 557354; BD Biosciences; PE mouse anti-rat CD45RA, 551402; BD Biosciences; FITC mouse anti-rat CD11b/c, 554861; BD Biosciences; FITC mouse anti-rat γδTCR, 11-5810-81; eBiosciences; FITC mouse anti-rat CD18, 554979; BD Biosciences; PE mouse anti-rat CD8a, 200607; BioLegend; PE mouse anti-rat CD80, 200205; BioLegend; PE mouse anti-rat CD86, 200308; BioLegend). Cells were incubated for 2 hours at room temperature and washed with PBS. Cells were pellet down, resuspended in 500 μL PBS, and 10,000 cells were acquired using BD FACS Calibur with CellQuest Pro software version 5.1 (BD).
Intracellular staining for flow cytometric analysis
Peyer's patches were collected as explained above. Cells were fixed with BD fixing buffer and then permeabilized with BD permeabilization buffer (554714; BD) for 15 minutes in the dark. Cells were washed with PBS and centrifuged at 2000 rpm for 5 minutes. An antibody (anti-rat IFN-γ, 507804; BioLegend) was added as per the company's recommendation and kept in dark for 2 hours and again washed in PBS. Cells were resuspended in 500 μL PBS and 10,000 cells were acquired using BD FACS Calibur with CellQuest Pro software.
Real-time polymerase chain reaction
Total RNA was isolated, using the Qiagen total RNA isolation kit (74104; Qiagen), from Peyer's patches of the small intestine of control and 7-day HH-exposed groups using the manufacturer's recommendations. Polymerase chain reaction (PCR) was performed using the one-step complementary DNA (cDNA) synthesis kit (KM4101; Kapa Biosystems) as per the manufacturer's protocol. Real-Time SYBR Green PCR mix was purchased from Bio-Rad, 1725271. Primers were designed as follows (Table 2).
Primer Sequences for Different Genes
Samples of all groups were run on a real-time analyzer (Bio-Rad CFX connect real-time system) and analysis was done using Bio-Rad CFX Manager software version 3.0 The data were normalized against 18S ribosomal RNA (18S) as a reference and calculations were done using the 2−ΔΔCT method.
ELISA for IL-17
IL-17 was measured using a commercially available kit (ER0035; FineTest) by the sandwich ELISA method. Peyer's patch supernatants (prepared by taking 50 mg Peyer's patches in 400 μL of PBS-PIC buffer and centrifuged at 10,000 × g for 15 minutes) for both control and 7-day group were added to precoated plates provided in the kit. ELISA was performed using the manufacturer's instructions and readings were taken using microplate reader (BioTek Instruments). IL-17 concentration was estimated using curve expert 1.4 and graphs were plotted using GraphPad Prism 5.01 software along with statistical analysis.
Statistical analysis
The data sets from independent experiments were analyzed with GraphPad Prism 5.01 software and represented as mean ± standard error of the mean (SEM). The statistical significance of each parameter in an experiment was analyzed by one-way ANOVA (*p < 0.05, **p < 0.01, ***p < 0.001) or t-test (as required) followed by Bonferroni post hoc test.
Results
Analysis of HIF-1α levels
Hypoxia exposure always upregulated the HIF-1 level, and therefore, it is pertinent to analyze this protein in HH-exposed and unexposed groups. IHC was performed to evaluate HIF-1α levels in jejunum tissues of different groups. It was found that HH exposure upregulated HIF-1 compared with unexposed control group (Fig. 1a), although it was not significant. Immunoblotting of HIF-1α of jejunum tissues (n = 6) also confirmed increased expression in the HH-exposed groups compared with controls (Fig. 1b). The mean ± SEM of densitometry of HIF-1α for control was 1.47 ± 0.60; HH-exposed 1d was 1.81 ± 0.46, 3d was 2.81 ± 0.70, 7d was 2.24 ± 0.58, and 14d was 1.52 ± 0.38. Maximum levels of HIF-1α were found on day 3 of HH exposure although not significantly (Fig. 1c).

HIF-1α levels in jejunum tissue of control and HH-exposed rats.
Damage in the intestinal mucosa lining on HH exposure by hematoxylin and eosin staining
Hematoxylin and eosin (H&E) staining showed control rats had normal intact villi with uniformly arranged epithelial and goblet cells. Rats with 1 day of HH exposure showed changes in the villous tips where epithelial and goblet cells disappeared from tips of villi. After 3 days of HH exposure, epithelial and goblet cells disappeared from whole villi. Seven days of HH exposure induced maximum damage in the villi showing necrosis, loss of function, and translocation of epithelial and goblet cells to the lumen. After 14 days of HH exposure, regeneration of villi was apparent, but villous cells did not appear as normal as in the control rats (Fig. 2). These data confirm that 7 days of HH exposure at 7620 m causes maximum intestinal mucosal barrier damage.

H&E staining of jejunum tissue of control and HH-exposed rats (1d, 3d, 7d, and 14d). Results show maximum damage at 7th day of exposure. Arrows highlight tip of villi, epithelial cells, and goblet cells in all groups. Square boxes represent lumen. H&E, hematoxylin and eosin.
Evaluation of serum zonulin for predicting gut permeability and analysis of sIgA and proinflammatory cytokine level in GI lavage on HH exposure
Zonulin is a marker for estimating gut permeability. Levels of zonulin protein were estimated in the serum of control and HH-exposed rats (n = 10). The level of zonulin protein for control rats was found to be 24.3 ± 3.57 ng/mL, while HH-exposed groups had 27.8 ± 2.02 ng/mL, 40.4 ± 6.97 ng/mL, 55.4 ± 8.11 ng/mL, and 39.7 ± 3.73 ng/mL in 1d, 3d, 7d, and 14d, respectively. Zonulin levels showed maximum intestinal mucosal barrier injury after 7 days of HH exposure (p < 0.01 when compared with unexposed control and 1 day of HH exposure groups). However, it was decreased by the 14th day of HH exposure, indicating rejuvenation of injured GI barrier. Therefore, it was confirmed that 7 days of exposure causes maximum mucosal barrier dysfunction (Fig. 3a).
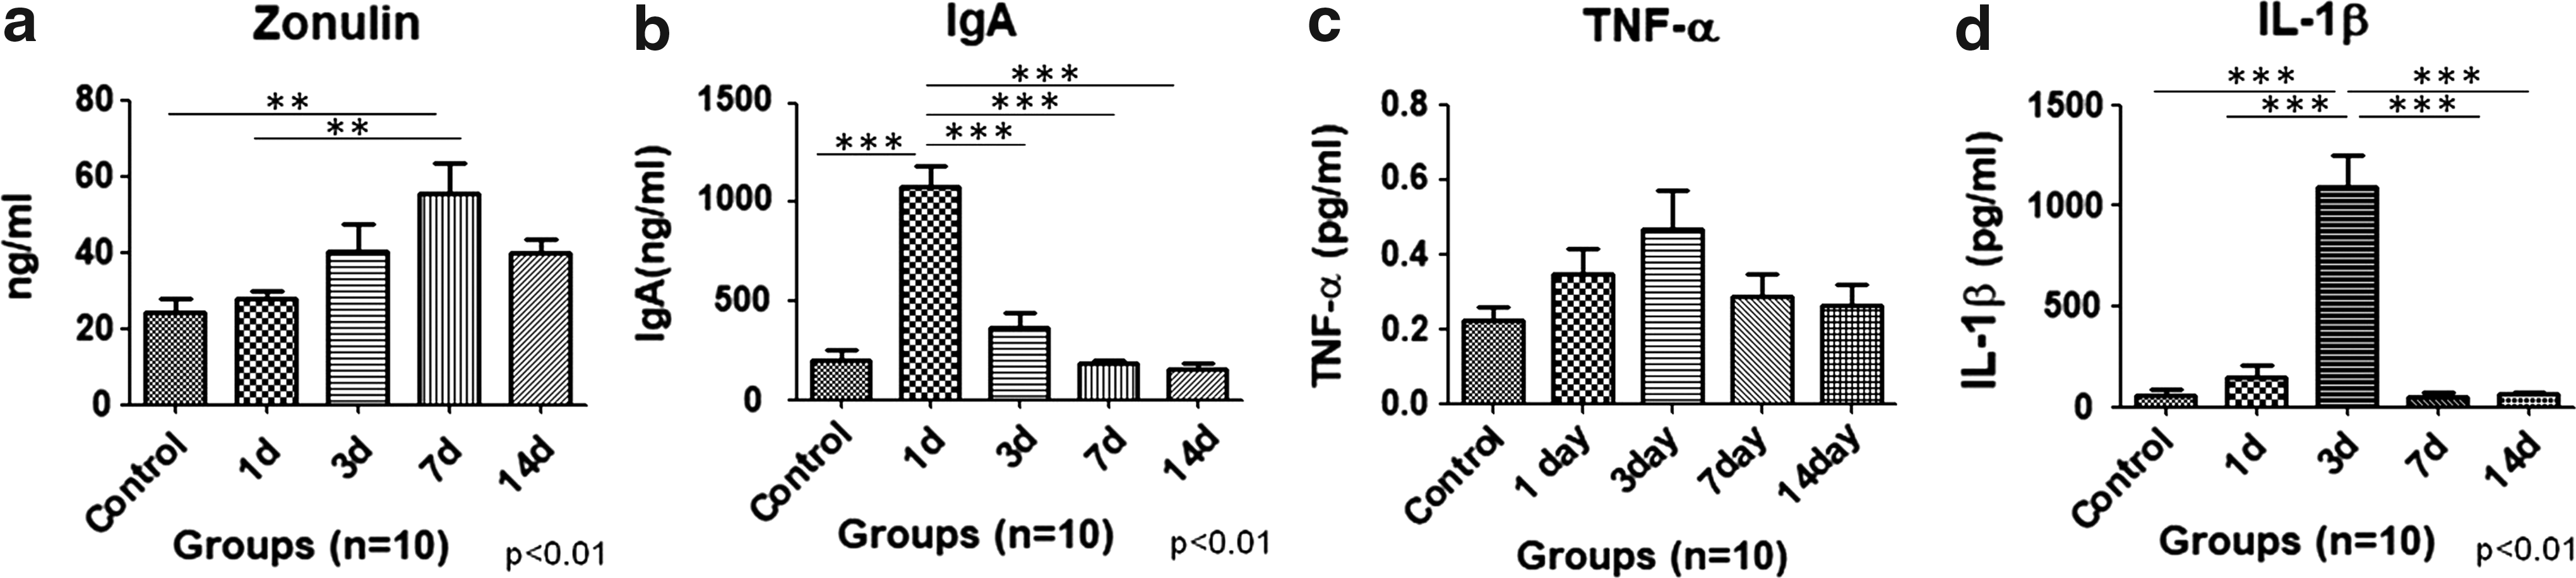
To analyze the effect of HH exposure on secretory IgA and proinflammatory cytokines, ELISA was performed in GI samples. IgA has an important role in mucosal immunity; therefore, the levels were assayed in GI lavage samples to correlate the role in GI immunity. The levels of sIgA in GI lavage of the control group were 204 ± 47.0 ng/mL; HH-exposed 1d was 1080 ± 103.7 ng/mL, 3d was 363.4 ± 76.9 ng/mL, 7d was 182.3 ± 19.8 ng/mL, and 14d was 156.9 ± 28.5 ng/mL. IgA was maximally increased with HH exposure of 1 day (p < 0.001) when compared with control, 3d, 7d, and 14d. The levels decreased with 3 days of exposure and returned to normal levels with further HH exposure (Fig. 3b) (n = 10). Levels of proinflammatory cytokine, that is, TNF-α, were also upregulated with HH exposure although not significantly, however, maximum levels were found after 3 days of exposure (Fig. 3c). The level of TNF-α in control rats was found to be 0.23 ± 0.03 pg/mL, while HH-exposed groups had 0.35 ± 0.07 pg/mL, 0.47 ± 0.10 pg/mL, 0.29 ± 0.06 pg/mL, and 0.26 ± 0.06 pg/mL at 1d, 3d, 7d, and 14d, respectively (n = 10). Levels of another proinflammatory cytokine, IL-1β, were maximum after 3 days of HH exposure (p < 0.001) when compared with unexposed controls, and at 1d, 7d, and 14d. Further exposure led to decreased IL-1β levels to that of control rats. Mean ± SEM for IL-1β in control was 57.9 ± 28.6 pg/mL; HH exposed had 149.0 ± 55.8 pg/mL, 1093 ± 154.9 pg/mL, 48.4 ± 25.8 pg/mL, and 61.6 ± 9.5 pg/mL at 1d, 3d, 7d, and 14d, respectively (Fig. 3d) (n = 10).
Immunoblotting for occludin, TLR4, iNOS, MyD88, p38, and phospho-p38 MAPK
Protein expression for different proteins in whole-cell lysate of jejunum tissue was observed. Occludin, which is an important tight junction protein, was found to be decreased with HH exposure and the maximal decrease was found after 7 days of hypoxic exposure compared with control although not significantly. The mean ± SEM of densitometry for occludin protein of control was 0.92 ± 0.27; HH-exposed 1d was 0.57 ± 0.13, 3d was 0.53 ± 0.14, 7d was 0.24 ± 0.21, and 14d was 0.31 ± 0.24. Toll-like receptor 4 (TLR4) levels were consistently increased with HH exposure with p < 0.05 when 14d compared with unexposed controls. The mean ± SEM of densitometry for TLR4 protein of control was 0.22 ± 0.07; HH exposed had 0.39 ± 0.05, 0.57 ± 0.09, 0.91 ± 0.22, and 1.33 ± 0.26 at 1d, 3d, 7d, and 14d, respectively. iNOS was observed to increase up to 3 days of exposure, and then, the levels decreased with further exposure although not significantly (Fig. 4a, b). Mean ± SEM of densitometry for iNOS protein of control was 0.28 ± 0.02, while HH exposed had 0.37 ± 0.01, 0.37 ± 0.02, 0.27 ± 0.02, and 0.26 ± 0.020 at 1d, 3d, 7d, and 14d, respectively. Levels of myeloid differentiation marker 88 (MyD88) were not increased up to 7 days of exposure, but levels were upregulated after 14 days of exposure significantly (p < 0.01 when 14d compared with control and 7d; p < 0.05 when 14d compared with 1d and 3d). Mean ± SEM of densitometry of MyD88 protein in control was 1.71 ± 0.39, HH exposed had 2.03 ± 0.68, 2.17 ± 0.76, 1.73 ± 0.37, and 7.82 ± 2.03 at 1d, 3d, 7d, and 14d, respectively (Fig. 4c, d). Important proteins of the MAPK pathway, that is, p38 and phospho-p38, which play a role in inflammation, were also observed. The ratio of phospho-p38/p38 increased with HH exposure although not significantly (Fig. 4e, f). Mean ± SEM of densitometry of phospho-p38/p38 protein in control was 0.66 ± 0.17; HH-exposed rats had 0.86 ± 0.25, 0.88 ± 0.35, 1.48 ± 0.49, and 2.03 ± 0.52 at 1d, 3d, 7d, and 14d, respectively.
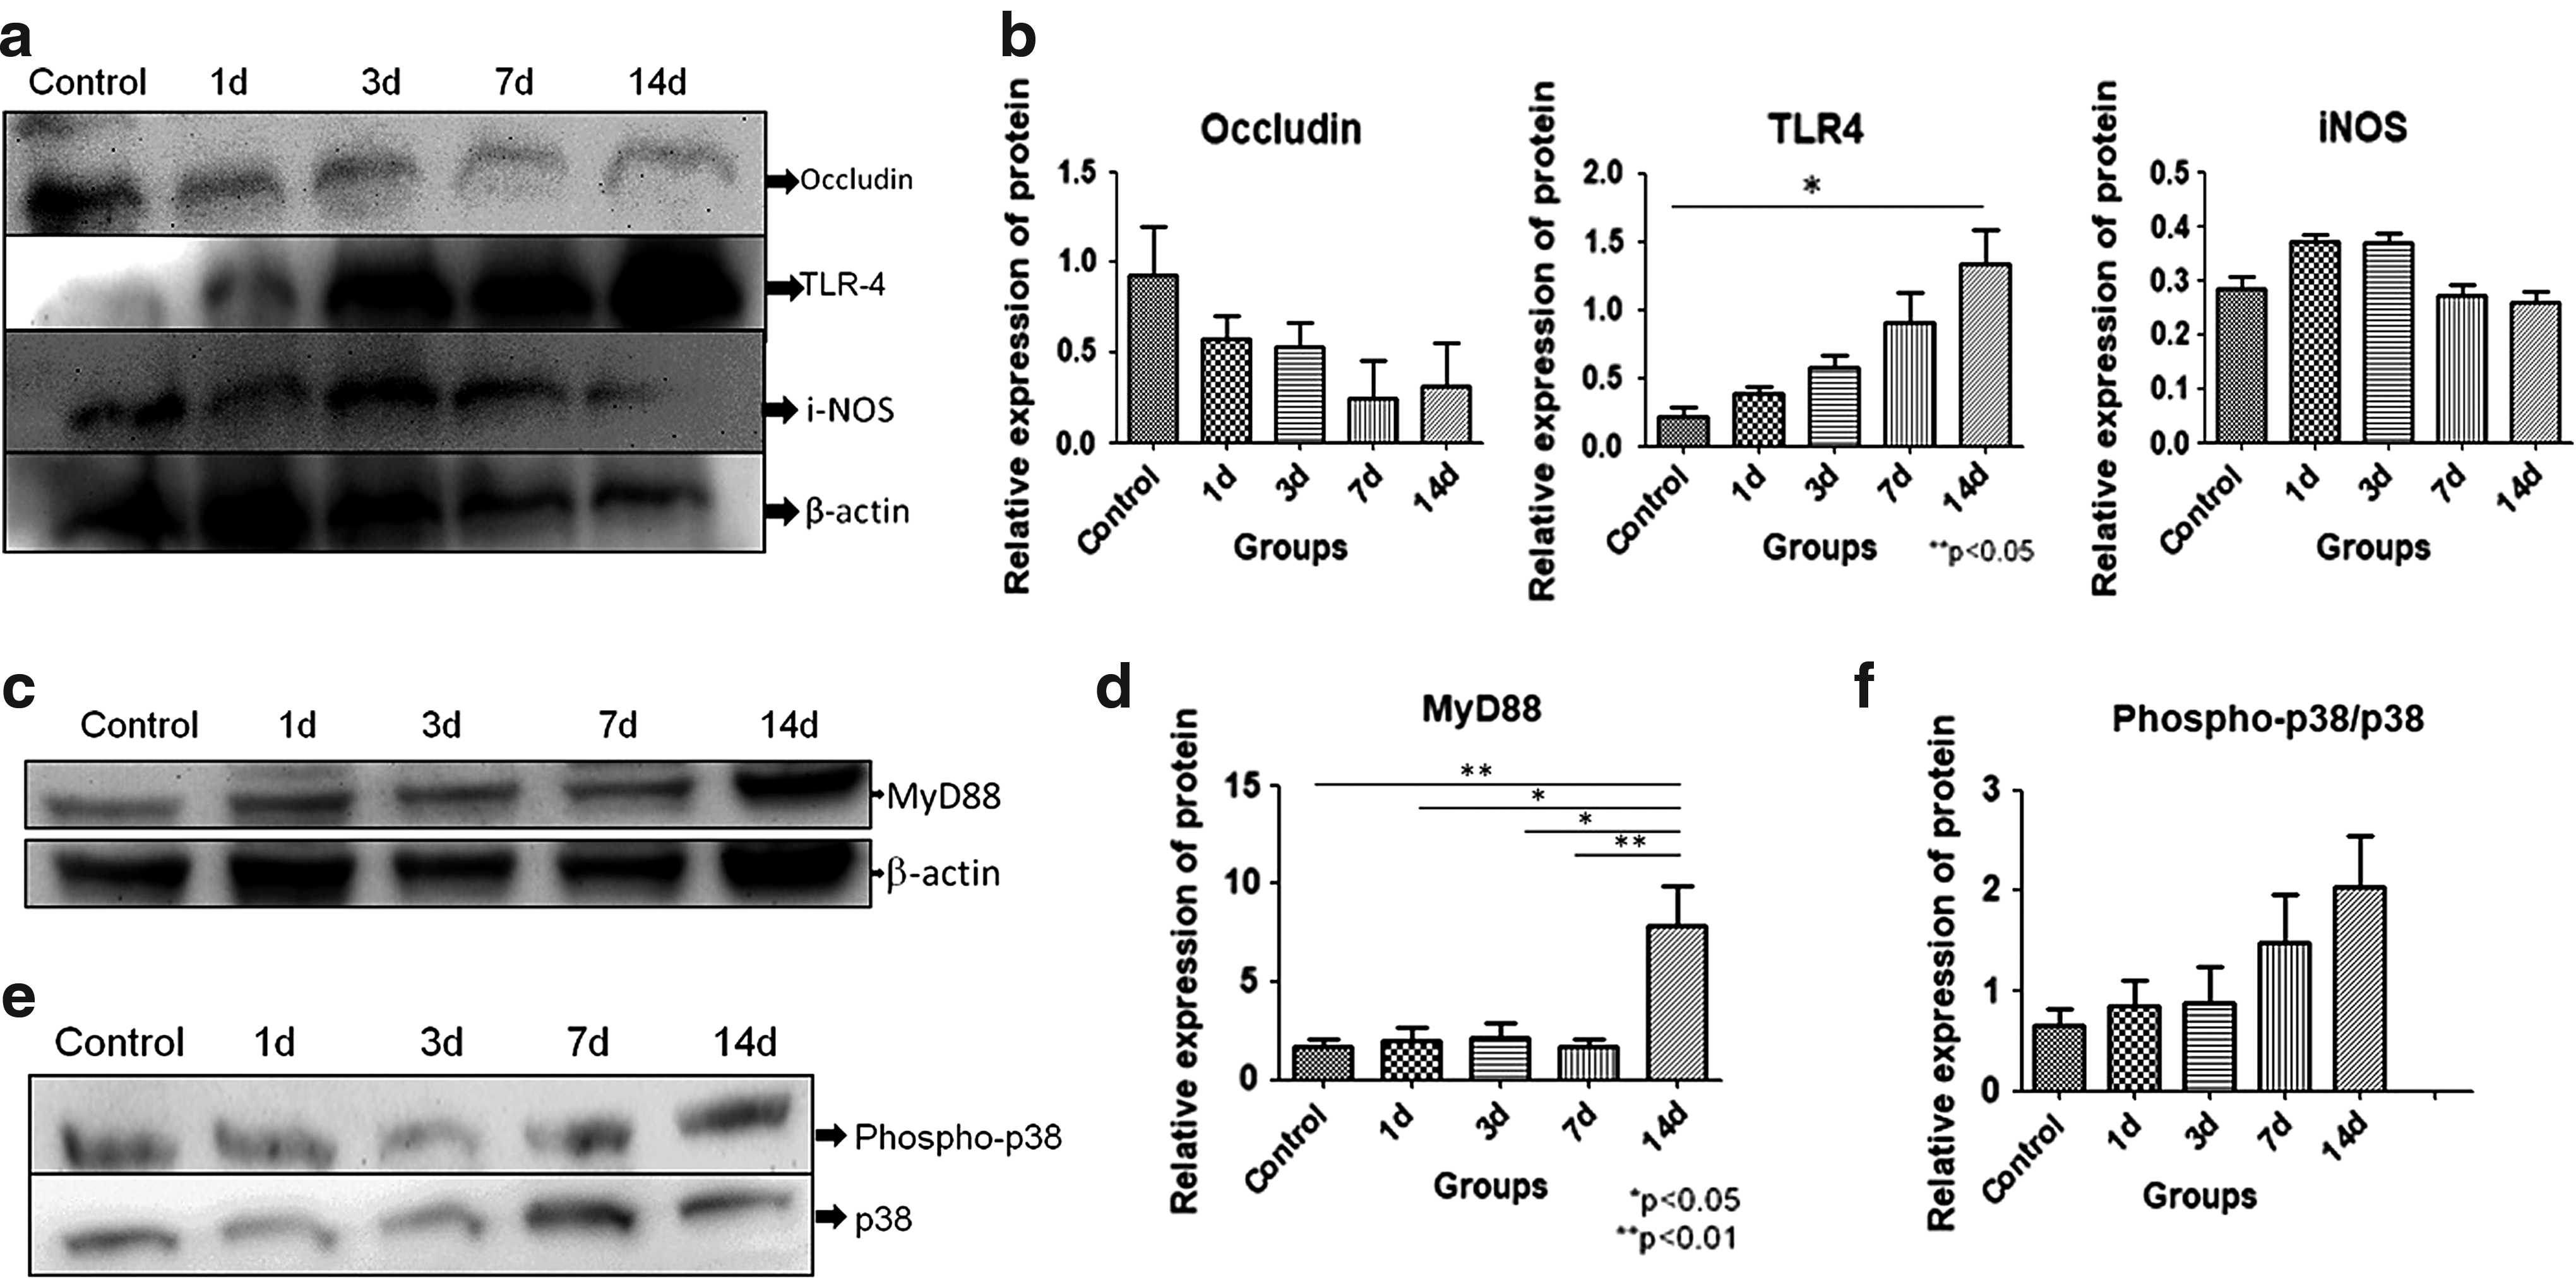
Immunoblotting of occludin, TLR4, iNOS, MyD88, phospho-p38, and p38 protein expression in jejunum of different groups.
Immune cell phenotyping in control and HH-exposed rats
The results showed that natural killer (NK) cells significantly increased (p < 0.05) with HH exposure of 7 days. Mean ± SEM for NK cell populations in control was found to be 26.8% ± 3.2% and for HH-exposed 7d was 38.9% ± 3.9% (Fig. 5a). Naive T cells were decreased significantly (p < 0.01), which showed that T cells have been activated on HH exposure. Mean ± SEM for naive T cell populations in control and HH-exposed 7d was found to be 68.2% ± 5.8% and 43.8% ± 4.92%, respectively (Fig. 5b). Also, dendritic cells (Fig. 5c), which are antigen-presenting cells, increased significantly with HH exposure (p < 0.05). Mean ± SEM for dendritic cells in control was found to be 17.4% ± 3.4% and for HH-exposed 7d was 25.8% ± 0.96%. Other cells such as gamma delta (γδ) T cells, which are abundant in gut mucosa, also increased although not significantly (Fig. 5d). Mean ± SEM for γδT cell populations in control and HH-exposed 7d was 8.64% ± 2.42% and 12.8% ± 4.12%, respectively. β2 integrins (cell adhesion molecules) decreased with HH exposure (Fig. 5e). Mean ± SEM for β2 integrins in control was found to be 23.1% ± 3.98% and for HH-exposed 7d was 17.9% ± 1.87%. Furthermore, cytotoxic T cells (CD8) also decreased with HH exposure (Fig. 5f) although not significantly. Mean ± SEM for CD8 cell population in control was found to be 26.15% ± 2.97% and for HH-exposed 7d was 20.41% ± 3.20%. Significant increases were not observed in costimulatory molecules such as CD80 and CD86 (Fig. 5g, h). Mean ± SEM for CD80 cells in control and for HH-exposed 7d was found to be 23.6% ± 5.2% and 29.2% ± 4.5%, respectively. Mean ± SEM for CD86 cells in control was found to be 34.8% ± 5.8% and for HH-exposed 7d was 39.9% ± 5.6%.
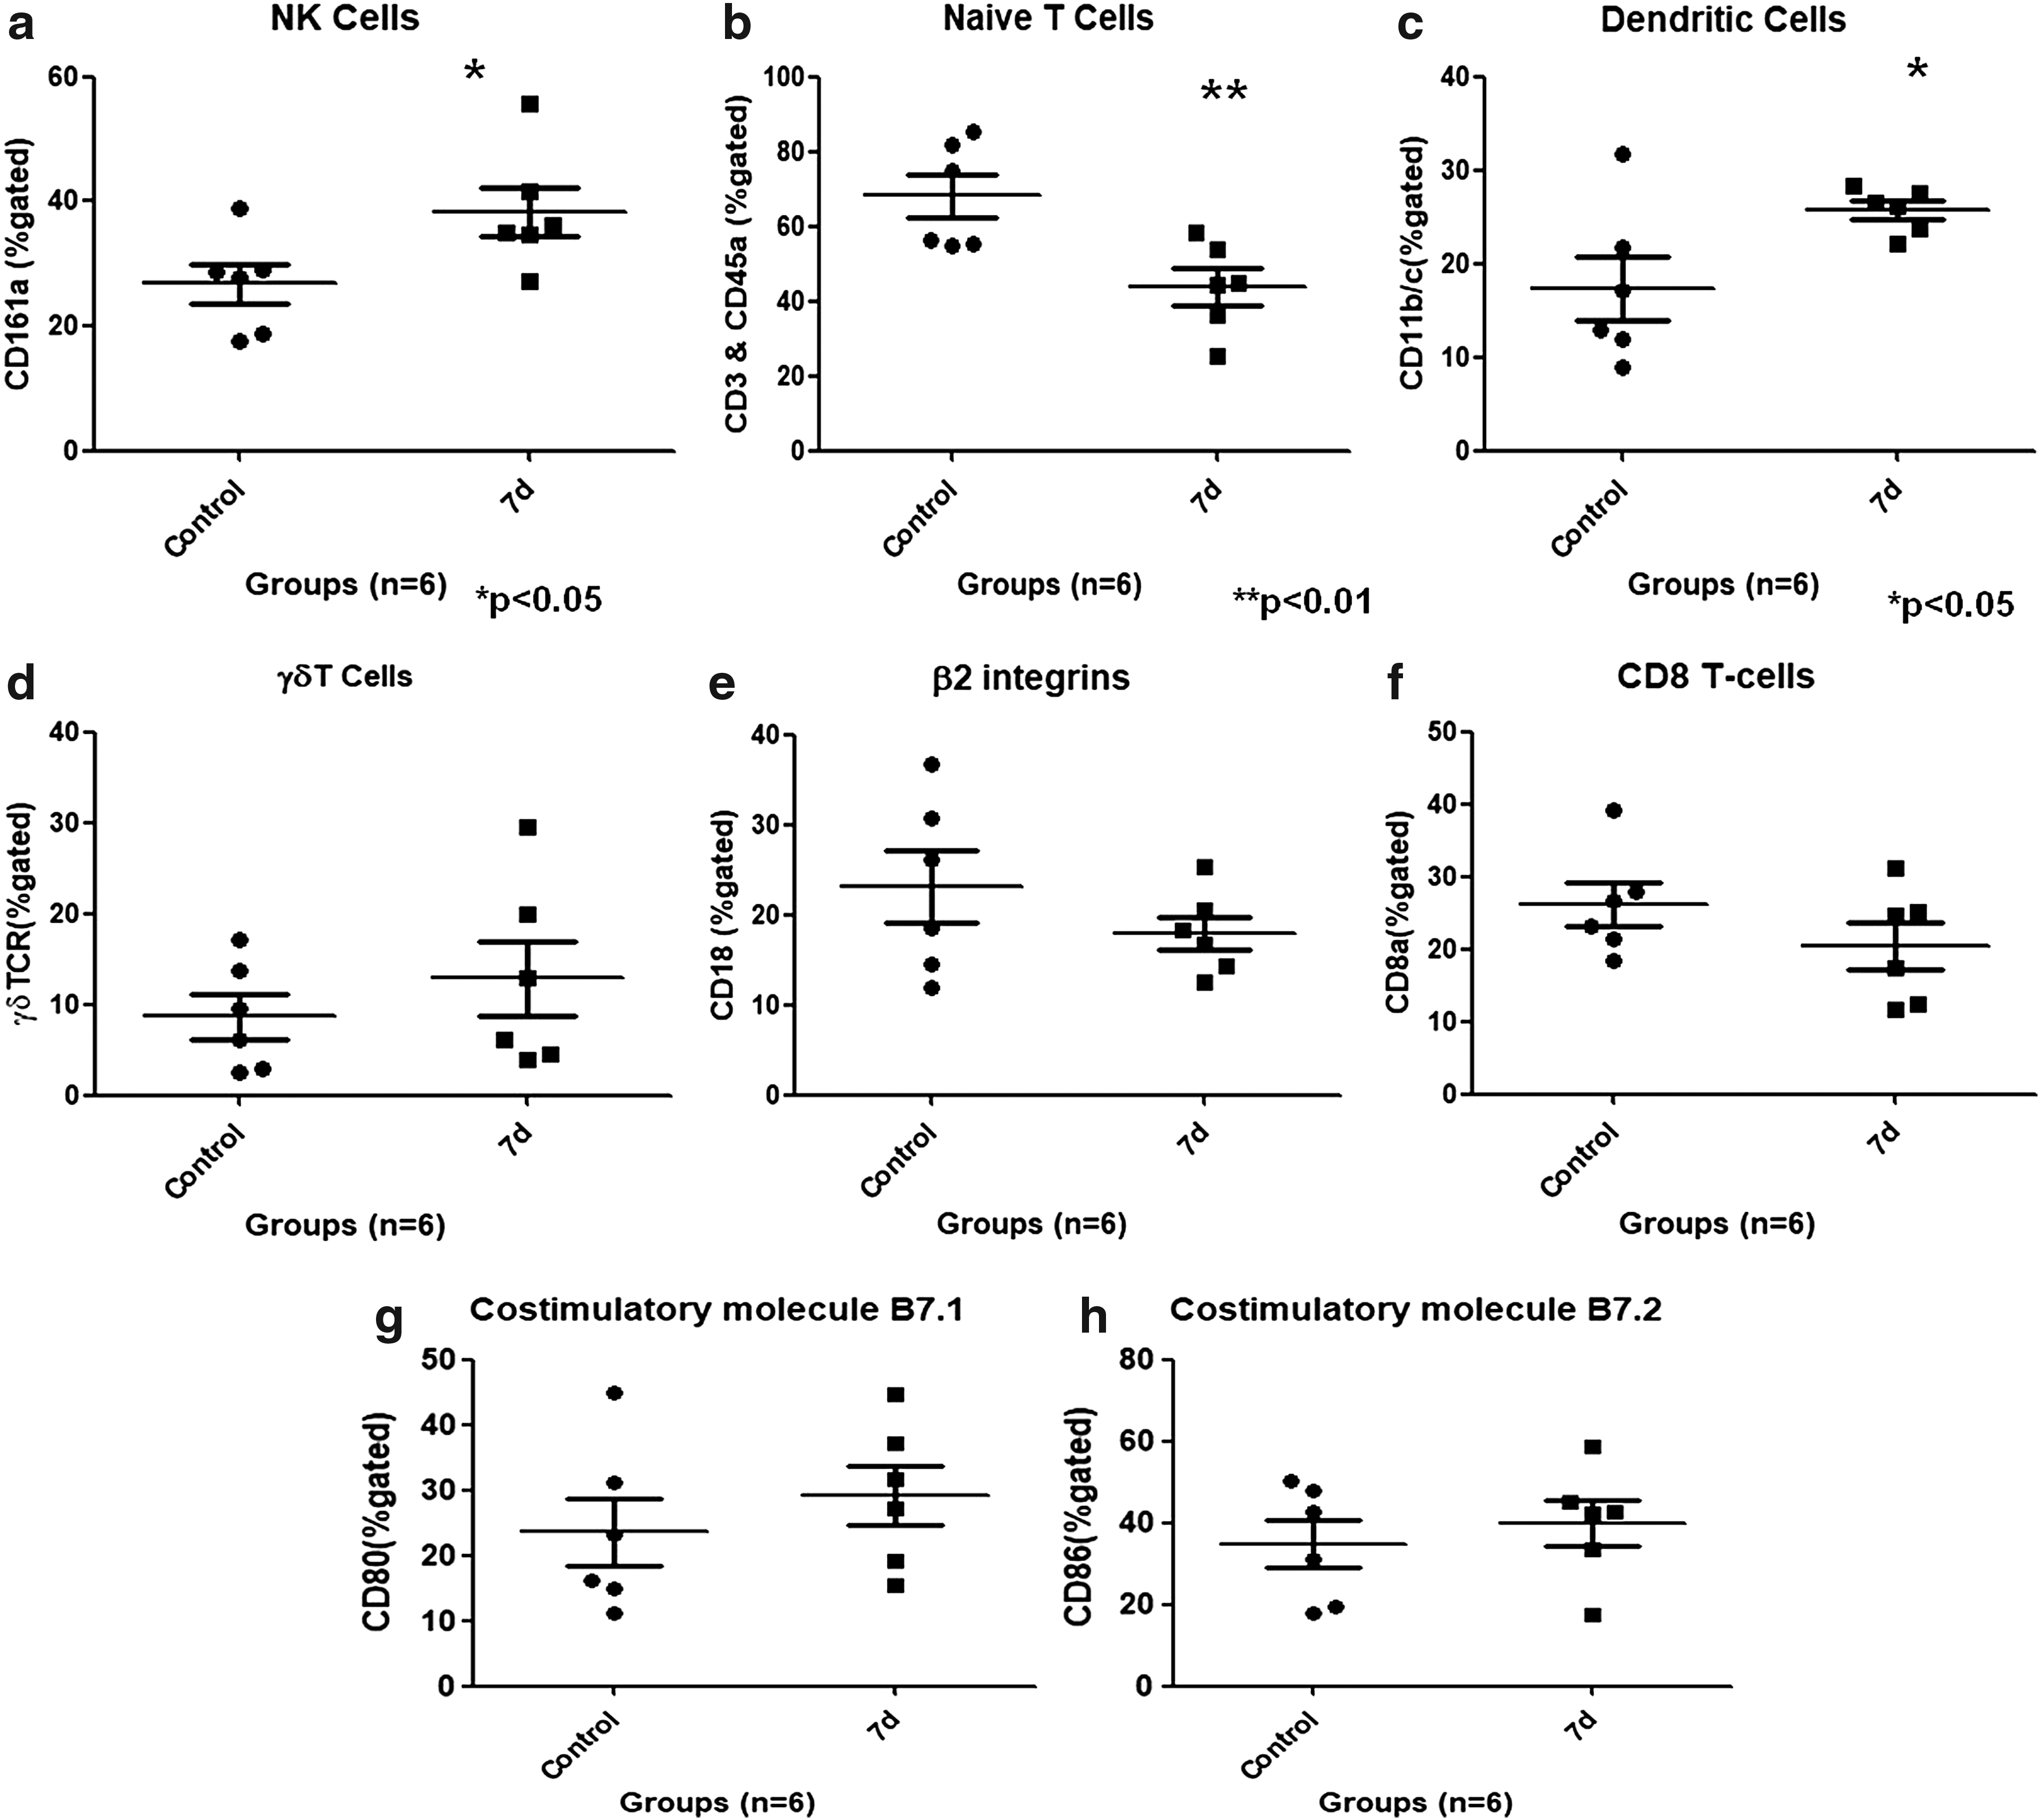
Immunophenotyping of Peyer's patch cells of control and 7-day HH-exposed rats.
Th1, Th2, Th17, and Treg immune response
We evaluated Th1 immune response by intracellular flow cytometric analysis of IFN-γ-producing T cells. The data showed marginal increases in CD3- and IFN-γ-positive populations in HH-exposed rats compared with control although not significantly (Fig. 6a). Mean ± SEM for dual-labeled CD3 and IFN-γ cell populations in control and HH-exposed 7d was found to be 9.2% ± 2.89% and 11.4% ± 4.8%, respectively. Furthermore, the level of Th2 immune response was analyzed by quantitative PCR (qPCR) of IL-4, which is a hallmark cytokine for the Th2 immune response. To calculate the relative fold gene expression, delta delta CT (ΔΔCT) values for all samples were calculated. The ΔΔCT value for IL-4 showed a 1.5-fold increase in HH-exposed samples compared with unexposed controls. Similarly, qPCR of IL-17 (Th17 marker) and FOXP3 (Treg marker) was also performed to establish Th17 or Treg immune response, ΔΔCT value for IL-17, and FOXP3 showed 20- and 2-fold increases in expression, respectively (Fig. 6b). To confirm upregulation of Th17 immune response, IL-17 levels were also estimated by performing ELISA using Peyer's patch supernatant. IL-17 levels were found to be significantly higher (p < 0.05) (Fig. 6c) in HH-exposed rats compared with unexposed controls. Mean ± SEM for IL-17 levels secreted by Th17 population in control was 544 ± 80.5 pg/mL and HH-exposed 7d was 785.8 ± 44.1 pg/mL, and thereby confirming that HH exposure was biased toward a Th17 immune response.
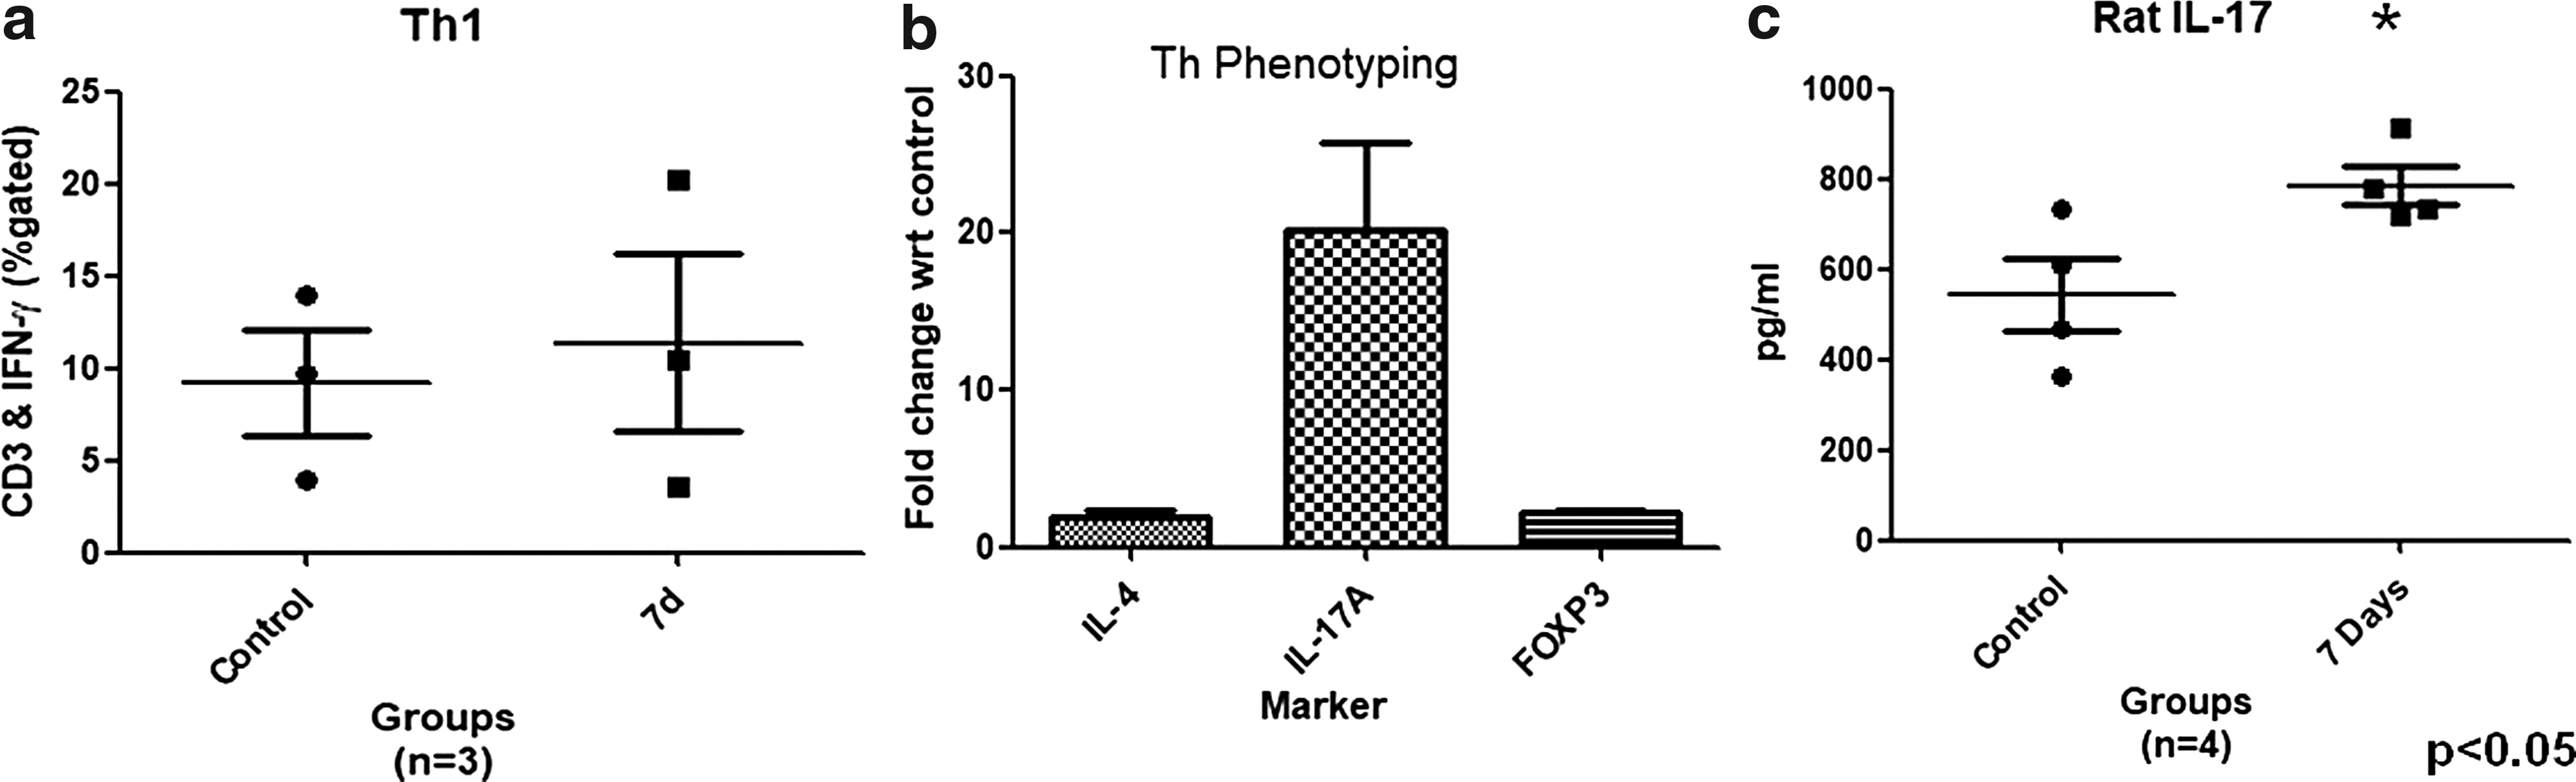
The phenotyping of Peyer's patches of control and 7-day HH-exposed rats.
Discussion
It is known that a hypoxic environment at HA has the potential to cause alterations in the intestinal mucosal barrier and its microbiota (Adak et al., 2013). However, immunological consequences in the GI tract and the time of onset of these changes at extreme altitudes are still undiscovered. Effects of exposure to extreme altitude (>5800 m) on the cardiovascular system and other organs have been reported in previous studies (Mieske et al., 2010; Zhang et al., 2015b). In this study, we show the first evidence of an effect of HH at an equivalent of 7620 m on GI immune axis in terms of increasing exposure time and extend the existing knowledge on immune response generation in Peyer's patches and GI lumen. We report that HH exposure causes intestinal inflammation by enhancing proinflammatory cytokines, leading to damage of the mucosal lining. The principal finding of the study showed HH exposure biased toward the Th17 immune response by upregulating IL-17 cytokines.
Hypoxia exposure increases HIF-1α levels to regulate hypoxia-induced gene expression and withstand the lack of oxygen. In our study, levels of HIF-1α in the jejunum were upregulated on the 3rd day of HH exposure (although it was not statistically significant). The results correlate with previous studies, where HIF-1α levels are increased with an elevation in altitude in the intestines as well as other organs (Engebretsen et al., 2007; Zhang et al., 2015b).
To determine the day at which maximum mucosal barrier damage occurs, H&E staining showed maximal damage of villi at 7 days of HH exposure. The result obtained is in agreement with previous human and animal studies where HH exposure caused exfoliated and irregular morphology of intestinal villi (Zhou et al., 2011; Zhang et al., 2015a; Li et al., 2016). Another important observation was the regeneration of intestinal villi after 14 days of HH exposure. A recent study has shown the role of intestinal stem cells in regenerating whole crypts containing all epithelial lineages (Preston et al., 2014). Therefore, the intestinal stem cells may play a role in regenerating new villi after 14 days of HH exposure at 7620 m.
Furthermore, the extent of intestinal mucosal barrier damage was estimated by checking the zonulin levels in serum. Zonulin is a protein that, by disassembling intercellular tight junctions, modulates the permeability of intestinal barrier (Ling et al., 2016). Higher levels of zonulin in serum indicate more intestinal barrier injury. Maximum levels of zonulin were found at the 7th day of HH exposure (p < 0.01) which also corresponds to results of H&E-stained jejunum tissues (Fig. 2). Previous studies also reported increased intestinal barrier injury due to HH exposure (Dong et al., 2005; Zhou et al., 2011; Luo et al., 2012).
Secretory IgA is the hallmark of mucosal immunity (Simecka, 1998). In our study, sIgA levels were significantly increased (p < 0.001) just after HH exposure of 1 day and decreased on subsequent exposure. IgA being a major immunoglobulin present in intestine expresses spontaneously as the first line of defense and hence is maximum on the 1st day of exposure (Van der Heijden et al., 1988). Increased IgA levels in plasma/serum after HA exposure have also been observed in previous human and animal studies (Meehan et al., 1988; Khanna et al., 2018). There is evidence of proinflammatory cytokines playing an essential role in mediating inflammation and damage in intestinal barrier function (Al-Sadi et al., 2009). Our study revealed that HH exposure upregulated IL-1β (p < 0.001) and TNF-α in GI lavage, which is in agreement with previous studies (Xu et al., 2014).
To know the mechanism behind HH exposure-induced changes in intestinal barrier and inflammation, immunoblotting of jejunum tissue was performed. TLRs are involved in GI barrier strengthening, the proliferation of epithelial cells, and the healing of injured epithelium (Abreu et al., 2005). TLR4 recognizes bacterial endotoxins and stimulates a proinflammatory signal through the MyD88 pathway (Fukata et al., 2005). In consistence with previous studies (Luo et al., 2012; Xu et al., 2014), TLR4 (p < 0.05) and MyD88 (p < 0.01) expression increased maximally with 14 days of HH exposure compared with control.
On the basis of the extent of intestinal mucosal barrier injury, immunology behind the mucosal inflammation and barrier loss was seen on 7th day of HH exposure. In our study, the population of NK cells was found to increase significantly with 7 days of HH exposure (p < 0.05). NK cells are the main component of an innate immune system and do not require prerequisite stimulation to function (Mandal and Viswanathan, 2015). The results correlated with previous studies on the effect of hypoxia on NK cells (Klokker et al., 1993; Facco et al., 2005). In a previous study, it was suggested that the effect of hypoxia on NK cells can be mimicked by epinephrine infusion, while β-adrenergic blockade abolished the increase in NK cell number (Pedersen and Steensberg, 2002).
Naive T cells are part of the adaptive immune system, activating and differentiating to respective T cell subtypes (Pennock et al., 2013). The population of naive T cells was significantly decreased in 7-day HH-exposed group when compared with control (p < 0.01). This gives an indication of an increase in activated T cell population on HH exposure. Dendritic cells are efficient antigen-presenting cells known for T cell activation (Mellman, 2013; Batal et al., 2014). The significant increase (p < 0.05) in dendritic cell population in Peyer's patches showed activated immune response under HH exposure. A high-altitude environment is known to be associated with oxidative stress (Dosek et al., 2007) and an increase in dendritic cells followed by HH exposure validated with the study on oxidative stress, leading to upregulation of dendritic cells (Batal et al., 2014). The immune response generated after 7 days of HH exposure may be due to damage-associated molecular patterns that activate under cellular stress and promote inflammation (Land, 2015).
qPCR and flow cytometric analysis data revealed the type of Th immune response involved under HH exposure. Levels of IL-17 (Th17) were found to be upregulated by 20-fold in HH-exposed rats compared with unexposed controls. Also, IL-17 levels were significantly increased (p < 0.05) in the supernatant of Peyer's patches, confirming increased Th17 immune response following HH exposure. Similar results were observed in a human study where plasma samples were analyzed for IL-17 levels and increased with HA exposure (Boos et al., 2016). Furthermore, upregulation of Th17 immune response on 7 days of HH exposure could result in the development of subsequent autoimmune diseases (Zambrano-Zaragoza et al., 2014).
In conclusion, our findings demonstrate that HH induces immunological and pathological changes in rats in a time-dependent manner. Our findings emphasize maximal alteration in gut barrier function after 7 days of HH exposure. Levels of sIgA and proinflammatory cytokines upregulated in the early days of HH exposure. The GI immune system was found to activate after 7 days of HH exposure with a significant increase in NK cells and dendritic cells and significant downregulation of naive T cells. Activation of TLR4/MyD88/iNOS proteins in the intestine and Th17 immune response generation may have resulted in damage to GI mucosal lining. Together, these findings emphasize the inference that targeting the Th17 cells could be an important therapeutic strategy for preventing mucosal barrier injury and GI syndrome at high altitude.
Footnotes
Acknowledgments
The authors thank the Defence Research and Development Organization (DRDO), Ministry of Defence, Government of India, for financial support in the form of project DIP-265. K.K. thanks DRDO for providing fellowship in the form of junior and senior research. Special thanks to Dr. Divya Singh (Sc ”E,” DIPAS) for her support in the study and Dr. Sudheer Kumar Arava (Associate Professor, Department of Pathology, AIIMS) for observing the histology slides.
Author Disclosure Statement
The authors declare no competing financial interests.