




Abstract
Abstract
Objective:
To determine whether 2 days of staging at 2500–3500 m, combined with either high or low physical activity, reduces acute mountain sickness (AMS) during subsequent ascent to 4300 m.
Methods:
Three independent groups of unacclimatized men and women were staged for 2 days at either 2500 m (n = 18), 3000 m (n = 16), or 3500 m (n = 15) before ascending and living for 2 days at 4300 m and compared with a control group that directly ascended to 4300 m (n = 12). All individuals departed to the staging altitudes or 4300 m after spending one night at 2000 m during which they breathed supplemental oxygen to simulate sea level conditions. Half in each group participated in ∼3 hours of daily physical activity while half were sedentary. Women accounted for ∼25% of each group. AMS incidence was assessed using the Environmental Symptoms Questionnaire. AMS was classified as mild (≥0.7 and <1.5), moderate (≥1.5 and <2.6), and severe (≥2.6).
Results:
While staging, the incidence of AMS was lower (p < 0.001) in the 2500 m (0%), 3000 m (13%), and 3500 m (40%) staged groups than the direct ascent control group (83%). After ascent to 4300 m, the incidence of AMS was lower in the 3000 m (43%) and 3500 m (40%) groups than the 2500 m group (67%) and direct ascent control (83%). Neither activity level nor sex influenced the incidence of AMS during further ascent to 4300 m.
Conclusions:
Two days of staging at either 3000 or 3500 m, with or without physical activity, reduced AMS during subsequent ascent to 4300 m but staging at 3000 m may be recommended because of less incidence of AMS.
Introduction
A
An effective countermeasure against AMS is altitude acclimatization (Roach et al., 2002; West, 2004). Gradual ascent (Luo et al., 2013; Purkayastha et al., 1995; Schneider et al., 2002) and “staging” or living for 4 or more days at moderate altitudes (1500–3500 m) has been used to induce altitude acclimatization and reduce AMS by 25%–50% during subsequent exposure to a higher elevation (Beidleman et al., 2009; Evans et al., 1976; Hansen et al., 1967; Stamper et al., 1980). An ideal staging altitude is one that is high enough to initiate beneficial physiologic responses but not so high as to cause AMS (Roach et al., 2002). In addition, the ideal staging duration must be long enough to induce functional benefits but short enough to complete timely expeditions, military missions, and athletic competitions (Rodway and Muza, 2011; Windsor et al., 2009). Thus, in many situations, 4 days of staging is not practical. The effectiveness of using a shorter staging duration (e.g., 2 days) for alleviating AMS upon further ascent to an easily accessible altitude (e.g., 4300 m) has not been systematically evaluated.
In addition, the influence of vigorous physical activity while staging on AMS during subsequent ascent is not well understood. Physical activity while staging may enhance acclimatization because of an exercise-induced lowering of arterial oxygen saturation as measured by pulse oximetry (SpO2) that may provide a greater “hypoxic” stimulus (Banchero et al., 1966; Beidleman et al., 1999). Alternatively, vigorous exercise may induce greater symptoms of AMS at the staging altitudes because of disruption of fluid balance that then carries over to the higher elevation (Hoyt and Honig, 1996; Loeppky et al., 2005; Singh et al., 1990). The objective of this study was to determine whether 2 days of staging, with and without vigorous physical activity, at altitudes of 2500, 3000, and 3500 m would reduce AMS during subsequent exposure to 4300 m compared with a control group that rapidly ascended to 4300 m.
Methods
The study was approved by the Institutional Review Board at the U.S. Army Research Institute of Environmental Medicine (USARIEM) and conformed to the Declaration of Helsinki. All volunteers provided written and verbal acknowledgement of their informed consent and were made aware of their right to withdraw without prejudice at any time. None were born at altitudes >1500 m and all had been living at altitudes <1000 m for >3 months before the start of the study. Investigators adhered to the policies for protection of human subjects as prescribed in Department of Defense Instruction 3216.02 and the research was conducted in adherence with 32 Code of Federal Regulations Part 219.
Volunteers
Sixty-one unacclimatized men and women sea level (SL) residents were randomly assigned into one of four groups that either resided for 2 days at 2500 m (560 mmHg), 3000 m (526 mmHg), or 3500 m (494 mmHg) before living for an additional 2 days at 4300 m (460 mmHg), or to a control group that directly ascended to 4300 m and lived there for 2 days. All volunteers were healthy, well nourished, nonsmokers, and physically active. Physical characteristics were determined at SL (756 mmHg) and are given in Table 1 for the entire cohort and by altitude staging group. The number of men and women were equally distributed in each altitude staging group and the number assigned to either light or vigorous physical activity were also equally distributed within each altitude staging group. Four individuals dropped out after SL testing and it was impossible to replace them because of the complexity of the study. This led to different numbers in each group.
Demographic Characteristics of the Four Groups of Unacclimatized Lowlanders Randomly Assigned to Either One of Three Staged Groups or the Direct Ascent Control Group
Values are given as mean ± standard error.
VO2peak, peak oxygen uptake.
Study design
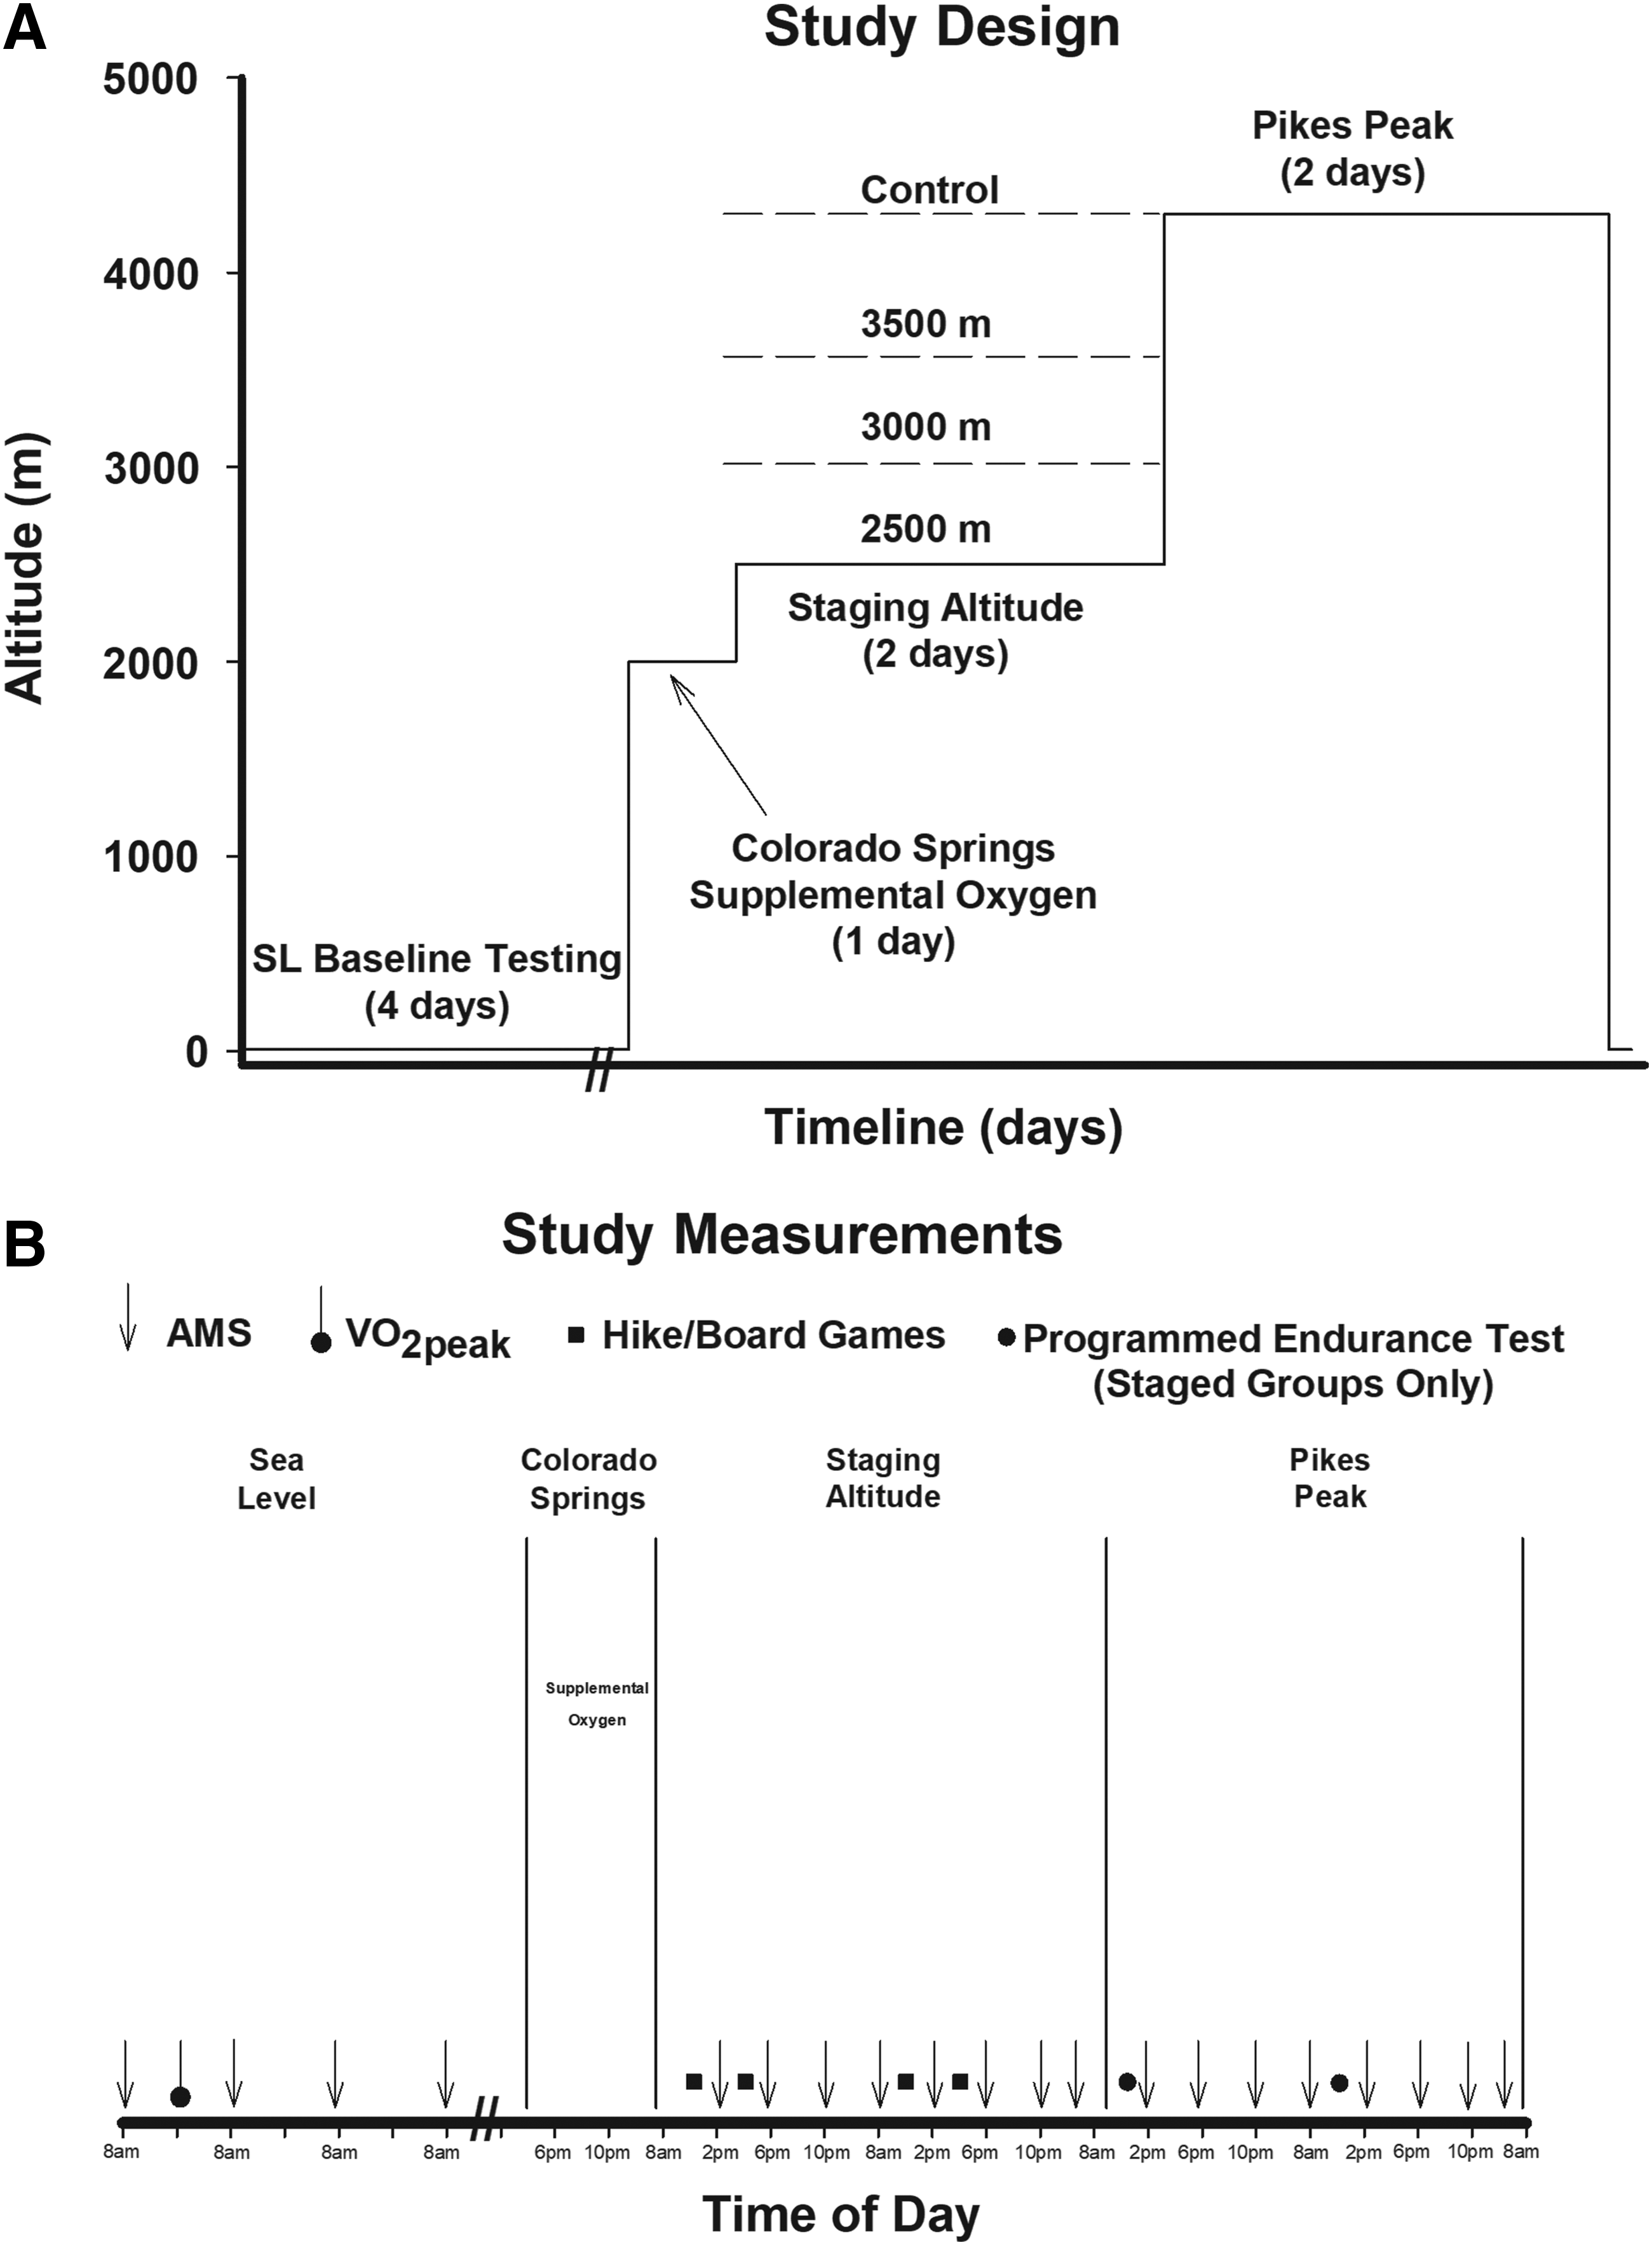
After 4 days of baseline SL testing (50 m, 756 Torr), volunteers were flown from USARIEM to Colorado Springs, Colorado (2000 m), where they spent the remainder of the day and night breathing supplemental oxygen (O2). The O2 saturation was continuously monitored and mean values were maintained at SL values in the 2500 m (98 ± 2), 3000 m (97 ± 3), 3500 m (98 ± 2), and control groups (97 ± 2) from their time of arrival at 2000 m until their time of departure the next morning. The next morning, volunteers were removed from supplemental O2 and driven to their respective altitude-staging sites located within the Pikes National Forest where they stayed for 2 days. This study design, which encompassed one night of supplemental O2 at 2000 m to simulate SL conditions, facilitated equal staging time in all four groups. On the morning of the third day, each of the three staging groups was driven within 2 to 3 hours to the target altitude (4300 m, 460 Torr; Pikes Peak Laboratory) and arrived between 08:00 and 10:00 AM where they resided for an additional 2 days. The control group that directly ascended to 4300 m also arrived at Pikes Peak between 08:00 and 10:00 AM and resided there for an additional 2 days. The three staged groups completed ∼1.5 h programmed endurance tests at ∼40%–55% of SL peak oxygen uptake (VO2peak) (Fig. 1) ∼2 hours (day 1) and ∼24 hours (day 2) after arriving at 4300 m. The direct ascent control group did not participate in the programmed endurance tests on the first 2 days at 4300 m owing to participation in either hikes or board games as part of the study design.
Research procedures
Peak oxygen uptake
An incremental, progressive exercise bout to volitional exhaustion on a treadmill was used to assess VO2peak during the USARIEM SL baseline phase. Measurements of O2 uptake were obtained using a metabolic cart (True Max 2400; Parvo Medics, Sandy, UT).
Acute mountain sickness
The incidence and severity of AMS was determined from information gathered from the shortened version of the Environmental Symptoms Questionnaire (Beidleman et al., 2007; Sampson et al., 1994). At completion of each questionnaire, and with the volunteer still seated, pulse SpO2 (%) and heart rate (HR; beats per minute) were also determined (Model 9500; Nonin Medical, Plymouth, MN).
The incidence and severity of AMS, SpO2, and HR were assessed on four separate occasions at SL (for practice), and eight different, but highly specific times at both the staging site and while at 4300 m. Assessments were made for the three staging groups after 4, 8, 12, 22, 28, 32, 36, and 46 hours of residence and then again at the same time points during subsequent residence at 4300 m. These measurement points corresponded to 12 PM, 4 PM, and 8 PM on the first day, 8 AM, 12 PM, 4 PM, and 10 PM on the second day, and 8 AM on the third morning before departure from either location. The AMS assessment times for the direct ascent control group were directly comparable with the three staged groups. AMS was always assessed at least 1 hour after completion of any exercise.
If the AMS-C score was >0.7 for a volunteer at any one of the eight time points during staging or while at the target altitude, then AMS was considered present (Sampson et al., 1994). Mild, moderate, and severe AMS was present if AMS-C was ≥0.7 and <1.5, ≥1.5 and <2.6, and ≥2.6, respectively, at any measurement point (Beidleman et al., 2013). A peak AMS-C severity score was also recorded across the eight measurement points both while staging and at 4300 m.
Programmed endurance tests
After subsequent ascent to 4300 m, during mid-morning on the first day and early afternoon on the second day, all staged volunteers in both the low- and high-activity groups participated in programmed endurance tests. The direct ascent control group did not participate in these programmed endurance tests on the first 2 days at 4300 m because of participation in either hikes or board games as part of the study design. However, the mean energy expended (kcal/day) on the first and second day at Pikes Peak was the same for all groups which allowed comparison of AMS measurements. Each endurance test required the volunteers to walk for 20 minutes at a preset pace requiring 40%–45% of SL VO2peak and then to complete 5 miles as quickly as possible (volunteer controlled speed) on a motor-driven treadmill. The 5-mile exercise bout averaged ∼55% of SL VO2peak. AMS assessments were deliberately delayed for at least 1 hour after programmed endurance tests.
Activity
Volunteers wore a small ankle-sized activity monitor (Actical; Philips Respironics, Murrysville, PA) that has been shown to provide reliable and valid measurements of energy expenditure compared with indirect calorimetry (Hager et al., 2015; Heil, 2006). The activity monitor was removed for daily showers and used to calculate total daily energy expenditure (kcal/day) for each day of the study. Volunteers were randomly assigned to participate in either low or vigorous activity while residing at the staging altitudes. Those in the low-activity group engaged in a total of 3 hours of a combination of board/card games twice daily (i.e., morning and afternoon), whereas those in the vigorous activity group participated in a trail hike twice daily. All hikes were 1 to 2 hours long with a mean length of 1.4 ± 0.7 hours and were completed between morning and afternoon AMS measurements (Fig. 1). The hikes were conducted using a global positioning system (Garmin, Olathe, KS) to help maintain a pace over various grades that were estimated to elicit a minimum of 5–6 metabolic equivalents.
Diet
During the entire study, all volunteers were allowed to eat ad libitum. While residing at their SL residence, volunteers ate their typical meals at home. During the staging and 4300 m altitude phases, the volunteers ate Meal Ready to Eat rations supplemented with common foods such as vegetables, fruits, milk, and juices. Considerable efforts were made to sustain caloric balance and hydration by providing similar food (macronutrient composition) and water during data collection before and throughout their altitude exposures. Urine specific gravity was <1.002 each morning for all volunteers.
Statistical analysis
The AMS-C scores were log-transformed to conform to normality assumptions. Although men and women were equally distributed in each group, the low percentage of women (25%) in each group precluded statistical analyses of sex as an independent factor. A 4 × 2 × 8 three-way repeated-measures mixed analysis of variance was used with group (4 factors) and activity level (2 levels) as independent factors and time (8 levels) as the repeated-measures factor for all parametric measures (e.g., HR, SpO2, and log-transformed AMS-C scores). PROC NPAR1WAY (SAS 9.3, Cary, NC) was utilized to analyze the incidence of mild, moderate, and severe AMS and evaluated with the Kruskal–Wallis test statistic. PROC GLIMMIX (SAS 9.3) was utilized to analyze the prevalence of AMS between groups over time at altitude using a spatial power structure for correlation between repeated measurements. Statistical power calculations indicated that a sample of 12 subjects per group would provide >80% chance of detecting a difference in the severity of AMS-C at 4300 m based on previous publications reporting group means and standard deviations of (0.2 ± 0.1), (0.4 ± 0.2), (0.6 ± 0.4), and (1.2 ± 0.6) at 2500 m, 3000, 3500, and 4300 m, respectively (Beidleman et al., 2009; Beidleman et al., 2013). Pearson correlation and point-biserial correlation coefficients were calculated for relationships between parametric and nonparametric variables, respectively. Significant main effect and interactions were analyzed using a Newman–Keuls post hoc test for parametric data and estimate statements with the Bonferroni correction were utilized to perform post hoc analysis on all nonparametric data. Significance was set at p < 0.05. Data are presented as mean ± standard error.
Results
There were no differences between groups in any of their physical characteristics (Table 1). The composition of the groups in terms of activity levels (light vs. vigorous) and sex (men vs. women) was also not different. The effect of sex on outcome variables was not evaluated because of a lack of power but women were equally represented (∼25%) in each group. The mean kilocalories burned per day differed (p < 0.05) between the light and vigorous physical activity groups while staging at 2500 m (3231 ± 197 vs. 4210 ± 220), 3000 m (3166 ± 236 vs. 3938 ± 208), and 3500 m (2401 ± 236 vs. 3506 ± 220). The direct ascent control group demonstrated no differences in kilocalories burned per day between the light and vigorous activity groups (2863 ± 255 vs. 3014 ± 255) because of symptoms of AMS limiting physical activity. After ascent to 4300 m, the staged groups participated in the same activities, so the light and vigorous activity groups were combined. The mean energy expended (kcal/day) on the first and second day at Pikes Peak was the same for the 2500 m (3369 ± 153), 3000 m (3351 ± 162), 3500 m (3166 ± 166), and direct ascent control groups (2938 ± 262). Activity level did not affect any of the outcome variables, so data for both activity levels were combined for all additional data analyses.
Table 2 provides the outcome variables collected during the first 2 days of staging in all groups. The mean resting SpO2 during staging across the eight measurement points in the 2500, 3000, and 3500 m and direct ascent control groups were all significantly different from each other. The mean resting HR during staging across the eight measurements points in the 2500, 3000, and 3500 m groups were all similar but lower than that in the direct ascent control group. While staging, the groups also differed in both the total incidence (AMS-C ≥ 0.7) and peak severity of AMS. As expected, the 2500 m group had the lowest incidence and peak severity of AMS, the 3000 and 3500 m groups were next, and the 4300 m direct ascent control group had the highest incidence and peak severity of AMS.
Mean Arterial Pulse Oxygen Saturation, Heart Rate, Incidence of Acute Mountain Sickness (AMS) (AMS-C ≥ 0.7) and Peak AMS Severity During the First 2 Days While Staging and the First 2 Days on Pikes Peak in All Groups
The direct ascent control group has the same staging and Pikes Peak values. Values are given as mean ± standard error.
p < 0.05 from 2500 m.
p < 0.05 from 3000 m.
p < 0.05 from 3500 m.
AMS, acute mountain sickness; bpm, beats per minute; HR, heart rate; SpO2, arterial oxygen saturation.
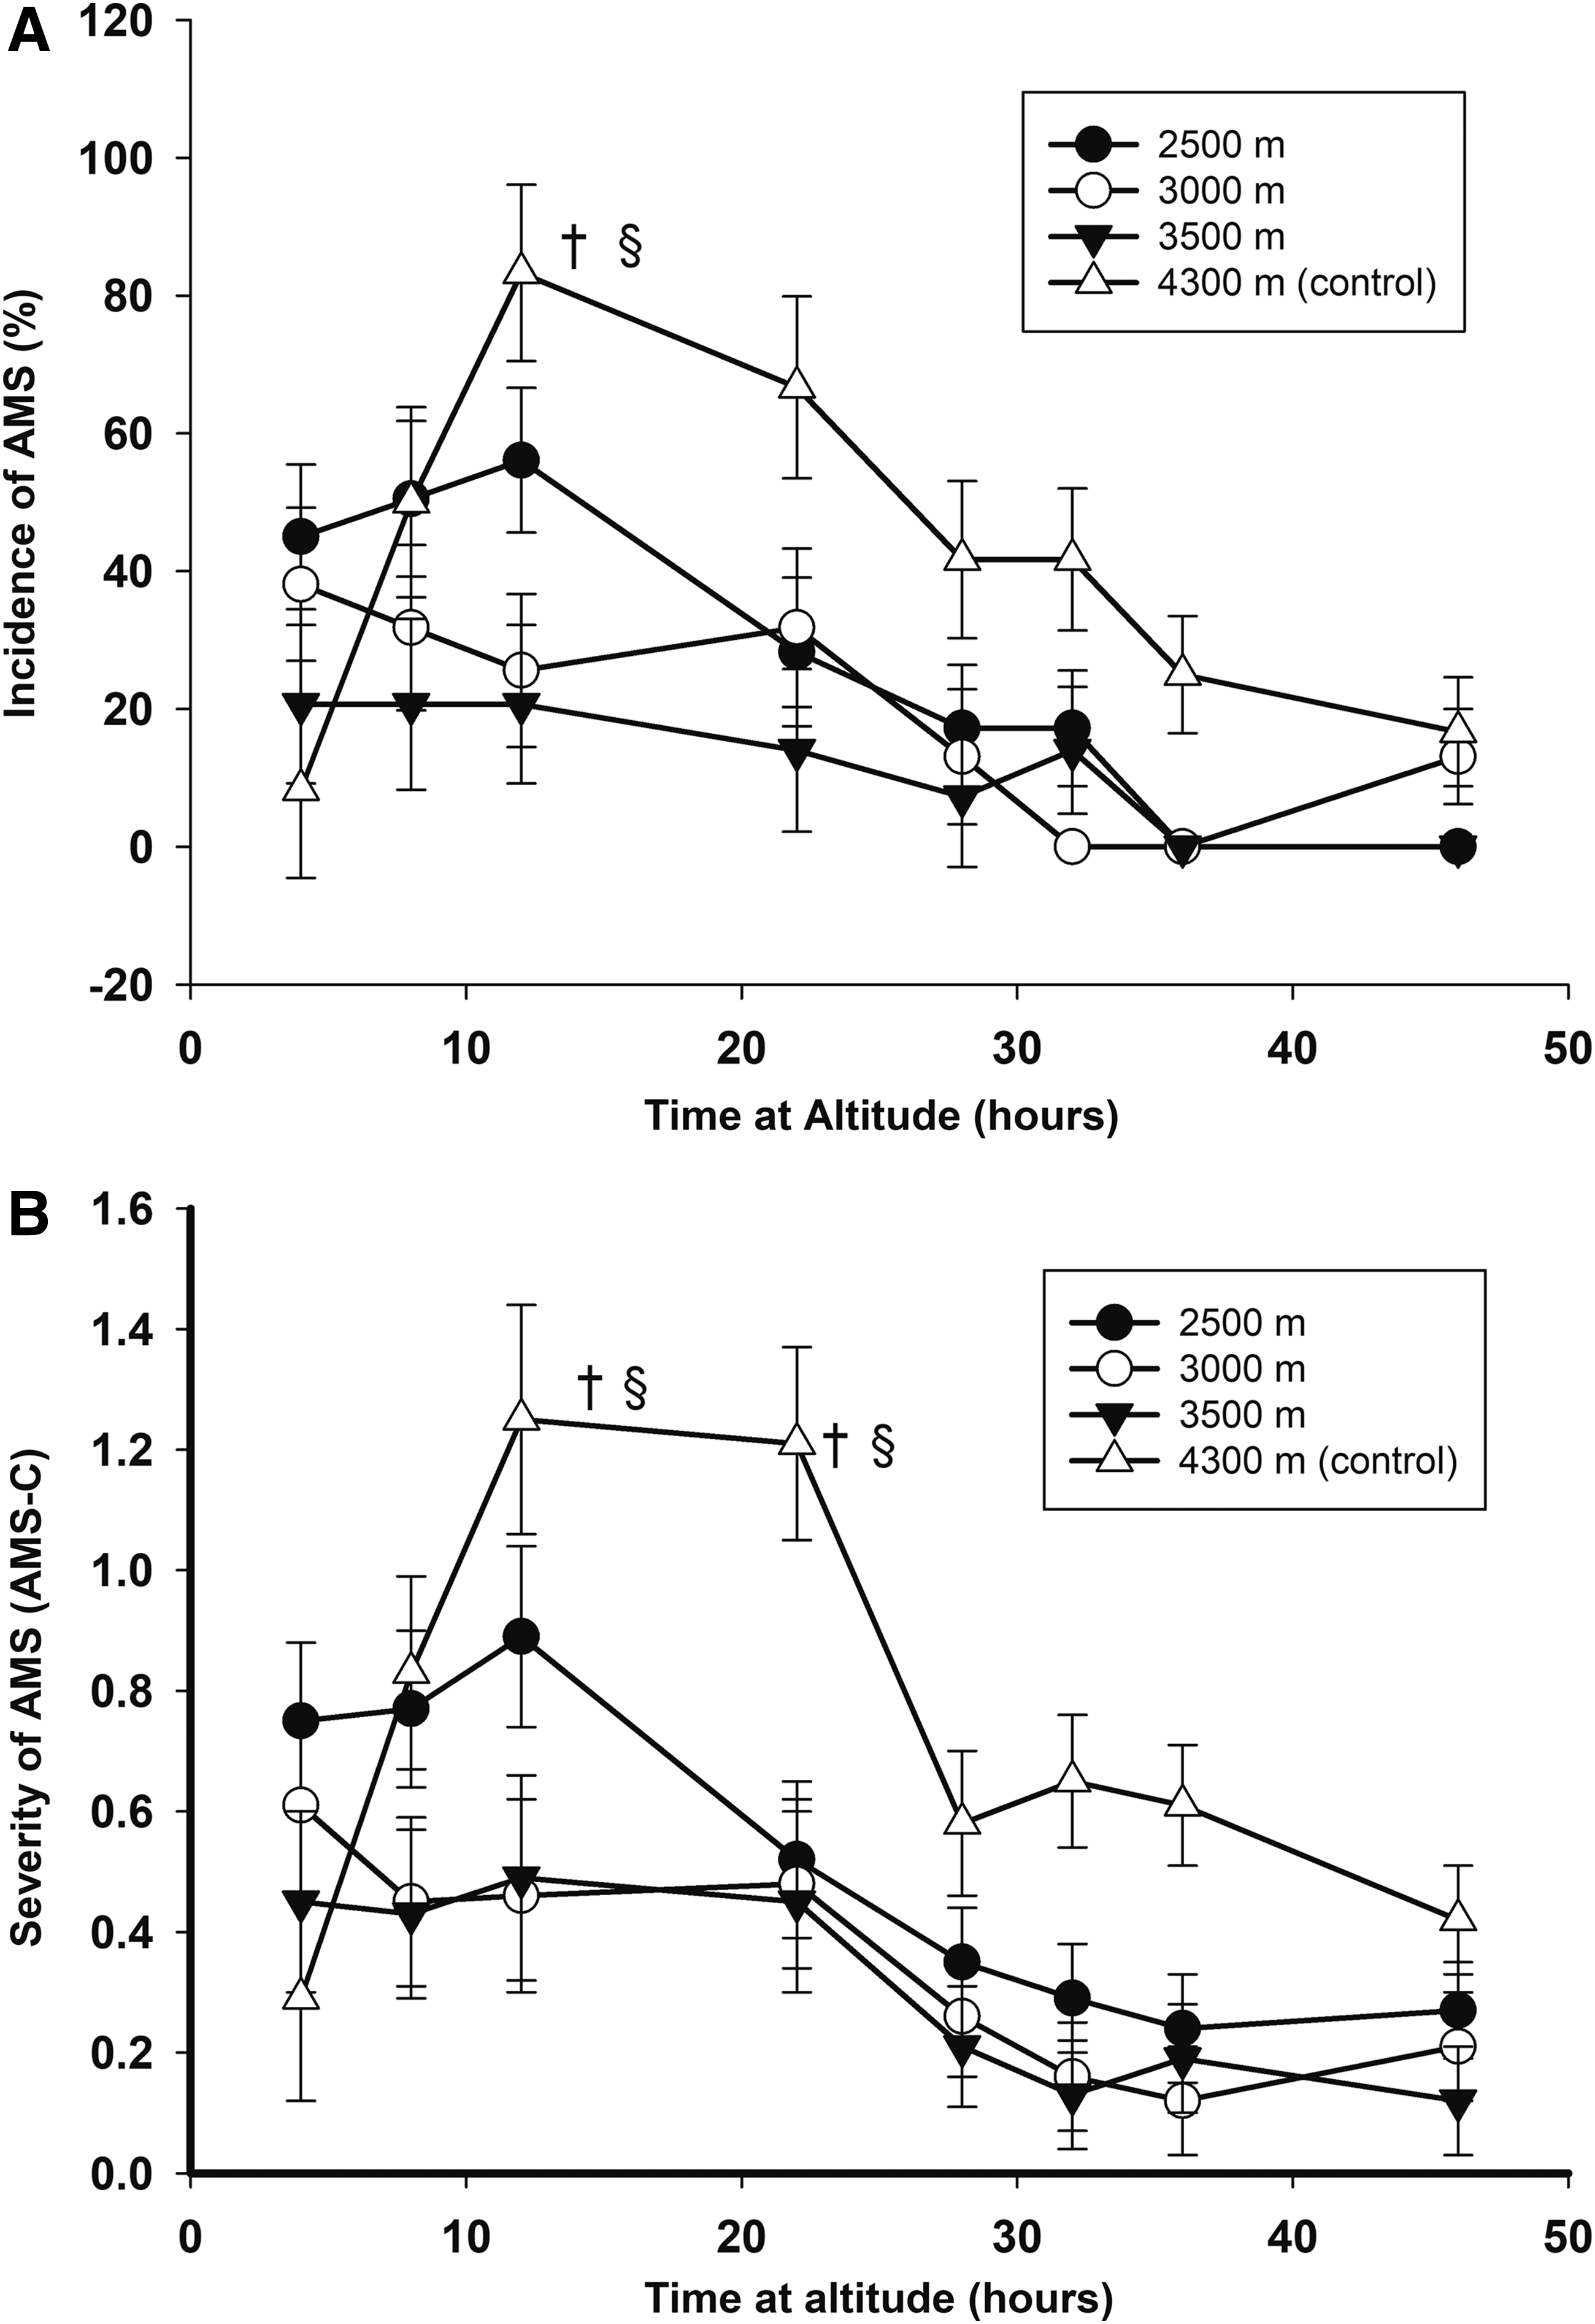
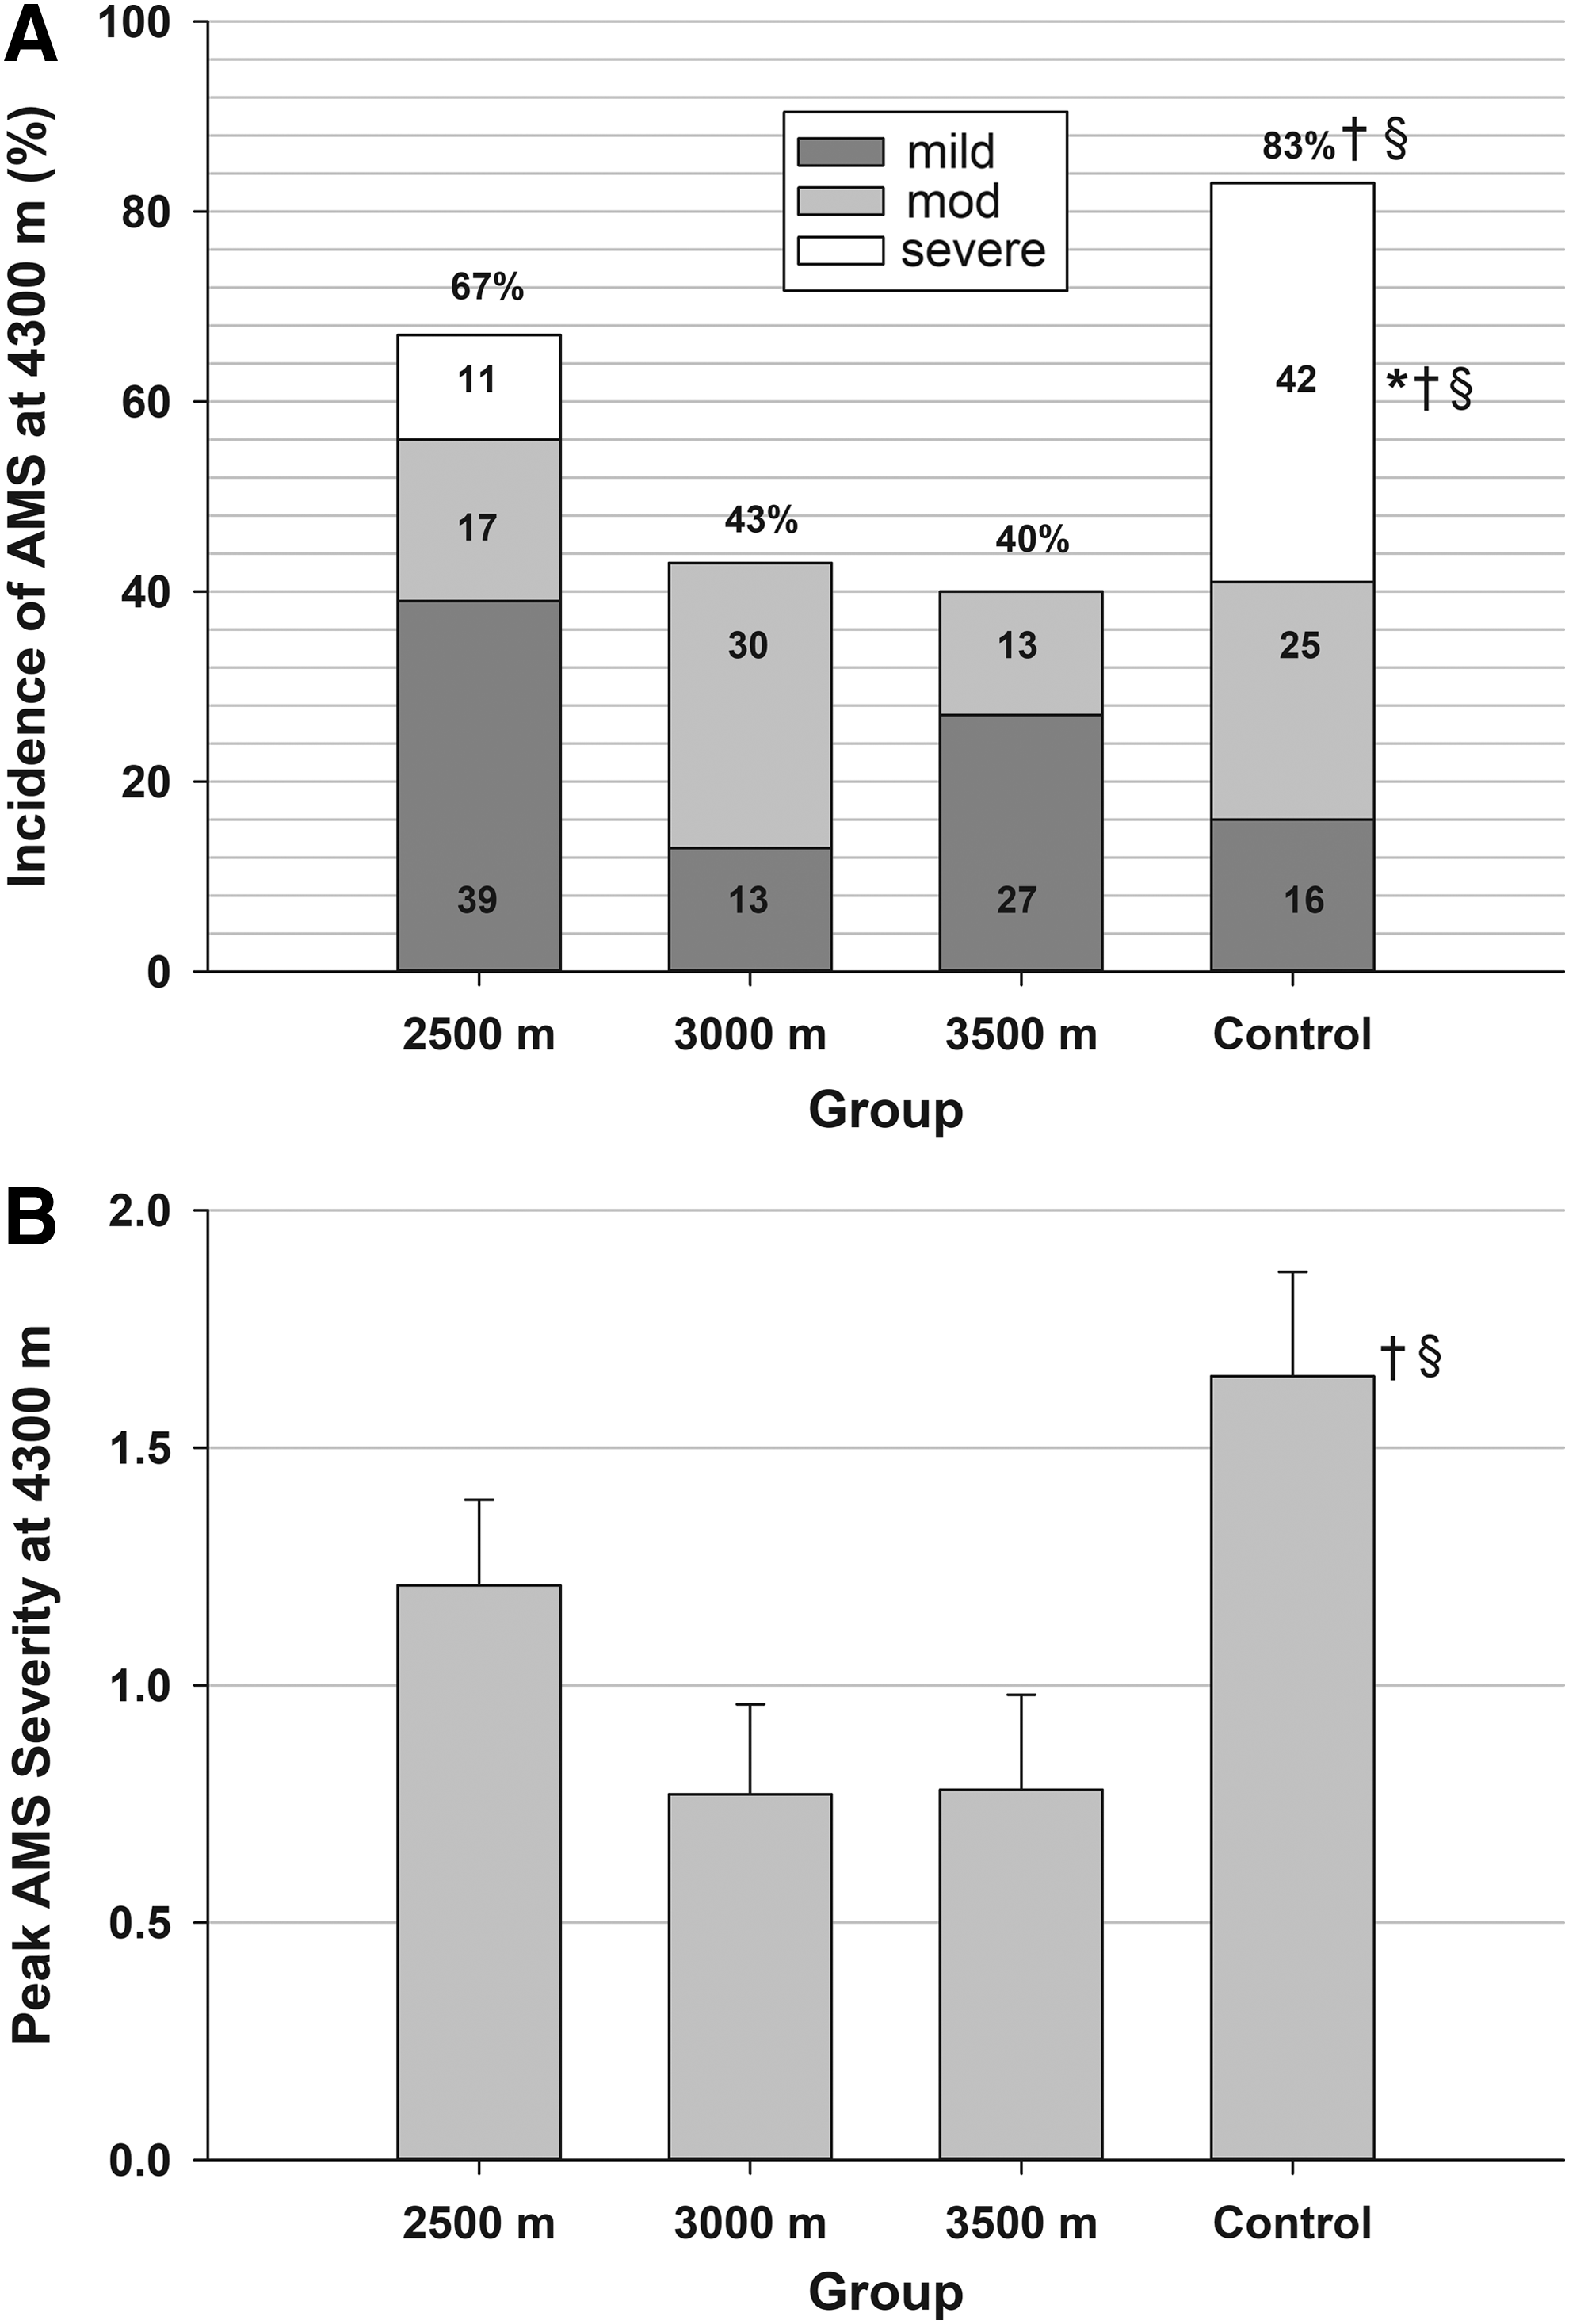
Table 2 also provides the outcome variables collected during the first 2 days at 4300 m in all groups. Surprisingly, the mean SpO2 and HR across the eight measurement points at 4300 m did not differ between any of the groups. The incidence and peak severity of AMS was lower in the 3000 and 3500 m groups but not in the 2500 m group compared with the direct ascent control group. There was a significant negative relationship between an individual's peak AMS severity during the first 2 days at 4300 m and their mean SpO2 over the eight measurement points (r = −0.31, p = 0.015). However, there was no relationship between an individual's peak AMS severity during the first 2 days at 4300 m and their mean HR over the eight measurement points (r = 0.06, p = 0.64). While at 4300 m, the incidence and severity of AMS peaked at 12 hours of exposure in all groups, except the 3000 m group, and was significantly higher in the direct ascent control group compared with the 3000 and 3500 m staged groups at this time point (Fig. 2). In addition, although there were no differences in the incidence of mild and moderate AMS between staged groups upon subsequent ascent to 4300 m, the incidence of severe AMS was significantly higher in both the 2500 m and control groups compared with the 3000 and 3500 m groups (Fig. 3). The peak severity of AMS was also significantly higher in the 2500 m and control groups compared with the 3000 and 3500 m groups (Fig. 3).
Discussion
This study found that 2 days of staging at 3000 or 3500 m, with or without physical activity, reduced the total and especially severe incidence of AMS upon further ascent to 4300 m in unacclimatized lowlanders. Previous guidance suggested that 4–6 days of staging is needed to reduce AMS upon subsequent ascent to a higher altitude (Beidleman et al., 2009; Evans et al., 1976; Hackett et al., 1976; Hansen et al., 1967). These findings demonstrate that staging time can be cut in half (e.g., 2 days) while staging at 3000 or 3500 m, but not at 2500 m, and still result in the same reduction in the incidence and peak severity of AMS. In addition, this study found that engaging in vigorous physical activity while staging at any altitude did not increase the risk of developing worse symptoms of AMS. As both 3000 and 3500 m were effective for reducing the incidence and severity of AMS with subsequent ascent to 4300 m, but the volunteers were significantly less sick while staging at 3000 m compared with 3500 m, we recommend staging for 2 days at 3000 m with or without physical activity.
The mean SpO2 values at the staging altitudes were similar to findings from previous studies conducted at similar altitudes (Beidleman et al., 1997; Maggiorini et al., 1998). In addition, the observed incidence of AMS at the staging altitudes was consistent with previous research (Beidleman et al., 2013; Montgomery et al., 1989). Utilizing rigorous hikes compared with sedentary activities was also successful in inducing significant differences in kilocalories expended during staging between the light and vigorous activity groups. Overall, the vigorous activity group burned ∼900 kcal/day more than the light activity group. Previous research has shown that 4 or more days of staging at moderate altitudes in unacclimatized lowlanders reduces the incidence and severity of AMS by 25%–50% upon further ascent to a higher target altitude compared with rapid ascent to the same target altitude (Beidleman et al., 2009; Evans et al., 1976; Hackett et al., 1976; Hansen et al., 1967). This study demonstrates for the first time that staging time can be cut in half (e.g., 2 days) with the same beneficial reductions in AMS symptoms (e.g., 30%–50% reduction in incidence and severity of AMS).
The effectiveness of reducing AMS during further ascent to a higher altitude by comparing different staging altitudes for the same amount of staging time in the same study has never been reported. This study demonstrates both a significantly lower severe AMS incidence and peak AMS severity in the 3000 and 3500 m groups compared with the direct ascent control group. The 2500 m group did not demonstrate a lower AMS incidence or peak AMS severity compared with the control group. Thus, 2500 m was not an effective staging altitude after a 2-day protocol. Others have successfully utilized 1500–2500 m to stage individuals before ascent to a higher altitude but a longer staging time (e.g., 6 days) was utilized to induce the benefits of acclimatization (Beidleman et al., 2009; Evans et al., 1976; Stamper et al., 1980). Given that the overall goal of staging is to go high enough to induce effective acclimatization but low enough to avoid the negative symptoms associated with AMS, it seems that 3000 m may be the best altitude for staging if a 2-day staging protocol is utilized.
The time course of AMS has been well established and the results of this study support the findings of previous studies (Beidleman et al., 2013). Although the highest incidence of AMS is typically observed in the morning after a night of sleep at altitude (Maggiorini et al., 1990), the highest incidence of AMS in this study was observed after 4–12 hours of exposure. This may be because of the fact that the staged volunteers participated in submaximal exercise tests shortly after arrival at 4300 m and the effects of exercise desaturation on AMS may be magnified at higher exercise intensities and elevations compared with lower elevations (Roach et al., 2000; Schommer et al., 2012). The severity of AMS peaked at 12–22 hours of exposure to 4300 m, which is consistent with previous reports that found that AMS severity peaked after the first night of sleep at altitude (Beidleman et al., 2017a; Beidleman et al., 2013). Figure 2 gives a rapid resolution of AMS by 36 hours of exposure, which is also consistent with previous reports (Gallagher and Hackett, 2004; Hackett and Roach, 2001b).
The effect of vigorous physical activity on AMS at altitude is controversial with some reporting a negative impact on AMS (Mairer et al., 2009; Roach et al., 2000) and others reporting no effect (Bircher et al., 1994; Schommer et al., 2012). Exercise at altitude can elicit a 5%–10% drop in SpO2 (Beidleman et al., 1999; Katayama et al., 1998), depending on the altitude, which effectively increases an individual's level of hypoxemia. In addition, exercise gives rise to a hormonal constellation that favors sodium and water retention (Bärtsch et al., 1988; Hackett et al., 1982). Given that AMS is associated with both hypoxemia and sodium and water retention, exercise may facilitate the occurrence of AMS. Although activity levels were significantly increased in the vigorous activity group, there was no increase in either the incidence or peak severity of AMS at the staging altitudes or upon arrival at 4300 m in the vigorous activity group. The mean individual SpO2 averaged across eight measurement points was negatively correlated with peak AMS severity while staging, suggesting a relationship between greater levels of hypoxemia and AMS. However, the limited amount of time spent exercising while staging did not seem to be additive in this regard. Individuals demonstrating higher mean HRs while staging did not exhibit higher levels of peak AMS severity. Individual HR variability seems to be a promising metric for predicting AMS at altitude but measurements should be made at altitude either in real-time or in a repetitive manner (Muza, 2018). Given that engaging in either light or vigorous physical activity did not seem to increase or decrease the risk of AMS, we recommend staging at 3000 m for 2 days before ascent to 4300 m, with or without physical activity.
Reasons for the lower incidence of total AMS, severe AMS, and peak severity AMS scores in the 3000 m and 3500 m groups upon further ascent to 4300 m may be attributed to a greater level of acclimatization obtained in these groups while staging compared with the 2500 m group. Although the mean SpO2 did not differ among groups upon arrival at 4300 m, individual SpO2 averaged across the eight measurement points was negatively correlated with individual peak AMS severity at 4300 m. This finding indicates the importance of examining individual and group mean responses. The value of spot measurements of SpO2 to predict AMS are controversial and remain debated in the literature (Basnyat, 2014; Muza, 2018; Windsor and Rodway, 2014). The fact that continuous measurements of SpO2 may be more predictive of AMS than spot measurements is emerging in recent literature (Beidleman et al., 2017b; Mandolesi et al., 2014). Given that this study measured SpO2 on eight occasions and then calculated the mean, repeated collection of SpO2 may be more beneficial for AMS prediction. Group mean HR did not differ among groups upon arrival at 4300 m and individual HR averaged across the eight measurement points at 4300 m was also not correlated with individual peak AMS severity at 4300 m. Individual HR variability may be a better predictor of AMS and should be examined in future studies (Muza, 2018).
In addition, there may be, as suggested by others (Beidleman et al., 2017b; Gavrvican-Lewis et al., 2016), a threshold hypoxic dose that must be exceeded to start the acclimatization process. The hypoxic dose measured in “meter hours” in this study demonstrates that 2 days at 2500 m does not exceed this threshold value. However, the acclimatization process is clearly started after a hypoxic dose equivalent to 2 days at 3000 m. Altitude acclimatization is a complex process involving multiple physiologic systems and each one may have a separate threshold value that confers lasting protection.
Some of the physiologic mechanisms suspected of contributing to the pathophysiology of AMS were not measured in this study. For instance, traditional theory contends that AMS is the end result of intracranial hypertension caused by vasogenic edema subsequent to mechanical disruption of the blood–brain barrier (Hackett and Roach, 2001b). This “tight-fit” hypothesis provides a reasonable explanation for altitude headaches through trigeminovascular system activation (Ross, 1985). However, recent altitude research suggests that modest fluctuations in intracranial pressure, in concert with direct vascular stretch because of dilatation and/or increased blood pressure transmission, may activate the trigeminal system and cause symptoms of AMS (Lawley et al., 2016). Finally, recent research suggests that altitude acclimatization increases AMP-activated protein kinase that induces 2,3 biphosphoglycerate production, O2 release, and a reduction in tissue hypoxia (Liu et al., 2016). All these changes may result in a reduction in AMS with acclimatization. Whatever the reason, it is clear that acclimatization obtained while staging at moderate altitude directly reduces the incidence and severity of AMS after subsequent ascent to a higher altitude. Further research on the physiologic mechanisms responsible for the reduction in AMS during ascent to a higher target altitude after staging is warranted.
Limitations of this study include the fact that the direct ascent control group did not participate in programmed endurance tests on the first 2 days at 4300 m. This was carried out as part of the larger study design to evaluate the impact of 2 days of staging at all the altitudes on other outcome measures. Although the direct ascent group did not participate in programmed endurance tests, they were somewhat active as reflected in the kilocalories expended per day, and their daily energy expenditure did not differ from the staged groups that participated in programmed endurance tests. Therefore, it is unlikely that AMS was affected by significant differences in the amount of exercise between the staged and direct ascent groups. Another limitation is the different subject numbers in the four groups. Although we attempted as much as possible to keep the numbers equal, four dropouts in the 4300 m group occurred after SL testing and we could not replace them at the last minute because of the complexity of the study. Despite these limitations, the equal representation of men and women and light and vigorous activity in each group makes this a well-controlled randomized study to determine the best staging strategies before ascent to 4300 m. Finally, the volunteers stayed for one night at 2000 m before ascending to the staging sites. However, the volunteers were put on supplemental O2 immediately upon arrival at the apartment in Colorado Springs until their departure. Given that all volunteers maintained O2 saturation levels equivalent to SL values in the apartments, their outcome measures are representative of rapid ascent of unacclimatized lowlanders from SL.
Conclusion
We recommend staging at 3000 m for at least 2 days before ascent to 4300 m, with or without physical activity, to reduce the negative symptoms of AMS.
Footnotes
Acknowledgments
The study was supported by U.S. Army Medical and Materiel Command. The dedicated and professional efforts of Dr. John Castellani, Mr. Vinnie Forte, Ms. Myra Jones, Mr. Timothy Driscoll, Ms. Katelyn Guerriere, Ms. Marie Grunbeck, and Ms. Jennifer Rayburn supporting the collection and analysis of the data are acknowledged and greatly appreciated. The dedication and efforts of the test volunteers in completing this study are also acknowledged and appreciated. The opinions or assertions contained herein are the private views of the authors and are not to be construed as an official or as reflecting the views of the Army or Department of Defense. Citations of commercial organizations and trade names in this report do not constitute an official Department of the Army endorsement or approval of the products or services of these organizations. Approved for public release; distribution unlimited.
Authors' Contributions
B.A.B.: Study design, data collection, data analysis, manuscript preparation, final manuscript approval. C.S.F.: Study design, data collection, data interpretation, final manuscript approval. E.G.: Data analysis, data interpretation, final manuscript approval. A.C.: Study design, data collection, data interpretation, final manuscript approval. R.W.K.: Data collection, final manuscript approval. B.S.C.: Data collection, final manuscript approval. J.E.S.: Data collection, data interpretation, manuscript preparation, final manuscript approval. S.P.A.: Data collection, final manuscript approval. I.V.S.: Data collection, data analysis, final manuscript approval. S.R.M.: Study design, data collection, data interpretation, final manuscript approval.
Author Disclosure Statement
No competing financial interests exist.