
Abstract
Abstract
Understanding the process of successful adaptation to high altitude provides valuable insight into the pathogenesis of conditions associated with impaired oxygen uptake and utilization. Prepubertal children residing at low altitude show a reduced cerebrovascular response to exercise in comparison to adults, and a transient uncoupling of cerebral blood flow to changes in the partial pressure of end-tidal CO2 (PETCO2); however, little is known about the cerebrovascular response to exercise in high-altitude native children. We sought to compare the cerebral hemodynamic response to acute exercise between prepubertal children residing at high and low altitude. Prepubertal children (n = 32; 17 female) of Sherpa descent (Sherpa children [SC]) at high altitude (3800 m, Nepal) and maturational-matched (n = 32; 20 female) children (lowland children [LLC]) residing at low altitude (342 m, Canada). Ventilation, peripheral oxygen saturation (SpO2), PETCO2, and blood velocity in the middle and posterior cerebral arteries (MCAv and PCAv) were continuously measured during a graded cycling exercise test to exhaustion. At baseline (BL), PETCO2 (−19 ± 4 mmHg, p < 0.001), SpO2 (−6.0% ± 2.1%, p < 0.001), MCAv (−12% ± 5%, p = 0.02), and PCAv (−12% ± 6%, p = 0.04) were lower in SC when compared with LLC. Despite this, the relative change in MCAv and PCAv during exercise was similar between the two groups (p = 0.99). Linear regression analysis demonstrated a positive relationship between changes in PETCO2 with MCAv in SC (R2 = 0.13, p > 0.001), but not in LLC (R2 = 0.03, p = 0.10). Our findings demonstrate a similar increase in intra-cranial perfusion during exercise in prepubertal SC, despite differential BL values and changes in PETCO2 and SpO2.
Introduction
Natives of the Tibetan plateau have the longest history of living at high altitude, with evidence of initial migration to this region over 40,000 years ago (Huerta-Sánchez et al., 2014). Lifelong residence in this environment (>3000 m above sea level) has driven adaptations that sustain oxygen transport at rest and during exercise in the Sherpa and Tibetan populations who reside in this region. Although early studies suggested a blunting of the hypoxic ventilatory response in Sherpa (Lahiri and Milledge, 1967; Lahiri et al., 1967; Milledge and Lahiri, 1967), a recent comprehensive review (Gilbert-Kawai et al., 2014) concluded that the hypoxic ventilatory response at rest of Tibetans/Sherpa was not different from lowlanders.
Whether adaptations are developmental in origin is poorly understood and data for children living in the Tibetan plateau are sparse; however, there is evidence that Sherpa and Tibetan children have a higher resting minute ventilation (VE), greater total lung capacity and pulmonary diffusion capacity, and superior exercise capacity compared with non-native residents (de Meer et al., 1995; Bianba et al., 2014; Simonson, 2015).
The integrated ventilatory and cerebral blood flow (CBF) response to high altitude has been extensively studied in adults (reviewed in Hoiland et al., 2018). Although hypoxia is a cerebral vasodilator, the peripheral chemoreceptive response to the hypoxic condition results in hyperventilation and a lowering of arterial pressure of CO2 (PaCO2). This hypocapnia leads to cerebral vasoconstriction and thus attenuates the hypoxic-induced vasodilation and related increases in brain blood flow (Ainslie and Duffin, 2009).
During exercise at high altitude, the integrative control of CBF is largely governed by the level of arterial hypoxemia and brain tissue pressure of CO2 (PCO2), reviewed by Smith and Ainslie, 2017. In adults at sea level, progressive normoxic exercise increases CBF until ∼70% of maximum workload (Smith and Ainslie, 2017); thereafter, hyperventilatory-induced hypocapnia begins to restrict CBF back toward baseline (BL) levels. At high altitude, however, exercise-induced hypoxemia experienced at high workloads causes a reduction in arterial oxygen content, and additional elevations in CBF occur to prioritize cerebral oxygen delivery (Smith et al., 2014).
Very little is known about CBF regulation at rest or during exercise in the healthy child (Ainslie and McManus, 2016). Ellis et al. (2017) report a smaller increase in intracranial blood velocity in prepubertal children during exercise compared with adults. These differences between children and adults were likely related to an altered relationship between changes in the partial pressure of end-tidal CO2 (PETCO2, and subsequently brain tissue PCO2) and changes in intracranial velocity in children during exercise, possibly the consequence of developmental differences in cerebrovascular reserve and the chemoreceptive control of breathing (Cooper et al., 1987; Springer et al., 1988; Gozal et al., 1994; Pianosi and Wolstein, 1996).
It would be reasonable to expect that if Sherpa children (SC) show a reduced ventilatory response during exercise (in line with some Tibetan adults) (Ge et al., 1995; Curran et al., 1998; Faoro et al., 2014), this would intensify increases in brain tissue PCO2 and may further enhance CBF during exercise. Furthermore, our group has recently demonstrated a reduced resting global CBF in SC at high altitude compared with lowlanders at low altitudes (Flück et al., 2018), which may implicate a greater flow reserve for increases in CBF during exercise. To date, no study has investigated the CBF response to exercise in high-altitude native children.
The primary aims of this study were therefore to (1) evaluate regional changes in intracranial blood flow, indexed by middle cerebral artery blood velocity (MCAv) and posterior cerebral artery blood velocity (PCAv) during incremental exercise to exhaustion in SC and lowland children (LLC); and (2) investigate the relationship between changes in end-tidal PCO2 and regional intracranial blood flow velocities. A secondary aim was to explore differences in respiratory gas exchange during exercise between the two populations, at their respective altitudes of habitual residence.
Methods
Ethical approval
This study was approved by the Clinical Research Ethics Board of the University of British Columbia, and the Nepal Health Medical Research Council. All experimental protocols and procedures conformed to the standards set by the Canadian Government Tri-Council Policy Statement for Integrity in Research, as well as the Declaration of Helsinki, except for registration in a database. A detailed verbal and written explanation of the measurements was provided to participants, parents/guardians before participation. All documents were provided in the first language of the participants and were professionally translated and back-translated. A member of the research team verified the Nepali language translation and provided Sherpa verbal explanations to facilitate communication. Each participant's parent/guardian completed written, informed consent and participants provided written assent.
Study design and recruitment
This study was a part of a larger expedition conducted in October 2016, however, there is no overlap between this investigation and others completed by the same participants. Primary research questions addressed in the current study are novel and exclusively pertain to this study alone. This cross-sectional study consisted of two study sites. The first site was in the high-altitude villages of Thame and Khunde in the Khumbu Valley, Nepal (∼3800 m elevation), where we recruited 42 preadolescent children of Sherpa descent for participation. At the second site, 38 preadolescent Canadian LLC were recruited as participants from Kelowna, British Columbia (343 m elevation). A health-screening questionnaire, conducted orally in Nepal and in writing in Kelowna, was completed by the child's primary guardian. None of the children had any reported cardiovascular, cerebrovascular, or respiratory disease, and no child was on prescription or over-the-counter medication.
Participants
The Sherpa ancestral lineage of the Nepalese children was confirmed verbally by their respective guardians and the practicing Khumbu Valley physician. All were born, grew up, and resided at elevations between 3700 and 4000 m. Of the 42 SC, 32 (17 female) satisfied our requirements for having performed a maximal exercise test (by criteria described below) and were included in the final analyses. Maximal exercise was confirmed in 32 (20 female) of the 38 LLC, who all resided at an altitude <400 m at the time of testing. Participant characteristics are listed in Table 1 (mean ± standard deviation [SD]). Notably, while the SC were slightly older (p = 0.02), shorter (p = 0.007), and weighed less (p = 0.008) than the Lowlanders, they had similar body mass index (BMI; p = 0.14) as well as predicted age at peak height velocity (aPHV; p = 0.85) (Mirwald et al., 2002), a measure of maturational status based on chronological age, height, weight, and limb length.
Participant Characteristics
Denotes significant difference between Sherpa and lowlanders, p < 0.05.
aPHV, age at peak height velocity; BMI, body mass index.
Procedures
Each child visited the testing site once, and participants were instructed to refrain from vigorous exercise and caffeine for 24 hours before the test and not to eat within 2 hours of the exercise test. It should be noted, however, that some of the SC had to walk >1 hour from their residence to reach the testing facility; however, we ensured that these children rested for at least 2 hours before the commencement of testing.
Upon arrival at the testing site, measures of height, sitting height (Harpenden Stadiometer), and body mass (electronic scale) were taken with the children barefoot and dressed in light clothing. The children were then given the opportunity to try out the cycle ergometer (Lode Pediatric Corival, Groningen, The Netherlands), cycling slowly for 5 minutes to allow for habituation to the ergometer. Children were then instrumented (measurements described below) and completed 15-minute supine and 2 minutes of seated BL assessment of arterial blood pressure, heart rate (HR), peripheral oxygen saturation (SpO2), oxygen uptake (VO2), minute ventilation (VE), partial pressure of end-tidal oxygen (PETO2), PETCO2, and intracranial blood flow velocity.
Following BL assessment, the children completed an incremental exercise test to exhaustion on the cycle ergometer. The test began with a 3-minute unloaded warmup at a cadence of 70–80 revolutions per minute (rpm). Immediately after the warmup, cadence was kept at 70–80 rpm and the resistance was progressively increased in a stepwise manner in accordance with the child's height (2-minute stages, <110 cm 5 W/stage, 110–125 cm 10 W/stage, 125–150 cm 15 W/stage, >150 cm 20 W/stage) until volitional exhaustion, which was defined as a drop in cadence below 60 rpm for 5 consecutive seconds, despite strong verbal encouragement. Exercise tests were excluded from analysis if tests were ended before volitional exhaustion, confirmed by intense signs of effort such as facial flushing, sweating, hyperpnoea, and by a peak HR <85% of predicted maximum. Respiratory gas analysis, cardiovascular, and cerebrovascular variables were recorded continuously throughout the exercise protocol.
Primary outcome measures
Blood flow-velocities in the right middle cerebral artery (MCAv) and left posterior cerebral artery (PCAv) were continuously recorded through the test using a 2 MHz transcranial Doppler (TCD) ultrasound (Spencer Technologies, Seattle, WA). The probes were attached bilaterally using a pediatric-sized headband, and respective arteries were insonated through the transtemporal window using standardized methods previously described by our laboratory (Willie et al., 2011). All flow-velocity data were recorded using an analog-to-digital converter (PowerLab, 16/30; ADInstruments, Colorado Springs, CO) for storage and off-line analysis.
Cardiorespiratory measures
Arterial blood pressure was measured in the last 30 seconds of each stage using an automated cuff (Tango+; Suntech, Morrisville, NC), and a three-lead electrocardiogram (ADI Bioamp ML132;C ADInstruments) was used to measure HR. Arterial O2 saturation was monitored continuously through the finger using pulse oximetry (Rad-5; Masimo SET, Irvine, CA).
Respiratory gas exchange (CO2 production [VCO2], VO2, PETCO2 and PETO2, tidal volume [VT], breathing frequency [fb], and VE) was measured on breath by breath basis using a metabolic cart (Oxycon Pro; CareFusion) for all the SC and 13 LLC; however, due to equipment breakage, a ML206 gas analyzer (ADInstruments) and pneumotachograph (HR800L; HansRudolph, Shawnee, KS) were used for the remainder of the LLC group. Exploratory analysis of our data has revealed no significant differences in respiratory variables between LLC assessed using the Oxycon and those assessed using the ADInstruments gas analyzer and pneumotachograph. Calibration of the gas analyzers and flow was performed before each test with gases of known concentrations and a 3-L syringe, respectively.
Data processing
During exercise, several key timepoints were manually identified for each participant: (1) moderate intensity (MI), a subthreshold point representing 60% of the time from the start of the first stage until the ventilatory threshold (TVENT); (2) TVENT was identified using the V-slope method (Beaver et al., 1986), paired with ventilatory changes (ventilatory equivalents) for reference; (3) the respiratory compensation point (RCP) was identified using the point of inflection on the VE/VCO2 slope; and (4) the 15-second bin with the highest average VO2 during the test was chosen as the peak. Linear regression analysis was used to find the slope of the best-fit for the VE/VCO2 relationship before the RCP. Cardiorespiratory and cerebrovascular data are presented as 15-second bins for each identified timepoint (mean ± SD); however, BL data are presented as a 1-minute average.
Mean arterial pressure (MAP) was estimated using the following calculation: MAP = 1/3 (systolic blood pressure − diastolic blood pressure) + diastolic blood pressure. In addition, an index of cerebrovascular resistance (CVRi) was calculated by dividing MAP by MCAv or PCAv (mmHg/[cm·s]).
Statistical analyses
The normality of the main outcome variables (MCAv, PCAv, P
Results
Unless otherwise stated, data are presented from the 32 SC and 32 lowlanders who completed the maximal exercise protocol.
Maximal exercise
Absolute (mL/min) and mass relative (mL/[kg·min]) peak VO2 were higher in LLC (Table 2, p < 0.001). When a loglinear adjustment for mass was used, VO2 was ∼14% lower in SC and remained significant (Table 3, p = 0.003). TVENT occurred at the same relative exercise intensity (p = 0.88) in the SC (61% ± 10% peak VO2) and LLC (62% ± 9% peak VO2). Relative peak power output achieved by the SC (2.1 ± 0.5 W/kg) was significantly reduced compared to LLC (2.8 ± 0.6 W/kg, p < 0.01). Resting HR was similar between the two groups (p = 0.23); however, peak HR was lower in SC (−12.1 beats/min, p < 0.001).
Ventilatory and Cardiovascular Responses to a Graded Exercise Test in Sherpa and Lowlander Children
Values are mean ± SD. N = 32 in each group.
P < 0.05 compared to Lowlanders.
BL, baseline; fb, breathing frequency; HR, heart rate; LLC, lowland children; MAP, mean arterial pressure; MCAv, middle cerebral artery velocity; MI, moderate intensity; PCAv, posterior cerebral artery velocity; PETCO2, partial pressure of end-tidal CO2; RCP, respiratory compensation point; RER, respiratory exchange ratio; SC, Sherpa children; SD, standard deviation; SpO2, peripheral oxygen saturation; TVENT, ventilatory threshold; VCO2, carbon dioxide production; VE, minute ventilation; VO2, oxygen uptake; VT, tidal volume.
Mass-Adjusted Metabolic and Respiratory Parameters at Rest and During Exercise in Sherpa and Lowlander Children
Values represent estimated marginal means (lower to upper 95% confidence limit) of selected variables using a loglinear adjustment with the covariate: log [mass]. N = 32 in each group.
p > 0.05 compared to lowlanders.
Ventilation
Absolute VE was greater in the LLC at rest and at all exercise intensities (Table 2); however, when a loglinear adjustment for body mass was applied, VE was similar between LLC and SC at all time points, except for BL (BL VE: SC—8.55 [95% CL: 7.82–9.34] mL/min; LLC—11.33 [95% CL: 10.39–12.35] mL/min). Mass-adjusted VT was higher in LLC at all intensities except for peak (p < 0.05; see Fig. 1). No difference in fb was identified between SC and LLC at BL (p > 0.99). Although fb was 6.3 ± 2.2 breaths/min greater in SC than LLC at MI (p = 0.02), both groups achieved similar peak fb (Table 2).
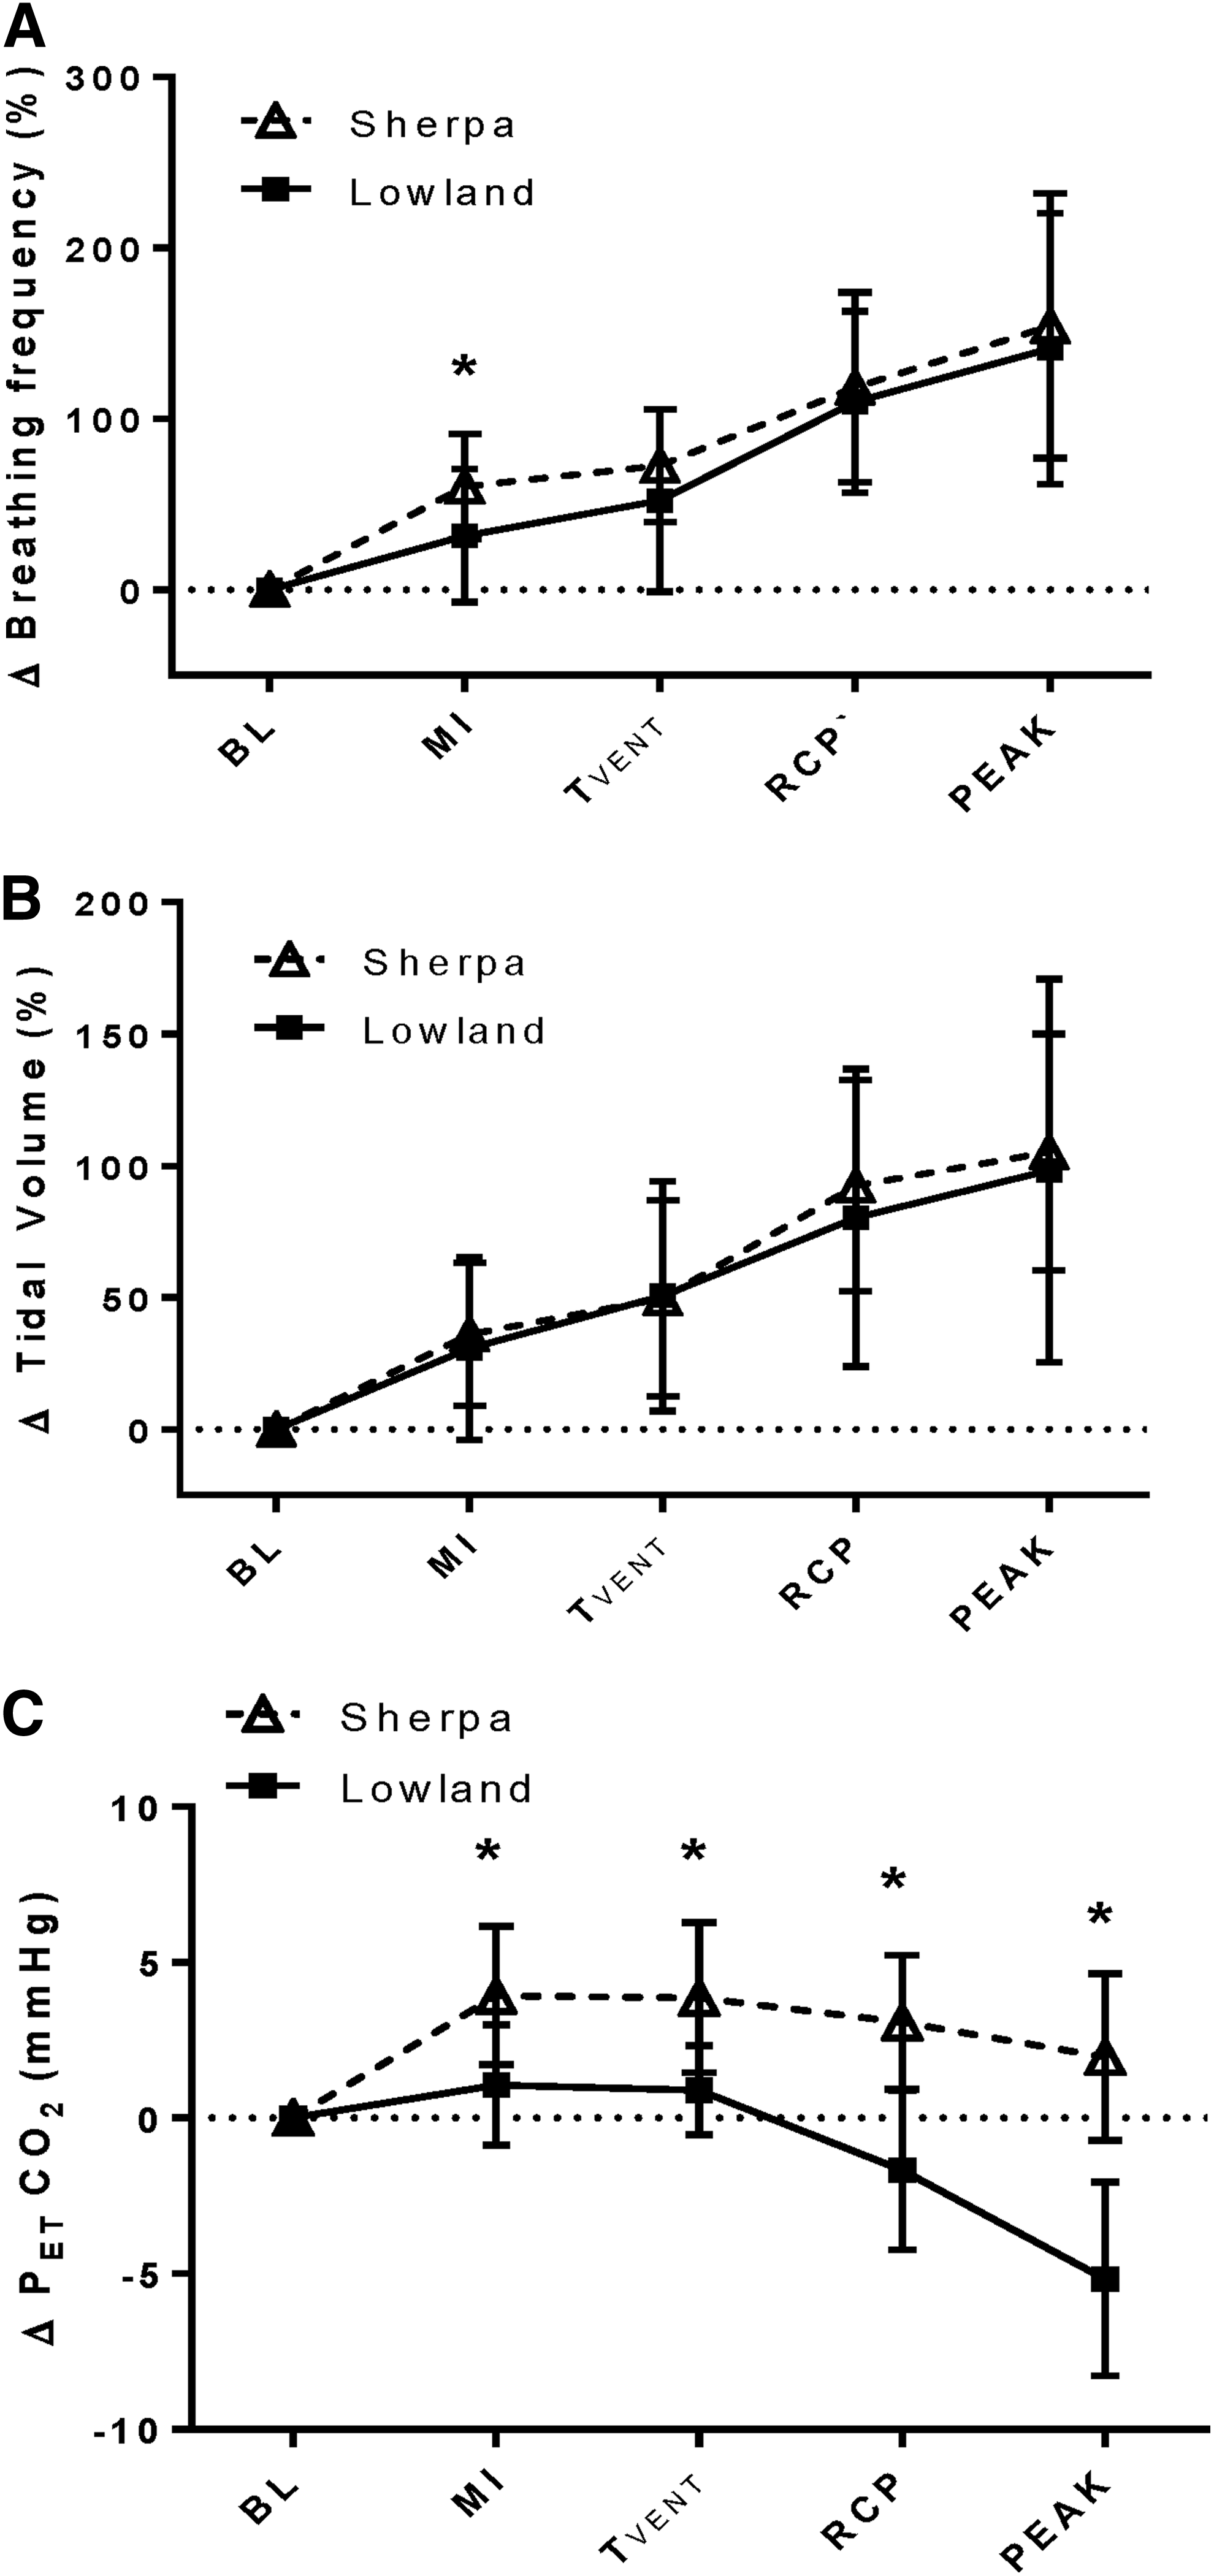
Respiratory responses to exercise in 32 SC tested at 3800 m (SC, open triangles) and 32 LLC tested at 344 m (LLC, filled squares).
The SC had lower PETCO2 at BL than LLC (20.9 ± 2.9 vs. 38.2 ± 3.2 mmHg, p < 0.001) and at all exercise intensities (Table 2). During MI exercise, and at TVENT, PETCO2 increased by 3.9 ± 2.2 and 3.8 ± 2.4 mmHg, respectively, in SC (p < 0.001), while PETCO2 was maintained at BL values in LLC (p > 0.05). At peak exercise, PETCO2 was reduced in SC, but was still elevated significantly above BL (+2.0 ± 2.7 mmHg, p = 0.01). In contrast, PETCO2 was reduced below BL in the LLC (−5.2 ± 3.1 mmHg, p < 0.001). At all exercise intensities, the SC were more hypercapnic relative to their own BLs than the LLC (Fig. 1C, p < 0.001). In addition, the slope of the ΔVE/ΔVCO2 relationship before RCP was significantly elevated in SC (52.5 ± 9.1 vs. 27.4 ± 3.2, p < 0.001).
MAP (Table 2) was available at BL and all exercise intensities in 25 LLC and 24 SC. MAP was higher in SC (p < 0.01) at all time points. Increasing exercise intensity was associated with increases in MAP (p < 0.001); however, the magnitude of the increase in MAP was similar between groups at each stage (p = 0.91). As presented in Table 2, SpO2 was significantly lower in SC at all timepoints (p < 0.001). At maximal exercise, although there was a significant reduction in SpO2 in both groups, (SC—3.2% ± 2.3%, p < 0.01; LLC—2.0 ± 1.8%, p = 0.04) the magnitude of this decline did not differ between the groups (p = 0.33).
Intracranial blood velocity
Absolute MCAv (Table 2) was greater in LLC compared with SC at rest (p = 0.004) and during all exercise intensities (p = 0.002). The PCA was not insonated in all lowlanders; however, comparisons of PCAv were made between 12 maturational- and sex- matched pairs of SC and LLC children. Here, PCAv was also greater in LLC compared with SC at rest and at all stages of exercise (p = 0.03). Intracranial velocities were increased above BL at all exercise intensities in both the MCA (p < 0.001) and the PCA (p < 0.001). At peak exercise, however, MCAv and PCAv, were slightly reduced from submaximal exercise toward BL (p > 0.05). When expressed as a percent change from BL, there were no differences in the magnitude of increases in MCAv or PCAv between SC and LLC at any time point (Fig. 2A). Furthermore, supporting the notion of a lack of regional differences, the delta change in PCAv did not differ from the delta change in MCAv at any time point in either the SC or LLC (Fig. 3A).
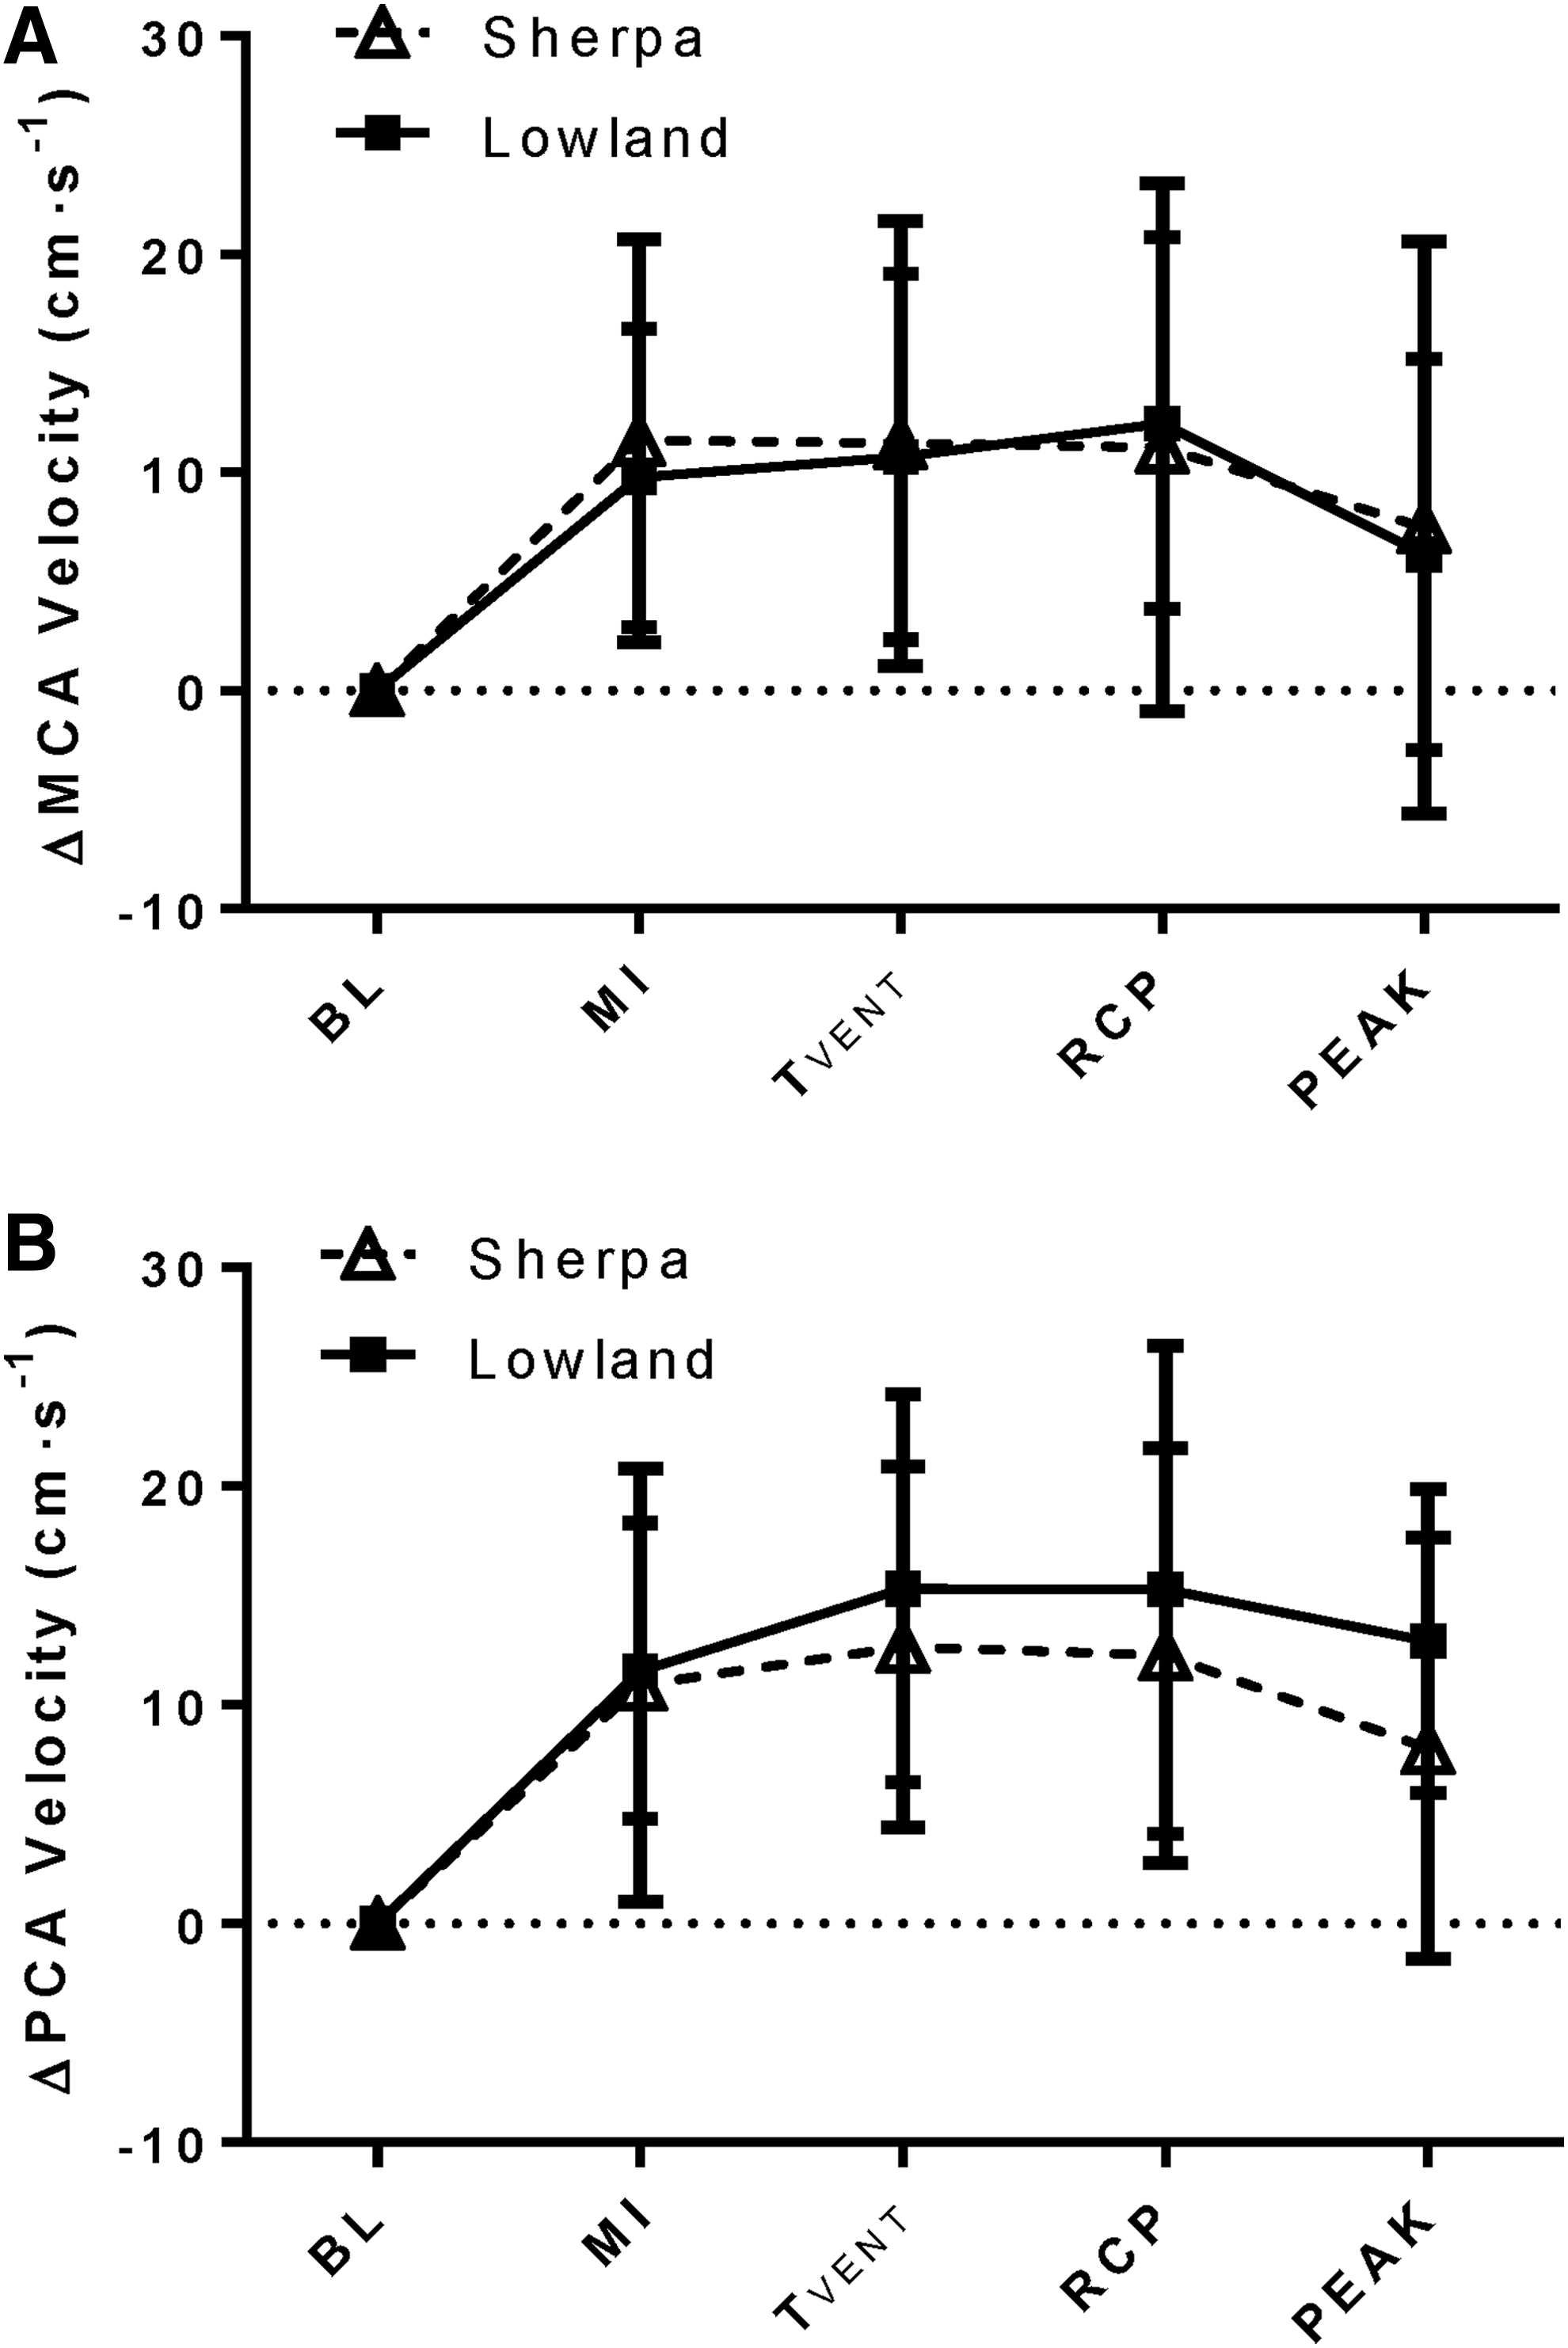
Intracranial blood flow velocity response to exercise in SC tested at 3800 m (SC, open triangles) and LLC tested at 344 m (LLC, filled squares).
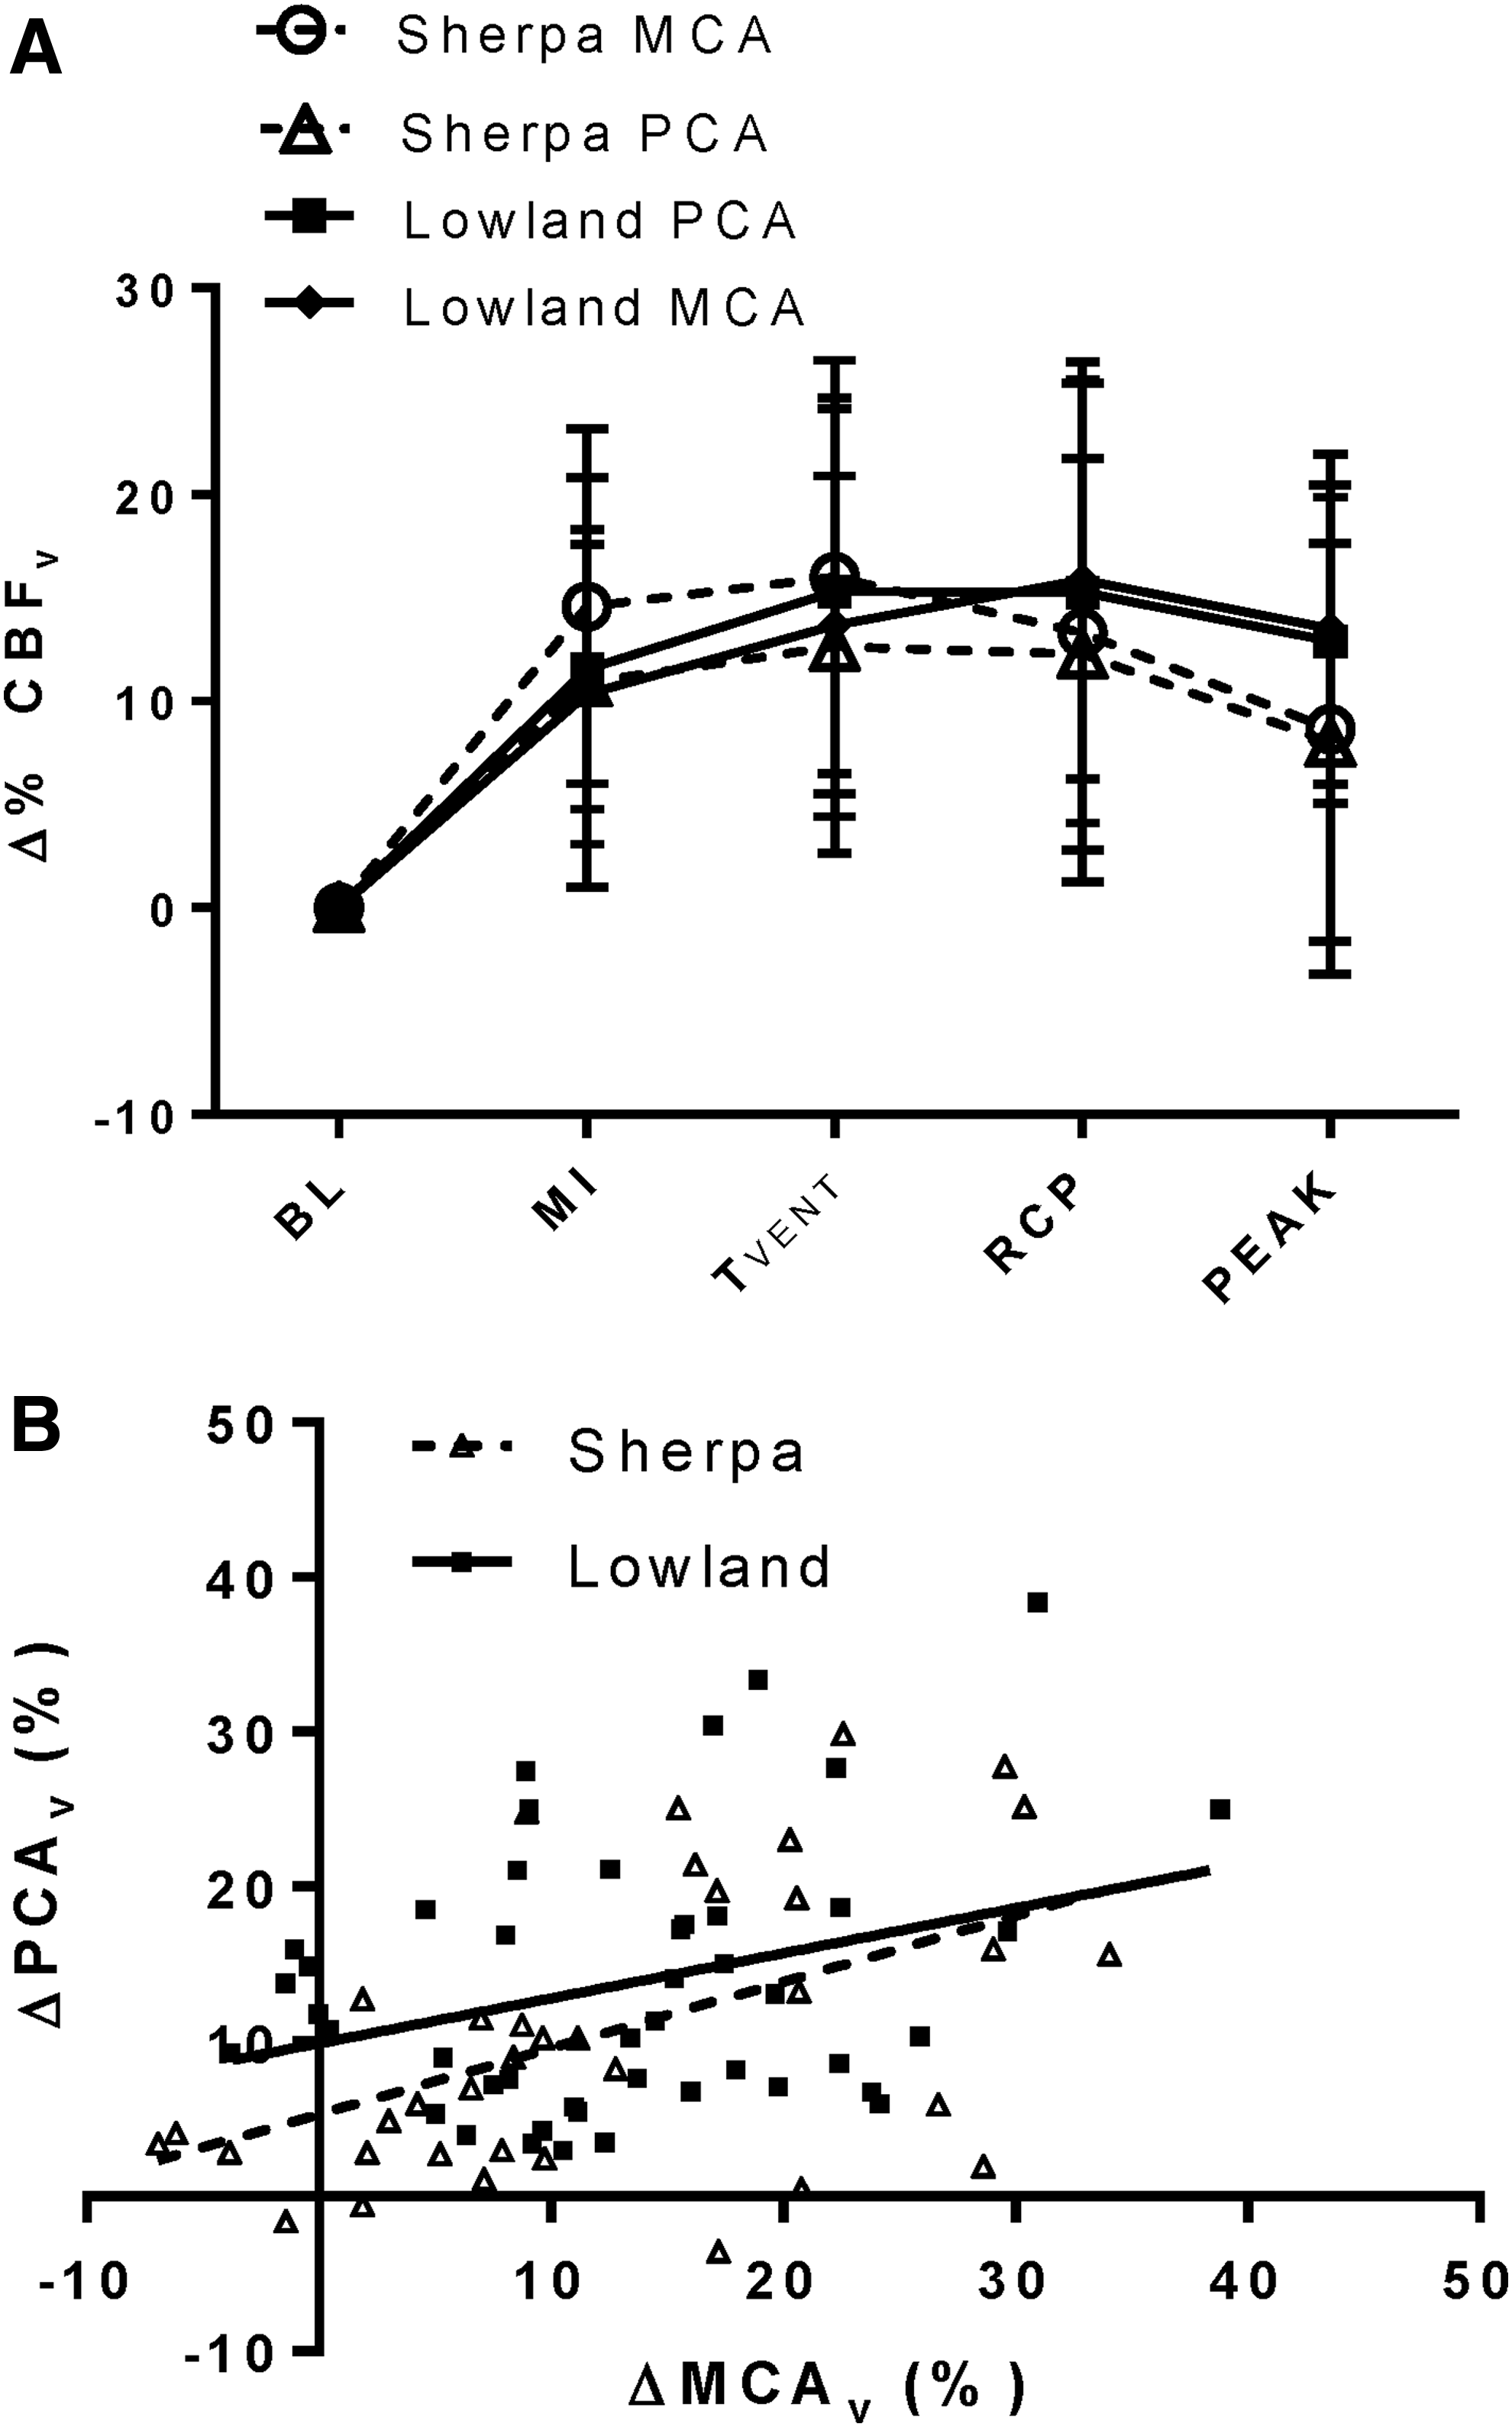
Comparison of MCAv and PCAv changes during exercise in 12 SC tested at 3800 m (SC, open symbols, dashed lines) and 12 size, sex, and maturation-matched LLC tested at 344 m (LLC, solid symbols, solid lines).
In both SC and lowlanders, CVRi in the MCA and the PCA were unchanged with increasing exercise intensity. For example, in LLC, CVRi in the MCA was 1.05 ± 0.16 mmHg/(cm·s) at BL, and 1.11 ± 0.21 mmHg/(cm·s) at peak (p = 0.62). Despite no change in CVRi with increasing intensity, CVRi was higher in both arteries in SC compared with LLC (MCA, p = 0.02; PCA, p = 0.009) at all times (MCA; SC BL, 1.39 ± 0.30; SC peak, 1.48 ± 0.41 mmHg/(cm·s). In addition, no relationship was found between ΔMAP with either the ΔMCA (LLC r2 = 0.03, p = 0.09; SC r2 = 0.003, p = 0.61) or the ΔPCA (LLC r2 = 0.08, p = 0.88; SC r2 = 0.02, p = 0.48).
Regression analysis revealed differing relationships between ΔPETCO2 and Δ%MCAv during progressive exercise in SC and LLC. A weak, but significant, positive relationship exists between ΔPETCO2 and Δ%MCAv in SC (Fig. 4; R2 = 0.13, p < 0.001), but not in LLC (R2 = 0.03, p = 0.10). In the PCA, no significant relationship was found between ΔPETCO2 and ΔPCAv in either SC or LLC (SC—R2 = 0.02, p = 0.09, LLC—R2 = 0.04, p = 0.15). In the 24 (12 Sherpa) age, sex, and size-matched participants with both MCA and PCA assessment, significant positive relationships between ΔMCAv and ΔPCAv existed in both groups (Fig. 3B); however, the slope of this relationship was unchanged with ethnicity (p = 0.61).
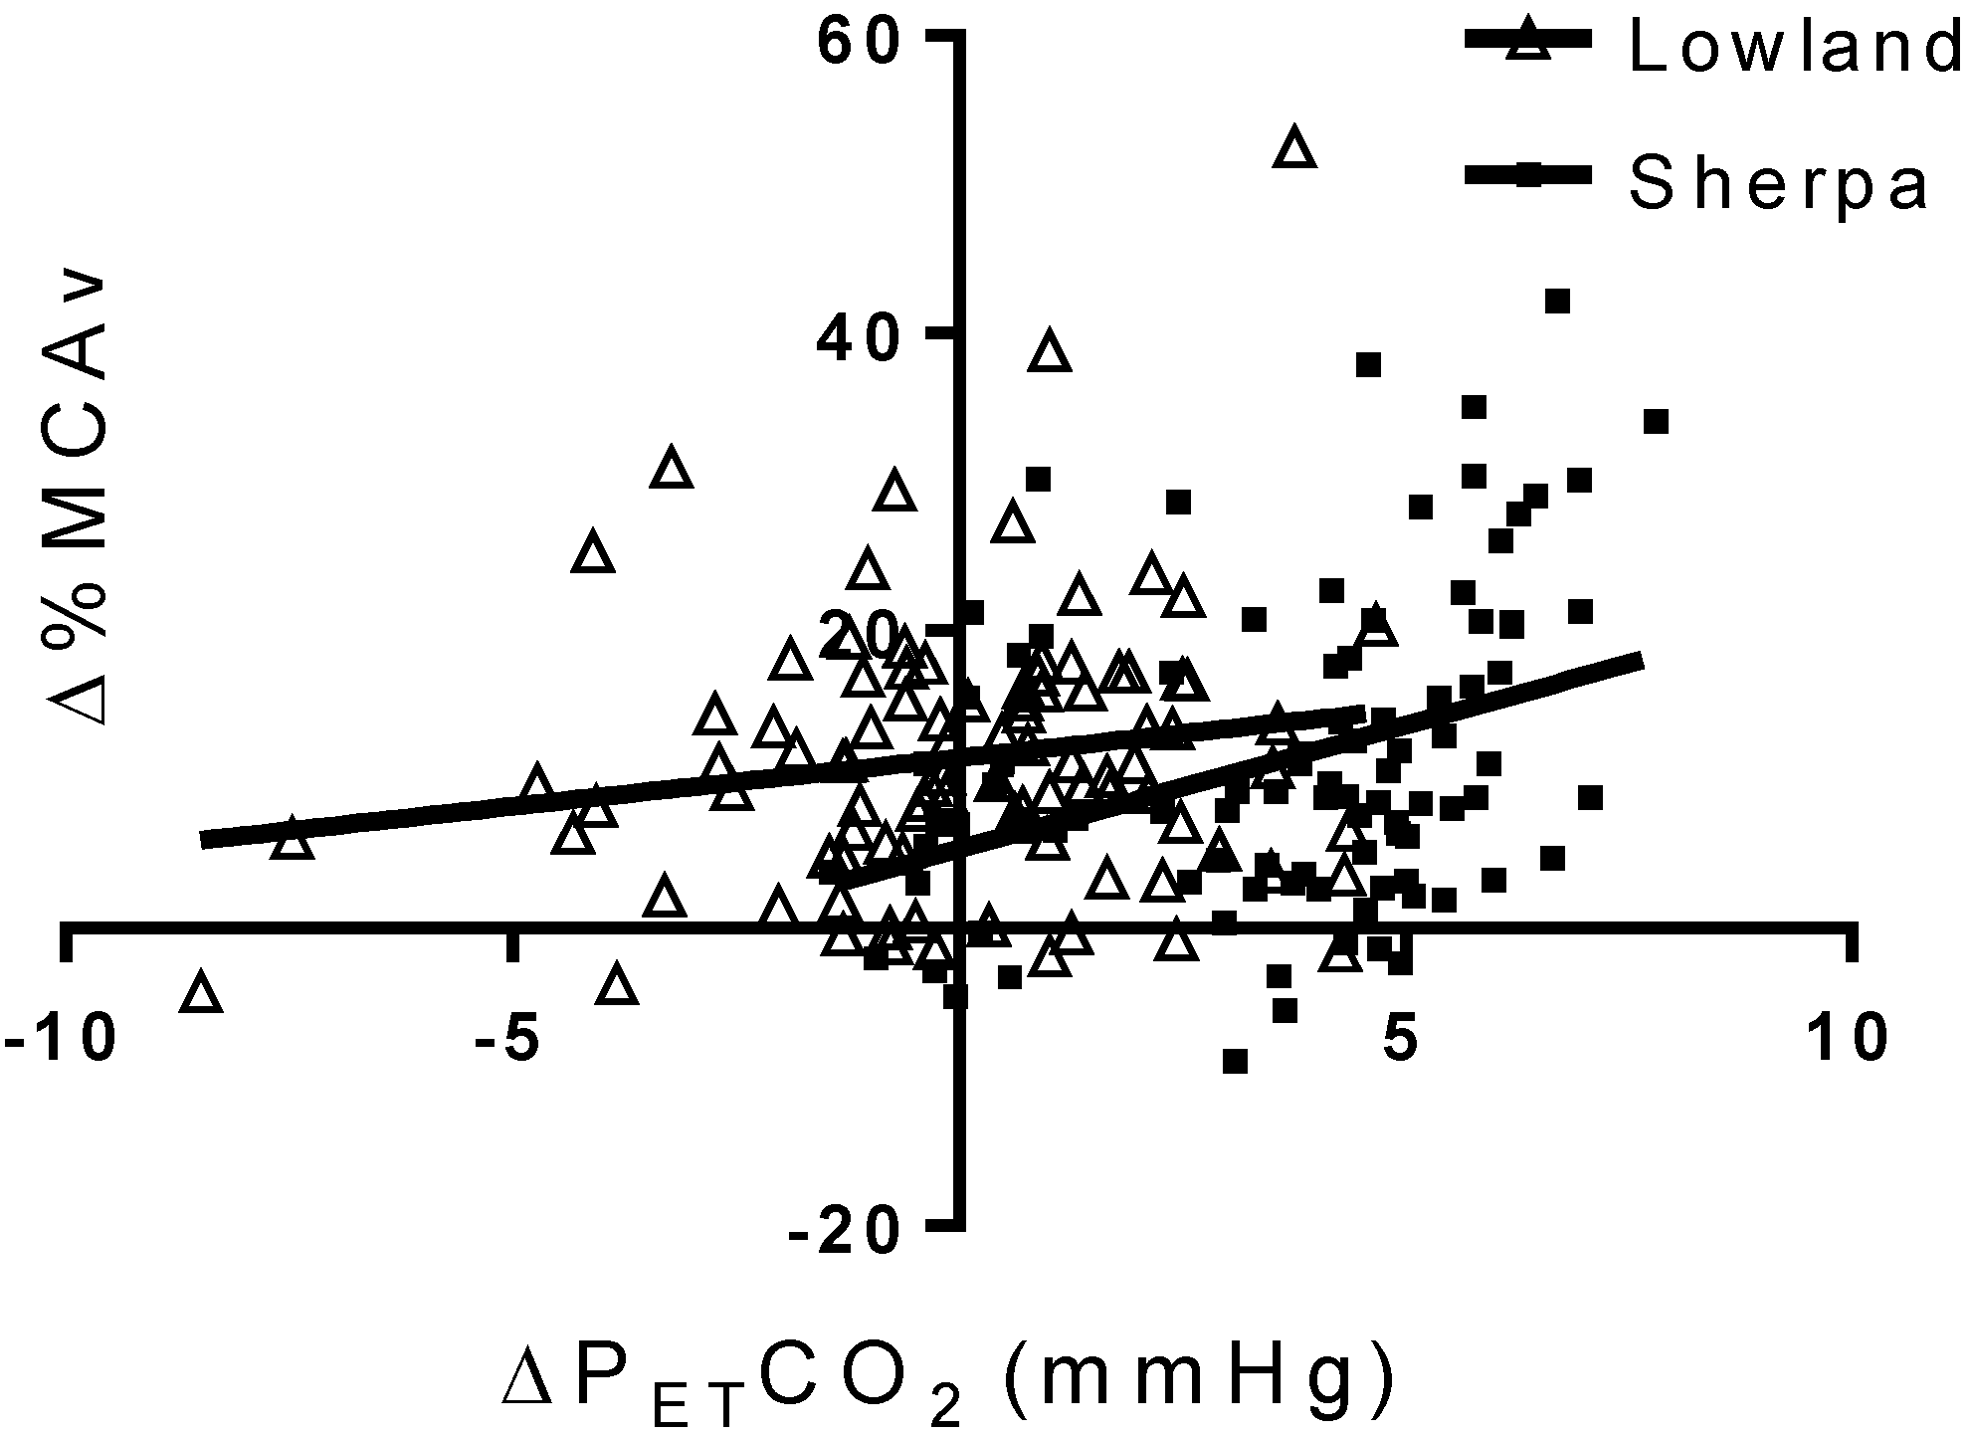
The relationship between change in ΔPETCO2 and percent change in ΔMCAv from rest to maximal exercise in 32 SC at high altitude and 32 LLC tested at low altitude. In LLC (filled squares), no linear relationship exists between ΔMCAv and ΔPETCO2 (R2 = 0.03, p = 0.10), while SC display a weak, but significant relationship between ΔMCAv and ΔPETCO2 (R2 = 0.13, p < 0.001), suggesting that in both groups changes in PETCO2 have very little influence on changes in cerebral blood flow during exercise.
Discussion
This study is the first to investigate the cerebrovascular response to exercise in Sherpa preadolescents at high altitude and provides novel insight into both the posterior and anterior cerebral circulation during exercise in healthy children at low altitude. We examined intracranial velocity in both the MCA and PCA during incremental exercise to exhaustion and found that SC had lower absolute blood velocity compared with LLC. However, the relative percent change in cerebral blood velocity was identical between the two groups at all exercise intensities. In addition, there were no regional disparities between changes in MCAv and PCAv in either population. These similarities were evident despite lower peripheral oxygenation and reduced PETCO2 in SC. Our results also indicate that changes in intracranial blood velocity during exercise in both SC and LLC occur mostly independent of changes in PETCO2.
Intracranial blood flow velocity at rest
In lowlanders traveling to high altitude, CBF at rest is initially elevated before a return toward (but not reaching) BL levels after 3–7 days. Our findings of lower MCAv and PCAv in SC at rest support previous findings of lower global CBF in Sherpa adults ([30]; and unpublished data from our research group based on n = 22 Sherpa) compared with lowland adults at similar altitudes. Likewise, these observations are also consistent with our previous study (Flück et al., 2018) where we report reductions (∼30%) in global CBF (internal carotid and vertebral arteries measured with duplex Doppler ultrasound) in SC at high altitude compared to size- and sex-matched lowlanders at low altitude. This paradoxical reduction in intracranial blood flow velocity, despite the relative arterial hypoxemia, may reflect adaptations toward a reduced cerebral metabolism. Although this latter possibility has been reported in hypoxia-tolerant animals (Hochachka, 1986), this has not been measured in children at high-altitude.
Cerebrovascular responses to exercise
During exercise, multiple active pathways contribute to the increase in CBF, which include an increase in arterial CO2 (and subsequent increase in brain tissue PCO2), an increase in cerebral metabolism, increases in arterial blood pressure, changes in neurogenic activity, and a substantial increase in cardiac output (reviewed in Smith and Ainslie, 2017). While the hypercapnic response to exercise may not be necessary for the increase in intracranial blood flow during exercise (Smith et al., 2016), compelling evidence suggests that both the partial pressure of CO2 and increases in cerebral metabolism play primary roles in regulating intensity-dependant changes in CBF (Ainslie et al., 2014; Smith et al., 2014; Willie et al., 2015). In lowland adults exercising at high altitude, the elevation in CBF during exercise is augmented compared with sea level exercise, such that cerebral O2 delivery is maintained despite arterial hypoxemia (Smith et al., 2014). While we found that absolute MCAv and PCAv were lower in SC at all exercise intensities, the percent change in velocity in both the PCA and MCA was identical between SC and LLC.
To date, only one study has investigated extracranial blood velocity during exercise in highland populations, observing a larger increase in internal carotid artery velocity in Tibetan (24%) compared with Han Chinese adults (15%) during 90-W cycling at 3568 m (Huang et al., 1987). While arterial O2 saturation was similar between groups, no measure of CO2 production or arterial PCO2 was reported, making it impossible to determine the contribution of relative hypercapnia in governing this response. In lowland adults, Smith et al. (2014) found that the increase in intracranial blood velocity during exercise was greater after acclimatization to 5050 m when comparing matched absolute submaximal exercise intensities (i.e., 60 W) at high altitude and sea level, despite a comparable cardiac output and arterial oxygen content; however, when matching for relative workload these differences were attenuated. Interestingly, in the study of Smith et al. (2014), as SaO2 was reduced near maximal exercise at high altitude, the well-documented decline in CBF following exercise-induced hypocapnia was abolished, aiding the preservation of O2 delivery to the brain. In the current study, we observed only a 3% reduction in SpO2 in SC during maximal exercise, much smaller than the 5%–15% commonly reported in lowlanders at similar altitudes, resulting in a hypocapnia-driven reduction in intracranial blood velocity at maximal workloads. Together these observations highlight the integrative role both arterial PCO2 and PO2 play in regulating blood flow to the brain in humans at high altitude.
To date, ∼20 studies have measured anterior intracranial blood flow velocity during exhaustive exercise in adults, reporting significant increases in MCAv ranging from 20% to 80% (reviewed in Tymko et al., 2018). Recent findings from our laboratory have demonstrated a reduced cerebrovascular response to exercise in children compared with that reported in adults (Ellis et al., 2017), and this is confirmed by our current observation of peak increases of MCAv and PCAv of 10%–15% in SC and LLC. In adults, a strong positive relationship between ΔPETCO2 and ΔMCAv has been reported (Ellis et al., 2018). In contrast, this relationship was not observed in our previous work in children, suggesting that cerebral reactivity to CO2 during exercise may follow a developmental trajectory. Our current findings also observed the absence of a relationship between ΔPETCO2 with ΔMCAv or ΔPCAv in LLC. Nevertheless, we did observe a weak but significant relationship between ΔPETCO2 and ΔMCAv (but not PCAv) in SC. This disparate result between SC and LLC may reflect differences in buffering capacity and diminished [HCO3−] in SC, which could exaggerate changes in pH of the cerebrospinal fluid during exercise. These observations may also be attributed to differences in the pattern of the response of PETCO2 to incremental exercise in SC and LLC. For example, SC tended to increase PETCO2 during progressive exercise, whereas PETCO2 was maintained in LLC until the RCP, where PETCO2 fell significantly below BL. Although the reasons for these differences are unknown, during the early exercise stages, the SC tended to increase breathing frequency to a greater extent than LLC, which may have increased dead space ventilation and PETCO2. A similar increase in intracranial blood flow velocity despite different relative PETCO2 changes between SC and LLC suggests that in children, the intracranial blood flow velocity response to exercise may only be minimally influenced by arterial PCO2.
Regional differences
Measurement of blood velocity in both the PCA and the MCA allowed for investigation of changes in flow in the posterior and anterior regions of the brain, respectively. Hypoxia is often reported to have a larger influence on the posterior cerebral circulation compared to the anterior, likely owing to the increased demand of the brainstem when governing large changes in ventilation (Willie et al., 2012, 2015, 2016). In contrast, at least in adults, mixed reports have emerged when investigating regional cerebrovascular responses to normoxic exercise (reviewed in Smith and Ainslie, 2017; Tymko et al., 2018).
Our findings of similar relative changes in MCAv and PCAv in children are consistent with similar studies performed in adults (Smith et al., 2012, 2014). However, to the best of our knowledge, the relative contribution of hypoxic vasodilation and hypocapnic vasoconstriction in SC at high altitude has not been investigated. Interestingly, Smith et al. observed a strong positive correlation between ΔMCAv and ΔPCAv during normoxia (Hoiland et al., 2015), but a weak inverse correlation between ΔMCAv and ΔPCAv in the same adult subjects exercising during acute poikilocapnic hypoxia. In LLC, we also report a positive correlation between ΔMCAv and ΔPCA; however, in contrast to Smith et al., a positive relationship between the two arteries is also demonstrated in SC at high altitude. Whether this difference is a response to acclimatization to hypoxia or genetic adaptation of the Sherpa is unclear. While speculative, it is possible that all children have reduced sensitivity to changes in arterial PCO2 compared to adults, which may influence regional cerebrovascular responses during exercise.
Respiratory responses
Sherpa adults exhibit numerous adaptations to facilitate exercise performance and oxygen utilization in high altitude environments. Little is known about the extent to which these adaptations are present in children. Despite having relatively lower hemoglobin concentrations compared to other adapted populations at the same altitudes (Curran et al., 1997; Beall et al., 1998; Beall, 2007), Tibetan adults have larger lungs with higher diffusion capacities, as well as reduced alveolar–arterial O2 gradients at rest and during exercise (Sun et al., 1990; Droma et al., 1991; Zhuang et al., 1996; Wu and Kayser, 2006).
Numerous studies have also reported that Tibetan and Sherpa adults have reduced submaximal and maximal exercise ventilation compared wiyh non-native highlanders and acclimatized lowlanders (Ge et al., 1995; Curran et al., 1998; Faoro et al., 2014). Tibetan children have higher VT than Han Chinese at the same altitude (75.9 vs. 61.9 mL/kg), as well as decreased VE/VO2 during maximal exercise (Chen et al., 1997), suggesting better ventilatory efficiency. In contrast to these reports, we found that VE/VO2 was 5%–13% higher in SC at rest and during exercise. Based on the likelihood of reductions in VO2 paired with increases in VE in LLC exercising at comparable intensities at high altitude, we can therefore speculate that ventilatory efficiency was likely preserved or improved in SC when accounting for reductions in oxygen availability.
Maximal exercise
At an altitude of 3800 m, we would expect sizeable reductions in peak VO2. As expected, aerobic capacity was lower in SC when compared to LLC. Of note, however, the ∼14% reduction in loglinear-adjusted peak VO2 we observed was much lower than the approximately 20%–25% reduction anticipated at similar altitudes in lowlanders (Klausen et al., 1966; Ferretti et al., 1997). It should be noted that bicycles are extremely rare in the Khumbu Valley, owing to rugged terrain inhospitable to wheeled locomotion. In a previous study, exercise capacity was assessed in Tibetan children, covariate analysis revealed that the trait of “not owning a bicycle” accounted for a 3%–6% reduction in peak wattage achieved (Bianba et al., 2014). We speculate that this likely played a role in our study, given that in all but one participant this was the first time cycling. During cycling exercise, the submaximal power-VO2 relationship (W/VO2) was lower in SC, suggesting reduced work efficiency, despite previous reports of a preserved W/VO2 relationship in lowlanders exercising at under hypoxic conditions (Ekblom et al., 1975). In addition, relative to body weight, peak power output was 25% less in SC than LLC.
Future directions
Fundamental biophysiological differences exist when comparing low altitude populations tested at sea level to highland populations at high altitude. Central and peripheral chemosensitivity is altered with exposure to high altitude, and cerebrovascular responses to changes in arterial blood gases vary based on ventilatory acclimatization, as well as the degree of respiratory alkalosis and metabolic acidosis observed within the individual (Ainslie and Subudhi, 2014). To better understand genetic adaptation to high altitude in SC, it would be necessary to compare cardiorespiratory and cerebrovascular responses to a well-acclimatized non-native population. Unfortunately, these data currently do not exist. In addition, measurements of arterial blood gasses, blood pH, and [HCO3−] would provide valuable insight into the role of acid-base status and buffering capacity on ventilatory and vascular responses to high altitude in children. Measures of global CBF and metabolism during exercise in children would also provide a better understanding of the mechanisms responsible for driving changes in intracranial blood velocity commonly observed.
Strengths and limitations
While providing the first description of cerebrovascular responses to exercise in high-altitude native children, the current study design allows for only a limited interpretation of unique exercise responses when comparing to lowlanders. Differences in arterial pH or PaCO2 in SC at high altitude may exacerbate changes in arterial and cerebrospinal fluid pH during exercise, and hypoxia independently influences the cardiorespiratory responses to exercise, making it difficult to separate physiological and environmental responses. This further highlights the need for future investigation of exercise responses of nonadapted populations at high altitude.
Size differences make it difficult to interpret changes in ventilatory parameters, and the choice of scaling approach to account for differences in body size influences data interpretation. Using a ratio standard (dividing the physiological variable of interest by bodyweight) disproportionally favors those with low body mass. We therefore chose to use a loglinear model to account for difference in body-size. In addition, the SC were older than the lowlanders; however, by matching for maturation using aPHV, we were able to study developmentally comparable groups.
Any interpretation of TCD-derived indices of intracranial blood flow must be cautioned given potential changes in vessel diameter. In adults, MCA diameter is stable within the ranges of +7.5 and −7.5 mmHg ΔPETCO2, beyond which arterial dilation or constriction occurs. Although the ranges of PETCO2 during exercise in our study were within these, hypoxia per se is a vasodilator. If BL diameter was greater at high altitude, the same percent change in velocity would underestimate the rise in intracranial blood flow. Flück et al. (2018) report similar internal carotid and vertebral artery diameters in SC at high altitude compared with size-matched lowlanders at low altitude. Although it is unknown whether these observations can be extrapolated to resting diameter in the MCA and PCA, it would seem reasonable given the similar relative reductions in global CBF (Flück et al., 2018). In addition, while a small gradient exists between PETCO2 and PaCO2 in adults, this gradient is smaller in children, and even further reduced with exercise (Ohuchi et al., 1999), allowing us to confidently infer the direction and relative magnitude of the contribution of pH on changes in intracranial blood velocity.
Due to time constraints, we were not able to supramaximally verify maximal effort in the children. Peak HR was ∼10 bpm lower in the SC, however, this may have been a consequence of parasympathetic restriction on maximum HR at high altitude (Zhuang et al., 1993; Boushel et al., 2001). Indeed, it is possible that some of the SC, who had limited or no experience on a cycle ergometer may not have reached a true cardiovascular maximum. We were also unable to calibrate the cycle ergometer after transportation to high altitude, however, using submaximal anchor points of VT and RCP allowed us to make intensity-specific, wattage-independent comparisons between populations at all points before and including VO2 peak.
Conclusion
SC residing at high altitude and LLC at low altitude have similar cerebrovascular responses to exercise, indexed by changes in MCAv and PCAv. Despite a larger relative increase in PETCO2 during exercise in SC, poor correlation with ΔPETCO2 and ΔCBF in both groups of children suggest that intracranial sensitivity to changes in PETCO2 during exercise is limited, in contrast to adults who have previously demonstrated strong correlational relationships between PETCO2 and CBF during exercise. Further investigation into cerebrovascular exercise responses during acute and chronic hypoxic exposure in LLC is needed, as well as exploration into the independent roles of hypoxia and arterial PCO2 on regulating these responses.
Footnotes
Acknowledgments
This study was performed within the framework of the UBC International Research Expedition to Nepal. We are grateful to all the families who participated in this study, as well as Audrey Kirby and Nima Sherpa for their valuable contributions to the project. This research was supported by a National Sciences and Engineering Research Council Discovery Grant (2015–03647, A.M.M.; 20150821–01, P.N.A.), Canadian Research Chair in Cerebrovascular Physiology (950–230970; P.N.A.), and the Swiss National Science Foundation (P2ZHP3_158576; D.N.-F.).
Authors' Contributions
M.G.R., D.N.-F., P.N.A., and A.M.M. contributed to the study design; M.G.R., L.E.M., D.N.-F., S.N., C.M.T., and A.M.M. performed experiments. M.G.R., L.E.M., and C.M.T. analyzed data; M.G.R., D.N.-F., P.N.A., and A.M.M. interpreted results; M.G.R. and A.M.M. drafted the article; M.G.R. prepared figures; M.G.R., L.E.M., D.N.-F., S.N., C.M.T., M.S., P.N.A., and A.M.M. edited and revised the article. All authors approved the final version of the article.
Author Disclosure Statement
No conflicts of interest, financial or otherwise, are declared by the authors.