
Abstract
Abstract
Background:
The physiological effects of hypoxia may be influenced by how hypoxia is achieved. The purpose of this study was to determine the effects of recovery in hypobaric hypoxia (HH), normobaric hypoxia (NH), and normobaric normoxia (NN) after endurance exercise on gene expression related to mitochondrial biogenesis, myogenesis, and proteolysis.
Methods:
Fifteen recreationally trained subjects each cycled for 1 hour before recovering for 4 hours in NN (laboratory atmospheric conditions, 975 m), HH (depressurized to simulate 4420 m), and NH (fraction of O2 reduced to simulate 4420 m). Muscle biopsy samples were obtained before exercise and after 4 hours of recovery.
Results:
Blood oxygenation
Conclusion:
TFAM mRNA is lower with hypoxia exposure, but effected by the type of hypoxia. MSTN gene expression is lower after exposure to HH than NH or NN. These data support previous work and caution the translation of NH data obtained in a NH environment to a HH environment.
Introduction
The environmental conditions, in which recovery takes place after exercise, may have implications on the cellular and physiological outcomes of that exercise bout. Previous researches from our laboratory have investigated a number of skeletal muscle responses following recovery from endurance exercise in environmental temperatures (Slivka et al., 2012; Zak et al., 2017), local temperature application (Tucker et al., 2012), and normobaric hypoxia (NH) environments (Slivka et al., 2014). However, achieving hypoxia through a lowered oxygen fraction such as in NH may be physiologically different from terrestrial high altitude or hypobaric hypoxia (HH) where oxygen fraction remains constant, but barometric pressure is lower.
Limited research has directly compared these different hypoxia modalities and a complete understanding is lacking. The research that does exist tends to indicate that HH is a more severe form of hypoxia than NH. Blood oxygen saturation (SaO2) appears to be lower at rest in HH compared with NH (Evetts et al., 2005; Boos et al., 2016) and further be altered after exercise along with other measures of cardiac adaptations (Boos et al., 2016). The differences in the physiological responses to HH and NH hypoxia appear to translate into applied effects. For example, cycling time trial performance is impacted more during exposure to HH than NH, despite similar blood oxygen saturation (SaO2) and cardioventilatory parameters (Beidleman et al., 2014), and symptoms of acute mountain sickness have been reported to be higher with HH than with NH (DiPasquale, 2016). Furthermore, 1 week of NH sleep acclimation does not appear to translate into benefits in a HH environment (Fulco et al., 2011). While the effect of HH and NH on the cardiovascular system and performance is beginning to emerge, there is a lack of detail on the effects on the skeletal muscle.
One such effect on the skeletal muscle that is of interest in relationship to hypoxia is the production of mitochondria. Mitochondrial biogenesis occurs with cellular stress such as endurance exercise (Irrcher et al., 2003; Wright et al., 2007). However, hypoxic stress has demonstrated decrements in mitochondrial development (Ferretti, 1990; Hoppeler et al., 1990; Howald et al., 1990; Kayser et al., 1991). Previous evidence suggests that no differences occur in mitochondrial-related gene expression (COX, PGC-1, FIS-1, MFN-1, and OPA-1) between NH recovery compared with normobaric normoxia (NN) recovery from endurance exercise (Slivka et al., 2014). However, this study design did not compare these responses to a HH recovery environment. Therefore, it is currently unknown if HH recovery from exercise would regulate mitochondrial mRNA differently from NH or NN recovery.
Hypoxic conditions lead to specific signaling events with functional significance in skeletal muscle (Hoppeler et al., 2008). Hypoxia activates proteolytic regulator genes such as FOXO3 to initiate cell death (Bakker et al., 2007; de Theije et al., 2013). Yet, there exists research that refutes the role of hypoxia in the activation of proteolysis (Favier et al., 2010; Manimmanakorn et al., 2013). Contradiction similarly exists on hypoxia's role in the regulation of myogenesis. Acute hypoxia exposure impairs myoblast differentiation and attenuates myofiber development (Di Carlo et al., 2004; Yun et al., 2005; Chaillou et al., 2014). However, additional literature suggests that exercise in hypoxic conditions improves myogenic activity by promoting muscle growth and repair in humans (Manimmanakorn et al., 2013). The differences in muscle mass regulating genes between HH and NH exposure have not been established and may aid in the interpretation of previous research as the method of achieving hypoxia is not consistent between studies.
The purpose of this study was to determine the response of key genes related to mitochondrial biogenesis and muscle mass regulation during HH, NH, and NN recovery after exercise. Determining the cellular responses of the skeletal muscle in HH and NH methods of achieving hypoxia will enhance the current literature and advance the understanding of hypoxia's effects on mitochondrial development and skeletal muscle mass regulation in addition to the interchangeability of NH and HH.
Materials and Methods
Subjects
Eight recreationally trained male and seven recreationally trained female subjects who engaged in endurance training for at least 30 minutes three times per week participated in this study. They were required to be between the ages of 18 and 40 years and have a VO2peak of at least 45 mL/(kg · min). Those who previously experienced serious acute mountain sickness, or had a known risk factor for coronary artery disease assessed through a physical activity readiness questionnaire, were excluded from the study. Furthermore, female participants taking birth control influencing hormonal status or those who did not have a regular menstrual cycle in the past 8 months were excluded. Subjects signed the Institutional Review Board and USAMRMC Human Research Protections Office-approved informed consent form, which conformed to the Declaration of Helsinki, before testing.
Preliminary testing
Descriptive data included height (Seca 213 Statiometer; United Kingdom), weight (Befour PS-660 ST Digital Scale; Saukville, WI), body composition, and VO2peak. Body composition for each subject was assessed through hydrostatic weighing using an electronic load cell-based system (Exertech, Dresbach, MN) correcting for estimated residual lung volume. Body density from this underwater weight was converted to percent body fat using the Siri equation (Siri, 1993). Peak oxygen uptake (VO2peak) was obtained for each participant using a graded exercise protocol starting at 95 W and increasing by 35 W every 3 minutes on an electronically braked Velotron, cycle ergometer (RacerMate, Seattle, WA). Cycling continued until volitional fatigue, and the highest obtained oxygen uptake value was considered the VO2peak. Maximum workload (Wmax) was calculated by taking the time completed in the last stage divided by the total stage duration (3 minutes) multiplied by 35 W and added to the watts of the last completed stage. Expired gases were analyzed every 15 seconds throughout the exercise test using a flow and gas calibrated metabolic cart (ParvoMedics TrueOne 2400; Sandy, UT).
Experimental protocol
All subjects completed three trials in a randomized, counter-balanced order. Each trial was separated by ∼7 days to allow for biopsy recovery and to minimize carryover acclimation between trials. Subjects reported to the laboratory in the early morning following an overnight fast. Subjects maintained a 24 hours dietary and 48 hours activity log before the first trial and replicated these for the subsequent trials. The exercise trial consisted of a 60-minutes bicycle ride on a cycle ergometer at a constant intensity of 70% of their power associated with VO2peak in ambient conditions (975 m laboratory environment). Each subject drank water ad libitum during the first ride, and the amount was replicated for all subsequent trials. Following cessation of exercise, 4 hours of passive recovery occurred inside a small (32′′ × 7′) tube shaped altitude chamber (Engineering Innovations, LLC, Littleton, CO) capable of lowering barometric pressure to simulate HH. This tube was located inside of an oxygen-controlled environmental chamber (Tescor, Warminster, PA) capable of lowering the fraction of oxygen in the air to simulate NH. They received one short break after 2 hours of recovery. The experimental recovery conditions were simulated to the following altitudes:
NN; 975 m (3200′) Atmospheric conditions by having both the hypobaric tube and oxygen controlled chamber off so that participants breathed ambient air. HH; 4420 m (14,500′) HH by having the hypobaric tube depressurized altering the barometric pressure, while the oxygen-controlled chamber was set to off. NH; 4420 m (14,500′) NH by having the hypobaric tube off and the oxygen controlled chamber on.
Oxygenation saturation and heart rate
Blood oxygen saturation (SpO2) and heart rates were measured using a finger pulse oximeter (Nonin WristOx2 3150; Plymouth, MN) during exercise and again every 60 minutes during passive recovery. Oxygen saturation and heart rates were recorded on the hour by having the device placed on the finger and allowed to stabilize for ∼30 seconds.
Biopsies
Muscle biopsies were taken from the vastus lateralis before exercise and after 4 hours of recovery in each trial. The second muscle biopsy was extracted from a separate incision ∼2 cm proximal to the preexercise biopsy. Each sample was extracted using a 5 mm Bergstrom percutaneous biopsy needle with the aid of suction. The leg was chosen in a random, counter-balanced order. After cleaning the site, ∼3–4 mL of 1% lidocaine was injected under the skin surface and around the muscle fascia before a small incision through the skin and muscle fascia was made. Once the muscle tissue had been obtained, the sample was quickly cleaned of excessive blood, connective tissue, and fat before being placed in Allprotect (Qiagen, Hilden, North Rhine-Westphalia, Germany). Samples were placed overnight at 4°C and then transferred to −30°C for storage. All subsequent trials repeated this process by alternating legs.
Muscle sample preparation and quantitative reverse transcription-polymerase chain reaction
A piece of skeletal muscle (11.5 ± 1.7 mg) was homogenized in 500 μL of TRIzol (Invitrogen, Carlsbad, CA) using an electric blender homogenizer (Bullet Blender; Next Advance, Inc., Averill Park, NY) utilizing 1.5 mL Red RINO tubes prefilled with RNase-free ceramic beads (Next Advance, Inc.). The samples were centrifuged at 12,000 g for 15 minutes, and the aqueous phase was then transferred to a fresh 1.5 mL tube and incubated overnight at −20°C. Samples were centrifuged the next morning, and the supernatant was removed. Ethanol was added followed by a 5 minutes centrifugation at 7500 g. The ethanol was then removed, the pellet dried, and then redissolved in 30 μL of RNase-free water. RNA concentration was quantified using a nano-spectrophotometer (nanoDrop ND-2000; Thermo Scientific, Wilmington, DE). Average RNA yields were 165.9 ± 12.1 ng/μL. The average absorbance ratio at 260:280 was 1.90 ± 0.00 indicating high purity of the RNA. The RNA integrity of the samples were assessed using an Agilent RNA 6000 Kit and a 2100 Bioanalyzer (both from Agilent Technologies, Santa Clara, CA) according to manufacturer's instructions. The RNA integrity number was 8.0 ± 0.1, indicating that the RNA was intact.
First-strand cDNA synthesis was achieved using the Superscript IV first-strand synthesis system for RT-PCR Kit (Invitrogen) according to manufacturer's instruction. The resulting cDNA was diluted with the appropriate amount of RNase-free water to achieve a final cDNA concentration of 0.5 μg/μL in the PCR reaction. Each 10 μL quantitative reverse transcription-polymerase chain reaction (qRT-PCR) volume contained 0.5 μL of probe and primer mix (PrimeTime qPCR assay Integrated DNA Technologies, Coralville, IA), 5 μL qPCR Master Mix (Integrated DNA Technologies), and 4.5 μL of sample cDNA. PCR was run in triplicate on a Stratagene mx3005p PCR system (Agilent Technologies) using a two-step protocol (1 cycle at 95°C for 5 seconds followed by 60°C for 20 seconds for 50 cycles).
Mitochondrial biogenesis-related genes included peroxisome proliferator-activated receptor gamma coactivator 1-alpha (PGC-1α), estrogen-related receptor alpha (ERRα), GA-binding protein alpha (GABPA), nuclear respiratory factor 1 (NRF-1), and mitochondrial transcription factor A (TFAM). The myogenic genes of interest involved in muscle hypertrophy are myogenic differentiation factor (MYOD), myostatin (MSTN), myogenin (MYOG), myogenic factor 5 (MYF-5), and myogenic factor 6 (MYF-6). Proteolytic genes of interest involved in muscle atrophy are forkhead box O3 (FOXO3), atrogin-1, and muscle ring finger 1 (MuRF-1).
Quantification of mRNA for genes of interest was completed using the 2−ΔΔCT method (Livak and Schmittgen, 2001). For each participant, the geometric mean of five housekeeping genes beta-actin (ACTB), beta-2-microglobulin (B2M), cyclophilin (CYC), ribosomal protein S18 (RPS-18), and glyceraldehyde-3 phosphate dehydrogenase (GAPDH) was used as the stable reference point. This combination of genes was determined to be stable using NormFinder software (Andersen et al., 2004). Probe and primer sequences used for qRT-PCR are presented in Table 1.
Probes and Primers Used for Real-Time Polymerase Chain Reaction
PGC-1α, peroxisome proliferator-activated receptor gamma coactivator 1-alpha; ERRα, estrogen-related receptor alpha; GABPA, GA-binding protein alpha; NRF-1, nuclear respiratory factor 1; TFAM, mitochondrial transcription factor A; MYOD, myogenic differentiation factor; MSTN, myostatin; MYOG, myogenin; MYF-5, myogenic factor 5; MYF-6, myogenic factor 6; FOXO3, forkhead box O3; MuRF-1, muscle ring finger 1; ACTB, beta-actin; B2M, beta-2-microglobulin; CYC, cyclophilin; RPS-18, ribosomal protein S18; GAPDH, glyceraldehyde-3 phosphate dehydrogenase.
Statistical analysis
Differences in gene expression among HH, NH, and NN condition trials were analyzed using two-way (time × trial) repeated-measures analysis of variances (ANOVAs). In the event of a significant F-ratio, Fisher's protected least significant difference method was applied to determine where differences occurred. All ANOVAs were performed using the Statistical Package for Social Sciences software (SPSS) for Windows Version 23.0 (Chicago, IL). A probability of <5% was considered significant (p < 0.05). For all significant comparisons, effect size (η2 for ANOVA and Cohen's d for individual comparisons) was calculated. All data are reported as mean ± standard error.
Results
Participant descriptive data
Eight recreationally trained male and seven recreationally trained female participants (n = 15) completed this study. Male subjects were taller (p < 0.001, d = 2.643), weighed more (p = 0.028, d = 1.378), had a lower percent body fat (p = 0.003, d = 2.063), VO2peak (p = 0.001, d = 2.512), and a higher cycling workload at VO2peak (p < 0.001, d = 3.440) than female subjects. After initial analysis, there were no differences in any other of our dependent variables between males and females (p < 0.05) which is supported by previous research indicating that men and women have similar cardiopulmonary responses after acute hypoxia exposure (Boos et al., 2016). Therefore, male and female subjects were pooled together for further analysis. Descriptive data are presented in Table 2.
Participant Descriptive Data
Data are means ± SE.
p < 0.05 males different from females.
SE, standard error.
Oxygen saturation and heart rate
No differences in SpO2 occurred between trials at baseline, during exercise, or immediately postexercise (p > 0.05, average d = 0.250) as no experimental interventions had been introduced at these time-points. During each hour of recovery, arterial oxygen saturation in NN was higher than both HH (p < 0.001, average d = 6.546) and NH (p < 0.001, average d = 5.662). Furthermore, oxygen saturation was lower in HH compared to NH at hours 1 (p = 0.004, d = 1.059), 3 (p = 0.032, d = 0.772), and 4 (p = 0.008, d = 0.886). No differences were observed at hour 2 (p = 0.293, d = 0.343) between HH and NH. Oxygen saturation data are presented in Figure 1.
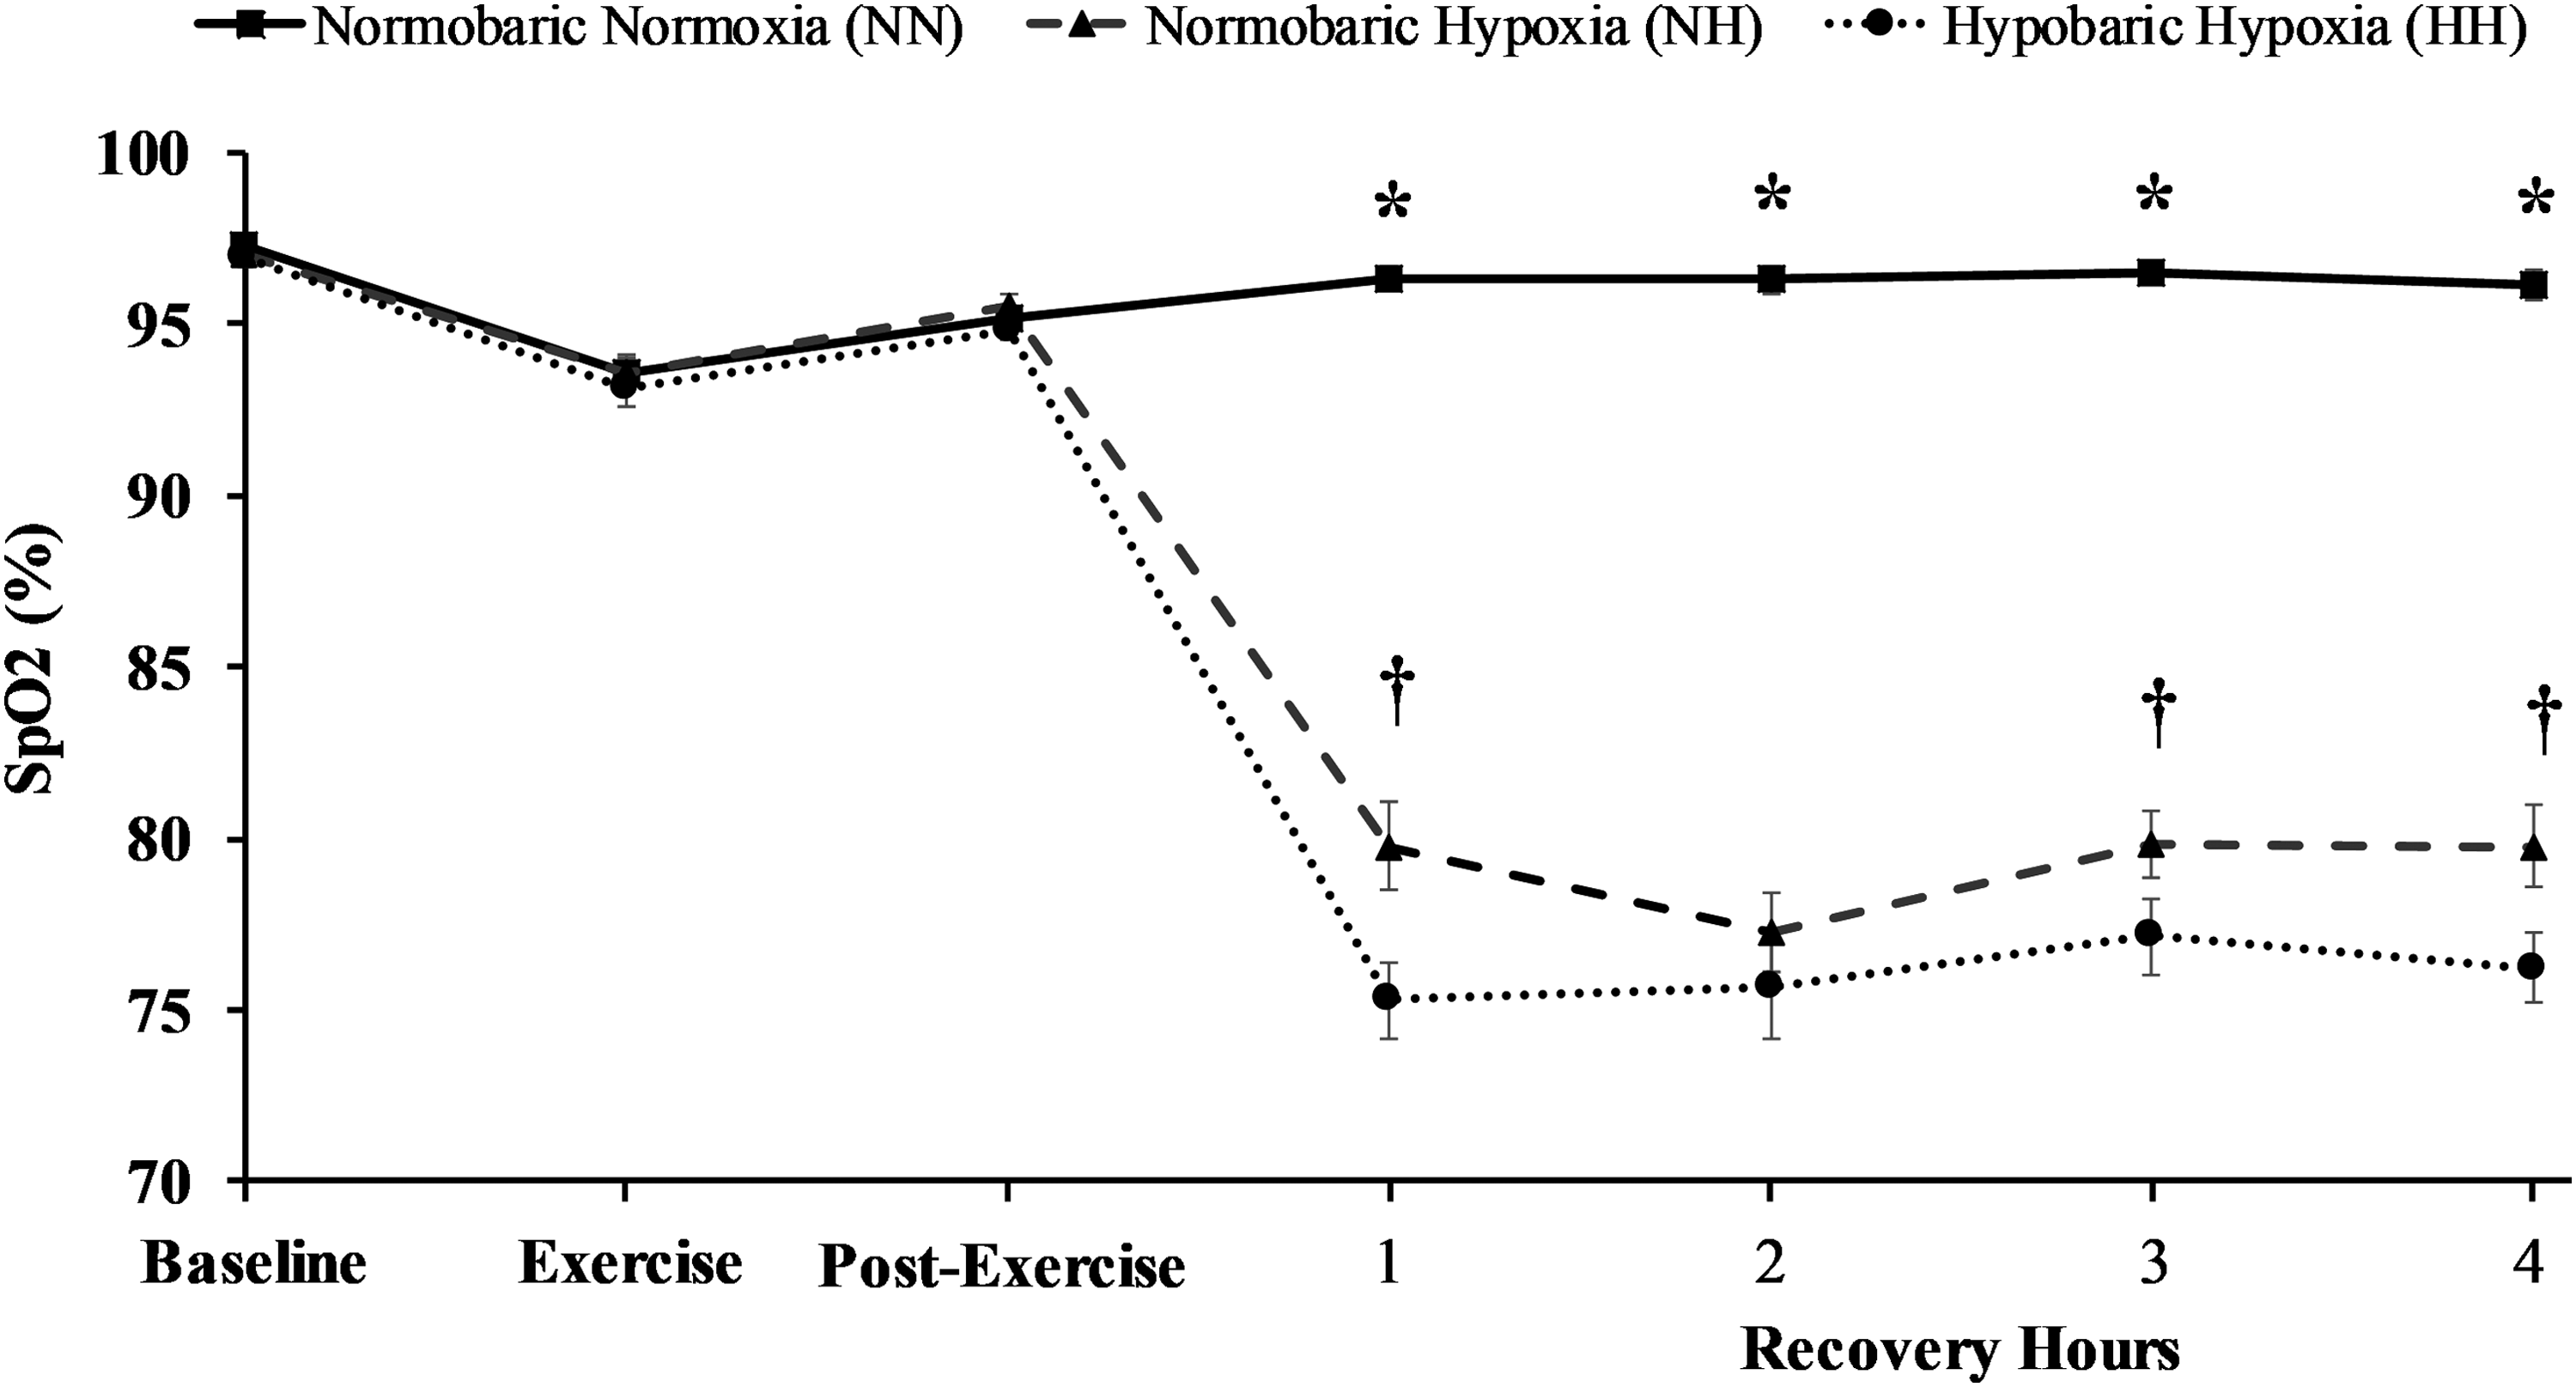
Oxygen saturation between trials at baseline, during exercise, immediately post-exercise and each hour of recovery. *p < 0.05 NN from NH and HH, †p < 0.05 NH from HH. NN, normobaric normoxic; NH, normobaric hypoxic; HH, hypobaric hypoxia.
No differences occurred in heart rate between trials (p > 0.05, average d = 0.200) at baseline, exercise, or immediately postexercise, as no experimental intervention had been introduced at these time points. Heart rate in the NN condition was lower than HH (p < 0.001, average d = 1.427) and NH (p < 0.05, average d = 1.005). Furthermore, heart rate was lower in NH compared with HH at recovery hours 2 (p = 0.020, d = 0.586), 3 (p = 0.029, d = 0.517), and 4 (p = 0.041, d = 0.525). Heart rate data are presented in Figure 2.
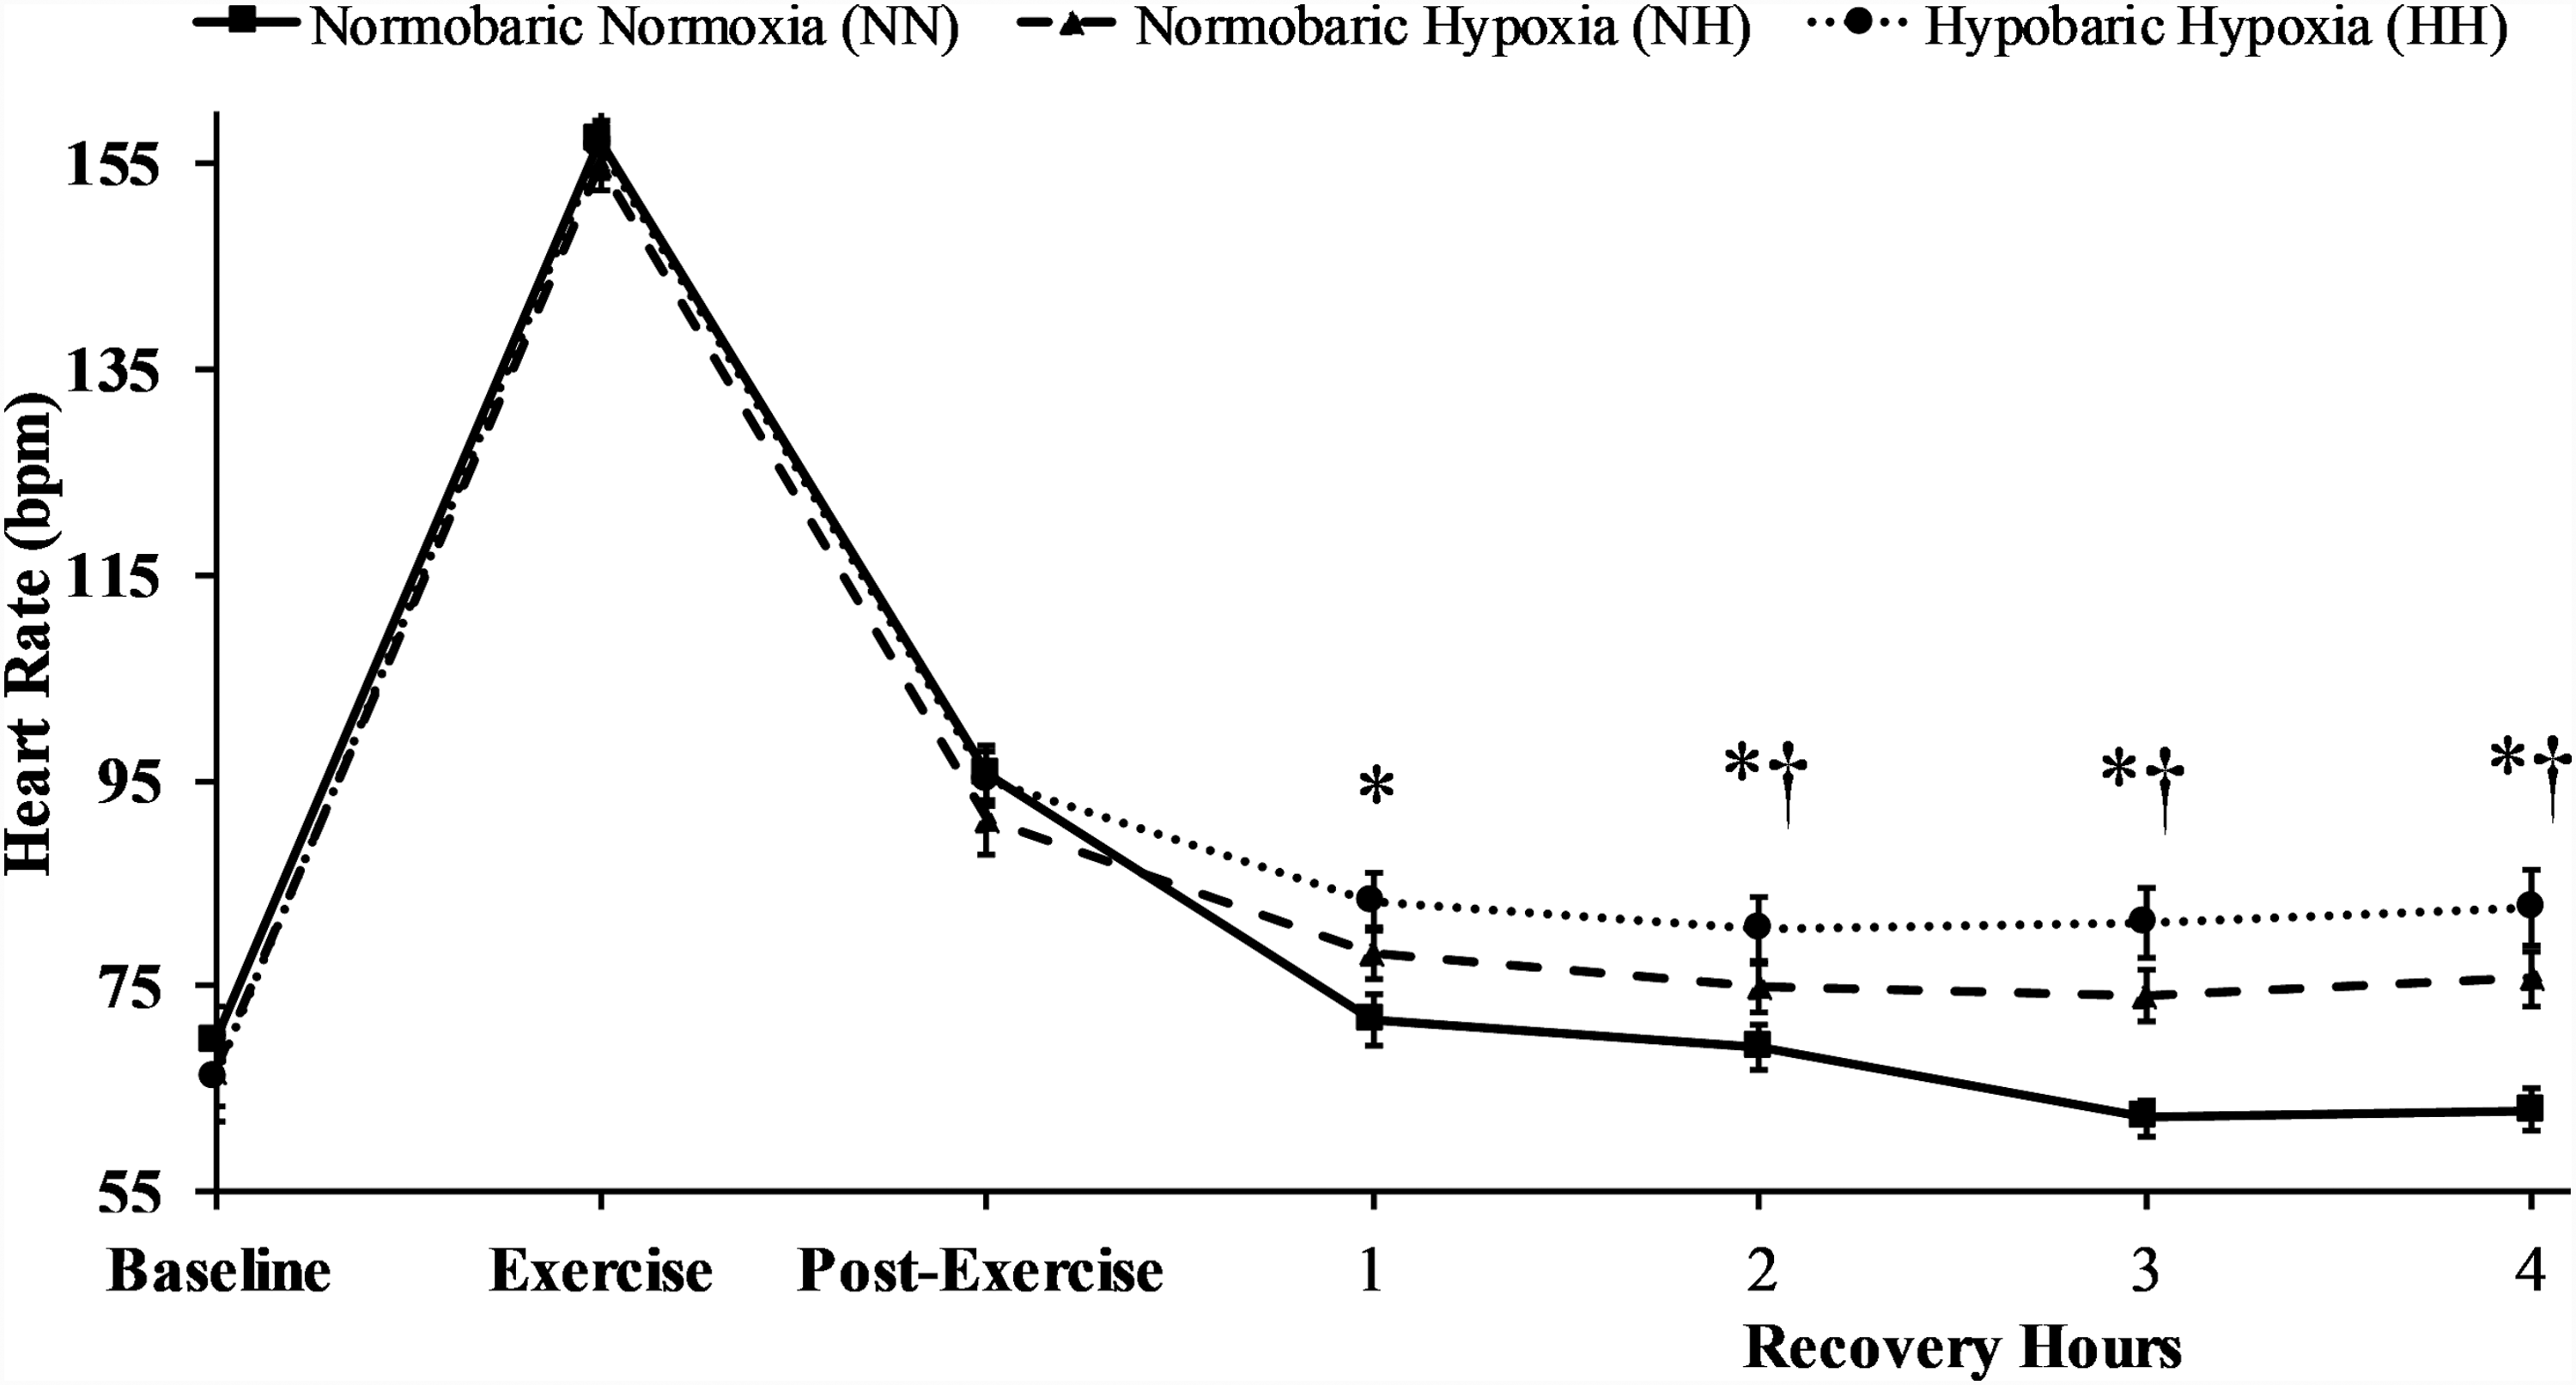
Heart rate between trials at baseline, during exercise, immediately post-exercise and each hour of recovery. *p < 0.05 NN from NH and HH, †p < 0.05 NH from HH.
Gene expression
There were no differences in mitochondria-related gene expression of PGC-1α (p = 0.816, η2 = 0.014), ERRα (p = 0.978, η2 = 0.002), or GABPA (p = 0.925, η2 = 0.006). NRF-1 decreased due to exercise (p = 0.003, η2 = 0.473), but was not different between trials (p = 0.748, η2 = 0.020). TFAM decreased after NN (p = 0.048, d = 0.821), increased after NH (p = 0.024, d = 0.974), but did not change with HH (p = 0.093, d = 0.680). Furthermore, TFAM gene expression was lower in NN compared with HH (p = 0.034, d = 1.047) and NH (p = 0.005, d = 1.301), but not different between HH and NH (p = 0.460, d = 0.308).
There were no differences in the myogenesis-related gene expression of MYOD (p = 0.787, η2 = 0.017), MYF-5 (p = 0.073, η2 = 0.170), or MYOG (p = 0.837, η2 = 0.013) between trials or after exercise (p = 0.327, η2 = 0.069; p = 0.262, η2 = 0.089; and p = 0.624, η2 = 0.018; respectively). MYF-6 was higher after exercise (p = 0.004, η2 = 0.457), but not different between trials (p = 0.971, η2 = 0.002). MSTN decreased from pre- to postexercise (p < 0.001, η2 = 0.831) in all conditions and was lower in HH than both NH (p = 0.035, d = 0.0626) and NN (p = 0.017, d = 0.907). NH and NN conditions were not different from each other (p = 0.718, d = 0.140). There were no differences in the proteolysis-related gene expression of atrogin-1 with exercise (p = 0.821, η2 = 0.004) or between trials (p = 0.318, η2 = 0.079). FOXO3 (p = 0.015, η2 = 0.356) and MuRF-1 (p < 0.001, η2 = 0.836) gene expression increased with exercise but were not different between the three conditions (p = 0.361, η2 = 0.070; and p = 0.196, η2 = 0.110 for FOXO3 and MuRF-1, respectively). Gene expression data are presented in Table 3.
Fold Change in Genes Related to Mitochondrial Development, Myogenesis, and Proteolysis in Normobaric Normoxic, Normobaric Hypoxic, and Hypobaric Hypoxia Before and Four Hours After Endurance Exercise
Data are means ± SE.
p < 0.05 from pre-, †p < 0.05 from 4 hours post-NN, ‡p < 0.05 from 4 hours post-NH.
NN, normobaric normoxic; NH, normobaric hypoxic; HH, hypobaric hypoxia.
Discussion
The purpose of the present study was to determine the response of key genes related to mitochondrial development and muscle mass regulation during recovery in HH, NH, and NN after exercise. The data from this investigation indicate that SpO2 is lower and heart rate is higher in HH recovery compared with NH. In addition, both hypoxic recovery conditions had lower arterial oxygen saturations and higher heart rates than NN recovery. We also observed increased TFAM gene expression in hypoxic conditions compared to control conditions. Furthermore, we found myostatin, a negative regulator of myogenesis, to be suppressed in HH to a greater extent than NH and NN. While these differences among HH, NH, and NN were observed, several other genes associated with exercise adaptation were not affected by hypoxia, regardless of the factor used to create the hypoxic environment.
As expected, no differences in peripheral oxygen saturation or heart rate occurred at baseline, during exercise, or immediately postexercise because cycling took place in ambient conditions during each trial. However, hypoxic recovery in HH produced the lowest oxygen saturation and highest heart rate compared to NH and NN conditions. Our study is in agreement with previous literature, but not all, suggesting that cardioventilatory differences exist between hypoxic types (Tucker et al., 1983; Loeppky et al., 1997; Savourey et al., 2003). Like the current study, previous data suggest a specific response of HH compared with NH. A lowered barometric pressure modifies fluid circulation and the trans-alveolar-capillary membrane flux (Levine et al., 1988) causing constriction of the pulmonary blood vessels and decreased oxygen diffusion (Millet et al., 2012) leading to reduced arterial oxygen saturation. Therefore, further increases in heart rate during HH compensate for the reduced oxygen saturation to meet metabolic demand.
Recovery in hypoxia increased TFAM gene expression in the current study independent of PGC-1α or the method in which hypoxia was achieved. TFAM mRNA has previously been shown to increase even in the absence of increased PGC-1α (Arany et al., 2005; Yin et al., 2008), postexercise (Pilegaard et al., 2003), or under hypoxic conditions (Gutsaeva et al., 2008; Yin et al., 2008; Zhu et al., 2010). Hypoxia increases TFAM gene expression, but does not alter PGC-1α in mice with ischemic brain injury (Yin et al., 2008). These data support the role of TFAM mRNA regulation during hypoxia exposure regardless of whether hypoxia was achieved with an alteration in barometric pressure or inspired oxygen fraction.
Changes in myostatin are another key outcome of the current study. Myostatin is a negative regulator of myogenic signaling—meaning deficiency or inhibition of this gene leads to a muscle growth stimulus and increases in this gene leads to muscle atrophy (Sandri, 2008; Gumucio and Mendias, 2013). Previous research observes decreases in skeletal muscle mass after exposure to HH during mountaineering expeditions (Hoppeler et al., 1990; Howald and Hoppeler, 2003), where other factors such as exercise and nutrition cannot be controlled. It is unknown if the reductions in skeletal muscle mass during these expeditions are associated with increases in MSTN expression. Interestingly, MSTN mRNA decreased in all conditions of the current study and was lower in HH than NH and NN. This suggests recovering from exercise in a lower barometric pressure may suppress MSTN to a greater extent than NH or NN recovery. Myostatin attenuation in these environments may provide a myogenic stimulus, particularly after exercise. Therefore, if HH recovery from exercise further attenuates MSTN, protocols may be developed to suppress MSTN expression further and potentially lead to a greater muscle-building stimulus. Applied research investigating the changes in muscle mass and strength incorporating HH into a training regimen is needed to further develop this hypothesis. The results from such research may have practical implications for improving muscle mass in various populations with limited exercise intensity capabilities.
Despite the differences that occurred among HH, NH, and NN, we observed no other effects of hypoxic recovery after exercise on select skeletal muscle gene expression. We observed a lower than expected exercise-stimulated response in the genes we measured. However, the exercise response in human gene expression appears to be affected by several variables and is generally in agreement with previous literature on mitochondrial biogenesis (Tunstall et al., 2002; Pilegaard et al., 2003; McGee and Hargreaves, 2004; Cartoni et al., 2005; Hock and Kralli, 2009), myogenesis (Yang et al., 2005; Coffey et al., 2006), and proteolysis (Sandri et al., 1995; Raue et al., 2007; Harber et al., 2009). Indeed, a subject population or exercise protocol that yielded a more robust response in gene expression may lead to a differential effect of hypoxia. Furthermore, the current subject population consisted of both males and females, and while no differences were noted, these results should be interpreted with caution as this study may be underpowered to detect these differences.
This study was completely done in the laboratory and thus factors other than barometric pressure may exist between actual terrestrial altitude and the simulations that were incorporated in this study. This study incorporated a relatively small chamber for inducing HH and thus factors such as CO2 accumulation may have played a role. The effects of this small chamber were controlled for by having subjects placed in this tube during the NH and NN trials as well. Furthermore, the laboratory, in which this research was conducted, is located at 975 m and thus may not be a true NN control. However, all subjects resided at this elevation and were therefore acclimated to this altitude. While there are limitations to this laboratory-based design, it allowed for safe and well-controlled muscle sampling and data collection conditions.
Conclusion
When recovery from endurance exercise takes place in HH, lower oxygen saturations and higher heart rates occur compared to normobaric hypoxic recovery. In addition, Hypobaric hypoxic recovery attenuates myostatin to a greater extent than NH and NN after exercise. TFAM expression is enhanced with hypoxia with no differences between the type of hypoxia. These data suggest and support the notion that a lowered barometric pressure initiates a greater hypoxic response compared to a lowered fractional oxygen concentration. However, hypoxia did not affect several other genes associated with exercise adaptation, regardless of the factor used to create the hypoxic environment.
Footnotes
Acknowledgments
We thank John Cuddy and Walter Hailes for their assistance in data collection and Roksana Zak for her assistance in gene expression analysis. The research was funded by the Department of Defense United States Army Medical Research and Materiel Command (DOD USAMRMC: W81XWH-15-2-0075) and by a Graduate Research and Creative Activity grant from the University of Nebraska at Omaha.
Authors Contributions
All authors have substantially contributed to this article and have reviewed and approved this submission. C.I.R. was the primary author and wrote the majority of the article, aided in data collection, and sample analysis. R.J.S. was the primary person responsible for gene expression sample and data analysis and statistical analysis and subsequently much of the methods section. B.C.R. and D.R.S. were responsible for the conceptualization of the project, obtaining muscle samples, aiding in the data collection, analysis, and writing.
Author Disclosure Statement
No competing financial interests exist.