
Abstract
Background:
Mechanisms underlying acute mountain sickness (AMS) remain unclear. Corticosteroids are effective for prevention and treatment suggesting a role for deficient endogenous cortisol. The cortisol awakening response (CAR), the increase in cortisol secretion over the first 30–45 minutes after morning awakening, better reflects the hypothalamic–pituitary–adrenal (HPA) axis than single cortisol measurements. We hypothesized that CAR may be altered in AMS-prone persons.
Methods:
Upon arrival at 4554 m (high altitude [HA]), 81 mountaineers agreed to participate. The following morning, they gave three saliva samples after awakening (S1: 0 minute, S2: 30 minutes, S3: 45 minutes). AMS was scored with the 1993 Lake Louise Score (LLS, cut-off ≥5). Minimally 4 weeks after descent, saliva was recollected by 58 of 81 participants at low altitude (LA); 382 ± 309 m, mean ± standard deviation). Cortisol was quantified by immunoassay. Three cortisol indices were analyzed: first sample on awakening (S1), CAR (area under curve with respect to S1) and total post awaking cortisol (area under the curve from ground [AUC-G]).
Results:
AMS prevalence was 30%. At HA compared to LA, S1 (450 ± 190 vs. 288 ± 159 ng/dL, p < 0.001) and AUC-G (387 ± 137 vs. 276 ± 114 ng/dL·min, p < 0.001) were greater, but CAR was not (50 ± 100 vs. 60 ± 81 ng/dL·min, p = 0.550). AMS+ compared to AMS− participants had higher S1 both at HA (495 ± 209 vs. 384 ± 176 ng/dL, p = 0.016) and LA (354 ± 160 vs. 253 ± 142 ng/dL, p = 0.015) and lower CAR at LA (24 ± 87 vs. 79 ± 72 ng/dL·min, p = 0.013). AUC-G was similar in both groups at HA and LA.
Conclusions:
Some indices of salivary cortisol response upon awakening differ between AMS+ and AMS−, both at HA and LA, suggesting a link between HPA-axis homeostasis and AMS.
Introduction
Nonacclimatized persons ascending to altitudes >2500 m risk developing acute mountain sickness (AMS) (Hackett and Roach, 2001; Basnyat and Murdoch, 2003; Bärtsch and Swenson, 2013). AMS is characterized by headache, nausea, fatigue, dizziness, and insomnia (Meier et al., 2017). Symptoms can be incapacitating and AMS can progress to life-threatening high-altitude cerebral edema (HACE). The mechanisms underlying AMS remain unclear (Hackett and Roach, 2001; Basnyat and Murdoch, 2003; Imray et al., 2010; Bärtsch and Swenson, 2013).
Oral synthetic corticosteroids such as dexamethasone and prednisone work well for prevention and treatment of AMS (Ferrazzini et al., 1987; Levine et al., 1989; Rock et al., 1989; Basu et al., 2002a; Tang et al., 2014), while inhaled synthetic corticosteroids such as budesonide do not (Berger et al., 2017; Lipman et al., 2018). Cortisol deficiency can present with symptoms similar to those of AMS (fatigue, weakness, gastric pain, nausea, vomiting, dizziness, and insomnia) (Arlt and Allolio, 2003). Therefore, impaired cortisol homeostasis could be involved in AMS (Panesar, 2004). Prior studies reported inconsistent results, perhaps related to the use of single samples taken at some time of the day, while cortisol levels show circadian swings (Sutton, 1977; Woods et al., 2012).
The cortisol awakening response (CAR) describes the marked increase in cortisol levels during the first 30–45 minutes following morning awakening (Clow et al., 2004, 2010a; Kudielka and Wüst, 2010). It combines a reactivity index (response to awakening, (Wilhelm et al., 2007) with aspects tied to circadian regulation (Clow et al., 2010b). Two main components can be distinguished: (1) the first sample (S1), ideally synchronized with the moment of awakening, representing the endpoint of a preawakening increase; and (2) the actual CAR, representing the dynamic of the cortisol increase after awakening. The two components (S1 and CAR) are inversely related (Stalder et al., 2016) and can be combined as an index of overall cortisol secretion over the post awakening period by calculating the area under the curve from ground (AUC-G) (Pruessner et al., 2003). Deviations from a typical CAR pattern are thought to be indicative of hypothalamic–pituitary–adrenal (HPA) axis perturbations (Chida and Steptoe, 2009; Kudielka et al., 2012). Using the CAR, we explored the HPA-axis in the context of AMS in conditions of acute exposure to high altitude (HA). We hypothesized that the CAR would be impaired in AMS-prone persons.
Methods
Participants
We recruited 102 mountaineers sequentially upon arrival at a mountain hut on the Swiss-Italian border (Capanna Regina Margherita, 4554 m) between the 7th and the 22nd of August 2015. After receiving oral and written information in Italian, French, English, or German, participants gave written informed consent. The study was approved by the Research Ethics Commission of the Canton Vaud in Switzerland and complied with the current version of the Declaration of Helsinki.
Procedures
In the evening after arrival at the hut, participants received instructions with emphasis on respecting the saliva collection procedure and its precise time points (0, 30, and 45 minutes post awakening). They then completed a general questionnaire in their preferred language about personal information, health and medication, acclimatization, history of altitude illness, and physical activity habits. Upon awakening the following morning the participants first sampled their saliva and then reported to the experimenter. They then scored AMS symptoms with validated translations of the 1993 Lake Louise Score (LLS) questionnaire (Roach et al., 1993). It scores five symptoms: (1) headache, (2) gastrointestinal symptoms, (3) fatigue or weakness, (4) dizziness or light-headedness, and (5) difficulty sleeping. Each is scored from 0 (not present) to 3 (severe or incapacitating) and scores are added up for the total score. AMS was defined as presence of headache and a score ≥5. Presence or absence of AMS is presented by AMS+ and AMS−, respectively. Resting heart rate (HR) and peripheral oxygen saturation (SpO2, CMS50F pulse oximeter watch; Contec, Qinhuangdao, China) were measured with the participant quietly sitting. After receiving instructions and material for saliva sampling at their homes, the participants then left the hut.
Saliva sampling, handling, and analysis
Before saliva sampling, the participants were asked to rinse their mouth with water. They then soaked cotton swabs with saliva by moving them around in the mouth for 2 minutes without chewing (Salivette; Sarstedt, Nümbrecht, Germany). They had to avoid smoking, eating, and drinking any beverages other than water during the sampling period, and to report on the sample form if the expected behavior had not been respected (Stalder et al., 2016). At HA, upon awakening the following morning, (12 to 18 hours after arrival at 4554 m), they collected three saliva samples (S1 at 0 minute, S2 at 30 minutes and S3 at 45 minutes). The home samples (low altitude [LA], 382 ± 309 m, mean ± standard deviation [SD]) were to be taken at the earliest 4 weeks after descent and at the same wake-up time as at HA. HA samples were stored in a freezer at −15°C and then transported to the laboratory on ice. LA samples were sent to the laboratory on the day of sampling by priority mail in a prestamped envelope. Upon reception by the laboratory, all saliva samples were stored at −20°C until analysis. Saliva cortisol concentration was quantified by enzyme immunoassay using a commercially available kit according to the manufacturer's recommended protocol (Salimetrics, State College, PA). On the day of the assay, samples were thawed, vortexed, and centrifuged at 1500 g (3000 rpm) for 15 minutes. Clear samples were then pipetted in duplicate into test wells using a 96-well plate. Measures were performed in duplicate with the average of each duplicate used as final value. Three cortisol indices were calculated: first sample on awakening (S1), CAR (area under curve with respect to S1, CAR: {[(S1+S2)/2] × 30}+{[(S2+S3)/2] × 15}—[S1 × 45]), and total post awakening cortisol levels (area with respect to ground, AUC-G = {[(S1+S2)/2] × 30}+{[(S2+S3)/2] × 15}) (Khoury et al., 2015).
Data analysis and statistics
Data were analyzed with Stata (version 15; StataCorp, College Station, TX) using t-test, Pearson chi-square, ANOVA and linear regression, as appropriate; (non-) normality of data distribution was accounted for. Aggregate data are reported as means ± SD unless indicated otherwise. The level of significance was set at p < 0.05.
Results
Study population
At HA, 102 participants accepted to participate to the study, of whom 69 also collected cortisol samples at LA. Nine of the participants were experienced mountain guides. Four participants were excluded from analysis; three because of acetazolamide use and one because of dexamethasone use. Other participants were excluded due to incomplete AMS data (n = 3) or technically unmeasurable cortisol levels (HA: n = 15, LA: n = 7). Therefore, data from 81 participants at HA and 58 participants at LA were analyzed. Their characteristics are shown in Table 1. In this group of mountaineers AMS prevalence at 4554 m was 30%.
Population Characteristics
Means ± SD. p-values are for the test of the hypothesis of equality among AMS+ versus AMS−. Uncompleted questionnaires explain the varying number in group age (n = 80) and last time over 2000 m (n = 79).
AMS, acute mountain sickness; LLS, Lake Louise Score; SD, standard deviation; SpO2, peripheral oxygen saturation.
HA versus LA
Post awakening cortisol levels (S1 and AUC-G) were significantly higher at HA compared to LA, while CAR was similar between the two altitudes (Fig. 1). There were no significant correlations between HA cortisol indices, AMS compound score, HR, or SpO2. There was a positive correlation between AMS score and HR (R = 0.27, p = 0.014) and a negative correlation between AMS score and SpO2 (R = −0.25, p = 0.025). There were no correlations between cortisol indices at LA and AMS scores at HA, except a trend for a slight negative correlation between CAR and AMS scores (R = −0.25, p = 0.063).

Post awakening cortisol levels are higher at HA compared to LA. Post awakening cortisol levels at HA and LA. Sample 1 = 0 minutes post awakening, sample 2 = 30 minutes, sample 3 = 45 minutes. Each symbol represents mean ± SEM. ***p < 0.001. Data are matched between HA and LA (n = 55). HA, high altitude; LA, low altitude; SEM, standard error of the mean.
AMS+ versus AMS− at HA
At HA, AMS+ participants displayed significantly higher S1 compared to AMS− participants (495 ± 209 [n = 24] vs. 389 ± 173 ng/dL [n = 57], p = 0.020). AUC-G tended to be higher in AMS+ compared to AMS− participants (423 ± 142 [n = 24] vs. 367 ± 138 ng/dL·min [n = 57], p = 0.097), while CAR was similar between the two groups (52 ± 119 [n = 24] vs. 75 ± 104 ng/dL·min [n = 57], p = 0.389) (Fig. 2a).
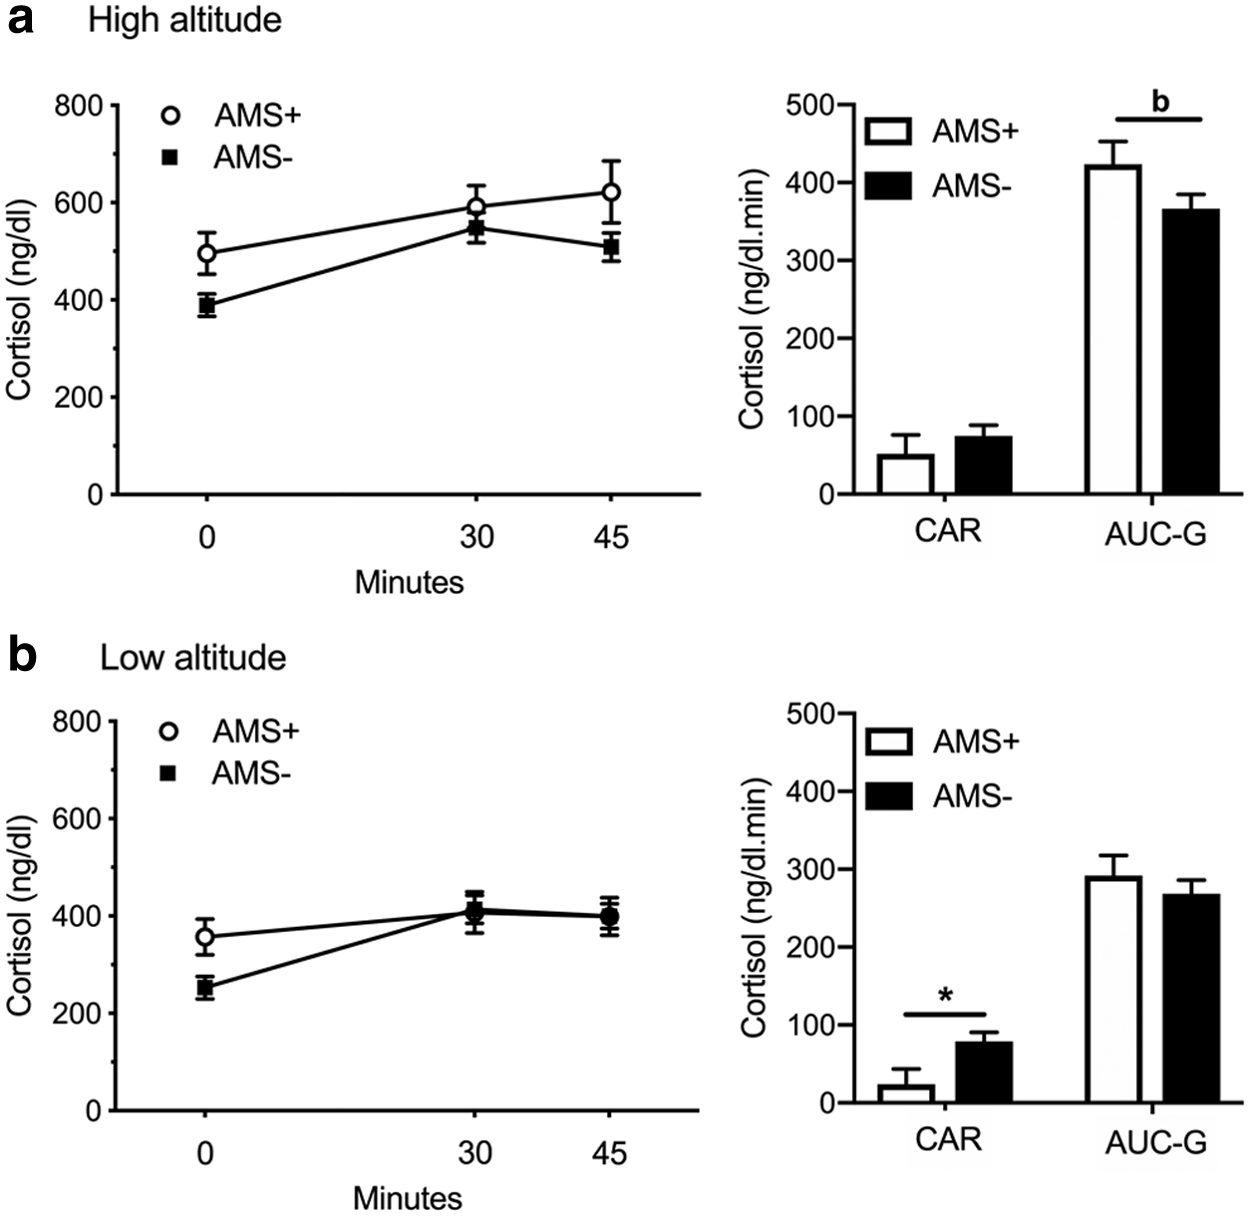
Differences in post awakening cortisol indices between AMS+ and AMS− at
No differences in cortisol indices were found between the individual LLS symptom scores (0, 1, 2, or 3) for headache, gastrointestinal symptoms, fatigue and/or weakness, and dizziness/light-headedness. Difficulty of sleeping scores (0, 1, 2, or 3) were accompanied by an overall significant increase in S1 (0: 380 ± 167 [n = 9], 1: 411 ± 190 [n = 30], 2: 401 ± 170 [n = 37], 3: 695 ± 193 [n = 5], p = 0.008).
Mountain guides, who presented lower AMS scores compared to all other participants (1.4 ± 1.5 [n = 9] vs. 3.7 ± 2.0 [n = 72], p = 0.002), displayed higher CAR (140 ± 79 [n = 9] vs. 59 ± 108 ng/dL·min [n = 72], p = 0.032) at HA, while S1 and AUC-G were equal (S1: 388 ± 190 [n = 9] vs. 425 ± 190 ng/dL [n = 72], p = 0.591, AUC-G: 431 ± 94 [n = 9] vs. 378 ± 145 ng/dL·min [n = 72], p = 0.286).
AMS+ versus AMS− at LA
Cortisol indices assessed at LA were different between participants having suffered or not from AMS at HA. AMS+ participants displayed significantly higher S1 (357 ± 164 [n = 20] vs. 253 ± 142 ng/dL [n = 38], p = 0.014) and lower CAR (24 ± 87 [n = 20] vs. 79 ± 72 ng/dL·min [n = 38], p = 0.013) compared to AMS− participants, while AUC-G (292 ± 116 [n = 20] vs. 268 ± 109 ng/dL·min [n = 38], p = 0.448) was similar in the two groups (Fig. 2b). No differences were found in HA minus LA (delta) cortisol indices (S1, CAR, and AUC-G) between AMS+ and AMS−.
When LA cortisol indexes were compared between participants suffering (i.e., score ≥1) or not (score = 0) from each LLS symptom at HA, we found that difficulty sleeping at HA was associated with a tendency of higher S1 (p = 0.083) but similar AUC and CAR at LA. Suffering of dizziness at HA was associated with a significantly higher S1 at LA (p = 0.005) and a tendency for higher AUC (p = 0.079). Cortisol indexes at LA were similar in participants suffering or not from all other LLS symptoms at HA.
At LA mountain guides, compared to all other participants, had lower S1 (138 ± 109 [n = 5] vs. 303 ± 153 ng/dL [n = 53], p = 0.023), equal CAR (88 ± 99 [n = 5] vs. 57 ± 79 ng/dL·min [n = 53], p = 0.421) and a tendency for lower AUC-G (191 ± 108 [n = 5] vs. 284 ± 108 ng/dL·min [n = 53], p = 0.072).
Discussion
We measured the CAR in mountaineers at high and LA and compared it between AMS+ and AMS− participants. We found that S1 and AUC-G but not CAR were increased at HA compared to LA. In contrast to our initial hypothesis, post awakening cortisol levels were increased in AMS+ participants. Even more interestingly, increased S1 and blunted CAR were also present in AMS+ participants when assessed at LA.
Cortisol and altitude
Studies of cortisol and adrenocorticotropic hormone (ACTH) levels at HA have reported inconsistent results because of varying altitudes, exposure times, cortisol collection timing, and physical exertion levels. Invariant cortisol levels and similar (Bartsch et al., 1991) or increased ACTH levels (Bouissou et al., 1988) have been reported after 1 to 5 hours exposure to hypobaric hypoxia compared with normoxia. Increased cortisol levels have been observed from the day upon arrival at HA (Park et al., 2014) up to 21 days (Moncloa et al., 1968; Humpeler et al., 1980; Richalet et al., 1989; Zaccaria et al., 1998; Basu et al., 2002b), with a return to LA levels after 30 days (Sawhney et al., 1991; Benso et al., 2007). Decreased cortisol levels have been reported 15–16 days after arrival at HA (McLean et al., 1989), perhaps due to a different sampling time. Our study extends these findings by identifying an increased AUC-G but similar CAR at HA compared with LA. The only other study to have described post awakening cortisol indices at HA showed both increased AUC-G and CAR (Park et al., 2014).
Increased cortisol in AMS+
Only few studies looked at (plasma) cortisol levels in relationship with AMS. Increased (Bartsch et al., 1988; Richalet et al., 1989) or unchanged (Woods et al., 2012; Spliethoff et al., 2013) HA cortisol levels have been found in AMS+ compared with AMS− participants. At LA, these studies reported similar cortisol levels between AMS+ and AMS−, but only single measures of (plasma) cortisol were reported. The increased S1 and S3 saliva cortisol levels in AMS+ compared with AMS− participants, about 12 to 18 hours after arrival at HA in our study, are consistent with previous findings at the same altitude (4554 m). Increased cortisol plasma levels at 6 and 18 hours after arrival at HA and similar levels at 42 hours were reported in AMS+ compared with AMS− participants (Bartsch et al., 1988). In that study, the largest differences between cortisol levels of both groups were observed 6 hours after arrival at HA. In a later study, after 5 ± 1 hours upon arrival at HA, those who would develop AMS initially had the same ACTH and cortisol levels compared to those who would remain healthy, yet, they displayed more pronounced exercise-induced ACTH and cortisol increases (Bartsch et al., 1991). In contrast, no differences in (plasma) cortisol were reported by Spliethoff et al. (2013) about 18 hours after arrival at 4559 m between AMS+ and AMS− participants. No significant differences between AMS severity and cortisol levels were found in a study comparing cortisol levels at rest and following 6 hour day treks during ascent from 1300 to 5150 m (Woods et al., 2012). Our present study extends these previous findings by reporting a tendency for an increased AUC-G and similar CAR between AMS+ and AMS− at HA. At HA, we further found blunted cortisol awakening curves in AMS+ participants, while in our mountain guides their tendency for AMS resistance (p = 0.074) was associated with a higher CAR (p = 0.032).
Our present study, exploring a different aspect of cortisol homeostasis compared to plasma levels at some time point, suggests a significant difference between AMS+ versus AMS− participants. But in contrast to our initial hypothesis, post awakening cortisol levels were increased in participants that developed AMS. On the contrary, the data collected from experienced mountain guides, less prone to AMS, suggest that higher CAR at altitude may be associated with this reduced risk of AMS.
Taken together, these observations suggest that an altered post awakening cortisol response is associated with the development of AMS, but do not allow us to determine whether altered cortisol homeostasis is a consequence or a cause leading to AMS. Assessment performed at LA may contribute to solve this question.
Cortisol differences at LA
Indeed, we found that, at LA and arguably sufficiently distant (minimal 4 weeks) from the previous altitude exposure, participants having suffered from AMS displayed increased S1 and decreased CAR compared to AMS− participants. Mountain guides, who had lower AMS scores compared to all other participants at HA, displayed lower S1 and AUC-G at LA. Furthermore, increased post awakening cortisol at LA was associated with development of severe insomnia (and possibly dizziness and headache) at HA suggesting a causal role of altered cortisol homeostasis in the pathogenesis of AMS.
Others reported no LA cortisol differences between AMS+ and AMS− (Bartsch et al., 1988, 1991; Spliethoff et al., 2013). However, only single plasma cortisol measures were obtained. We found at LA, similar to HA, increased S1, blunted saliva cortisol awakening curves and additionally decreased CAR for AMS+ compared to AMS− participants. As associations between CAR indices at LA and AMS were observed, it is tempting to speculate that HPA-axis alterations not only accompany AMS symptoms but also play a causal role in its development. Autonomic nervous system (ANS) dysregulation is thought to be involved in AMS (Karinen et al., 2012). Increased activation of the sympathetic nervous system was found in AMS+ participants at HA (Bartsch et al., 1988, 1991; Panesar, 2004; Woods et al., 2011). ANS and HPA-axis responses to stressors are highly coordinated (Rotenberg and McGrath, 2016). In accordance, higher trait anxiety and higher levels of anxiety before a mountain ascent were reported in climbers susceptible to AMS, and higher trait anxiety at LA was found predictive for severe AMS at HA (Missoum et al., 1992; Boos et al., 2018).
AMS and insomnia
We observed increased S1 values in participants reporting severe insomnia at HA. Increased S1 levels for severe insomnia in our study agree with elevated 24-h urine cortisol excretions in poor sleepers (Vgontzas et al., 1998) and with increased evening and night cortisol levels found in insomniacs compared to healthy sleepers (Vgontzas et al., 2001; Rodenbeck et al., 2002). In sum, both insomnia and AMS seem associated with increased S1. However, it remains unclear whether it is the sleep loss that drives the cortisol abnormalities or whether a primarily hyperactive HPA-axis contributes to the development of insomnia (Riemann et al., 2010). There is ongoing discussion on including insomnia when assessing AMS (MacInnis et al., 2013), and the 2018 version of the LLS questionnaire revision excluded the sleep item (Roach et al., 2018). We therefore also repeated our analysis without the insomnia item: LLS-3-NS (cut-off ≥3). Prevalence of AMS+ was now 34%. At HA, no cortisol index differences were observed (S1: p = 0.655, S2: p = 0.636, S3: p = 0.333, CAR: p = 0.502, AUC-G: p = 0.843). At LA, a tendency for an increased S1 (p = 0.083) and a decreased CAR (p = 0.056) were observed for AMS+ compared with AMS−, but no other cortisol index differences were seen (S2: p = 0.793, S3: p = 0.903, AUC-G: p = 0.6413). This suggests that sleep perturbation played an important role in the relationship we found between cortisol and AMS risk.
Cortisol or corticotrophin releasing factor?
Contrary to our hypothesis, AMS+ participants had higher cortisol levels than AMS− participants. Our findings are thus indicative of a difference between AMS+ and AMS− participants with regard to HPA-axis regulation, but a mechanistic explanation is lacking. Recent findings suggest that corticotrophin releasing factor (CRF) and the CRF-receptor-1 might be implicated in AMS and HACE (Chen et al., 2014; Song et al., 2016). We speculate that AMS+ participants might have a stronger stress response to altitude exposure (for unknown reasons), secreting higher levels of CRF, leading to greater ACTH release in turn leading to higher cortisol levels. These cortisol levels would be secondary to the stimulation of CRF-receptor-1 and its manifold other effects. Such a mechanism would allow to understand why dexamethasone works to prevent and treat AMS and HACE, namely by decreasing CRF secretion via negative feedback (Joyce et al., 2018).
Limitations
Several limitations of the present study must be acknowledged. First, we used saliva cortisol as an index of circulating free cortisol in plasma. Even though the two are strongly related, saliva sampling procedure and timing can introduce bias (El-Farhan et al., 2017). Inaccurate sampling varies with psychosocial and health factors (DiMatteo et al., 2000; Broderick et al., 2004; DiMatteo, 2004; Kudielka et al., 2007; Golden et al., 2014). Such sampling inaccuracy generally induces overestimated S1 and underestimated CAR. Thus, AMS+ may have influenced sampling accuracy. Furthermore, during 1-day studies up to 70% of CAR is attributable to trait-like covariates (Hellhammer et al., 2007; Almeida et al., 2009; Ross et al., 2014). Second, one third of HA participants did not send in the LA study material. Our results are therefore not necessarily representative. Also, our sample was not homogeneous with regard to prior acclimatization. Finally, the connections between sleep perturbations, HPA-axis regulation and acute exposure to hypoxia need to be better described. Further studies with larger populations, cortisol sampling monitoring, and strict variable control are needed to further study HPA axis differences between AMS+ and AMS− persons.
Conclusions
Our finding of differing morning cortisol dynamics upon awakening between AMS-prone and AMS-resistant mountaineers, both at low and at HA, suggests a potential link between HPA-axis homeostasis and AMS risk.
Footnotes
Acknowledgments
This study was financed with institutional funds. We thank the CAI (Italian alpine club) and the intendants of the mountain hut Capanna Regina Margherita for their help and hospitality and the participants to the study for their kind participation.
Authors' Contributions
B.K. and J.E. designed the study. B.K. and J.E. collected the field data. B.L. processed the saliva samples. P.V. and J.E. did the statistical analysis. All authors participated in data interpretation. J.E. wrote the first draft. B.K., J.E., and C.S. finalized the article. All authors have reviewed and approved of the article before submission.
Author Disclosure Statement
No competing financial interests exist.