
Abstract
Background:
Sex-based differences in metabolism and morphological characteristics may result in unique exercise responses during periods of limited oxygen availability.
Purpose:
To evaluate the effects of moderate normobaric hypoxia on the parameters of the work–time relationship during upper body exercise in women.
Materials and Methods:
Thirteen recreationally active women (age: 22.7 ± 2.6 years; height: 167 ± 8.6 cm; weight: 66.4 ± 9.7 kg; body fat: 27.6% ± 5% body fat) completed a maximal graded exercise test in both normobaric hypoxia (H; fraction of inspired oxygen (FiO2) = 0.14) and normoxia (N; FiO2 = 0.20) on an arm ergometer to determine peak oxygen uptake (VO2peak) and peak power output (PPO). Each participant completed four constant, work rate, arm-cranking time-to-exhaustion tests at 90%–120% PPO in both environmental conditions. Linear regression was used to estimate critical power (CP) and anaerobic capacity (W′) through the work–time relationship during the constant work rate tests. Paired sample t-tests compared mean differences between VO2peak, PPO, CP, and W′ between conditions (normoxia vs. hypoxia). Two-way (condition × intensity) repeated measures analysis of variance (ANOVA) was used to compare total work (TW) and time to exhaustion.
Results:
Hypoxia significantly reduced VO2peak (N: 1.73 ± 0.31 L·minute−1 vs. H: 1.62 ± 0.27 L·minute−1, p = 0.008), but had no effects on PPO (N: 78.08 ± 14.51 W vs. H: 75.38 ± 13.46 W, p = 0.09), CP (N: 57.44 ± 18.89 W vs. H: 56.01 ± 12.36 W, p = 0.55), and W′ (N: 4.81 ± 1.01 kJ vs. H: 4.56 ± 0.91 kJ, p = 0.51). No significant condition × intensity interactions were noted for TW or time to exhaustion (p > 0.05).
Conclusions:
Moderate normobaric hypoxia significantly reduced VO2peak, but had minimal effects on CP and W′ using the work–time model in women.
Introduction
Critical power (CP) represents the power output that a muscle group can maintain for a prolonged period of time without exhaustion (Monod and Scherrer, 1965; Monod, 1972) and can be extended to larger portions of the total body musculature through various exercise modalities (Moritani et al., 1981; Capodaglio and Bazzini, 1996; Angermann et al., 2006; Belasco Junior et al., 2010). CP is often regarded as a fatigue threshold (Poole et al., 1988) that separates exercise into two distinct intensities, in which the activity can be either sustained for an extended period of time (<CP) or intensity that will soon ensue fatigue (>CP). Subsequently, CP has been further defined as the greatest oxidative metabolic rate that can be maintained without exhausting the finite anaerobic working capacity (W′) (Taylor and Batterham, 2002; Poole et al., 2016). In the two-parameter model of CP, W′ is characterized as the total work (TW) accumulated above CP until exhaustion and can be graphed with the slope being CP and the Y-intercept being W′ (Townsend et al., 2017). Theoretically, this model allows for prediction of the onset of failure during constant work rate tests using a work–time model (Moritani et al., 1981). The work–time relationship has been successfully utilized to estimate CP and time to exhaustion (TTE) reliably (Capodaglio and Bazzini, 1996). Alternatively, the respiratory compensation point (RCP) is defined as the threshold where metabolic acidosis surpasses CO2 accumulation as the stimulus for hyperventilation (Kinnear and Blakey, 2014). RCP and CP are often defined as interchangeable thresholds occurring at the same relative power outputs, 83% ± 6% and 84% ± 6% of peak power output (PPO), respectively (Bergstrom et al., 2013; Jones et al., 2019), and may be used to prescribe exercise intensities for training or competition.
It is hypothesized that CP depends on oxygen supply, making it susceptible to reductions under hypoxic conditions (Monod and Scherrer, 1965). Expanding upon this hypothesis, subsequent research has shown that lowering the partial pressure of oxygen in the environment can cause a reduction in the slope of the work–time relationship, which reflects a reduction in CP values (Moritani et al., 1981; Shearman et al., 2016; La Monica et al., 2018). On a broader scale, overall exercise tolerance is reduced during exposure to moderate hypoxia (Dekerle et al., 2012). Moderate hypoxia is likely sufficient to substantially decrease performance with reductions in CP, VO2, and PPO during constant load and incremental tests; however, W′, which is highly reliant on the anaerobic pathway, may not be affected by the reduced inspired fraction of oxygen (Valli et al., 2011). Most of this research has been conducted using lower body tests (Adams et al., 1975; Dekerle et al., 2012; Simpson et al., 2015), leaving a gap in the existent literature related to the influence of hypoxia on upper body performance measures.
The upper body is not capable of the same aerobic performance as the lower body due to containing less muscle mass and greater type II fiber distribution, causing it to rely more heavily on anaerobic metabolism at lower exercise intensities than the lower body (Martin et al., 1991; Calbet et al., 2003; Sanchis-Moysi et al., 2010). Additionally, a smaller diffusion area and a larger diffusion distance (Calbet et al., 2003) may cause the upper body to respond differently to hypoxia than the lower body, which may be amplified in women.
Large gender differences exist in overall skeletal muscle mass, with men having significantly more than women in both absolute and relative terms (Janssen et al., 2000). These gender differences are even greater in the upper body (+40% in men compared with women) than the lower body (+33% in men compared with women), which are likely tied to performance at both maximal and submaximal intensities. Continuous maximal arm crank exercise represented a lower cardiorespiratory stress compared with maximal leg exercise, leading to approximately two-thirds of lower body VO2 values (Martin et al., 1991). This is attributed to recruitment of less muscle mass in upper body exercise, and the relatively smaller muscle mass of the upper body may cause fatigue before an individual reaches their maximum cardiac output (Belasco Junior et al., 2010). Since the attainment of maximum cardiac output is a hallmark of maximal oxygen uptake (VO2max) and since it is generally not attained during upper body ergometry, peak oxygen uptake (VO2peak), defined as the highest value of VO2 attained during a test, is primarily used to determine maximal aerobic capacity during upper body exercise (Day et al., 2003).
The effects of acute hypoxia exposure during incremental tests to exhaustion in the upper and lower body have shown that upper body PPO is affected to a greater degree than lower body PPO (Angermann et al., 2006). Furthermore, an inverse relationship was reported between capillary density and decrements in PPO during hypoxia, showing that more aerobically trained individuals may be more sensitive to hypoxia. La Monica et al. (2018) recently reported that moderate normobaric hypoxia during arm ergometry significantly reduced CP, VO2peak, and PPO, while W′ was not affected in recreationally active men. These results are in agreement with previous research (utilizing both male and female participants) by Dekerle et al. (2012) during lower body cycling under similar conditions; however, research on the effects of hypoxia using the work–time relationship in women has yet to be fully explored in the upper body.
Gender differences during exercise testing have been found in oxygen utilization and upper body strength. Men possess greater absolute and relative strength in the upper body due to larger muscle fiber type I and type II area, as measured by needle biopsy analysis (Miller et al., 1993). Women experience fatigue more slowly and recover more quickly than men (Fulco et al., 1999) possibly due to a greater capacity for oxidative phosphorylation (Green et al., 1984). Women have attenuated fatigue in hypoxic environments (Fulco et al., 2001) and experience greater hyperventilation than men at higher altitudes (Wagner et al., 1979), with aerobically trained women being more impacted than sedentary women (Mollard et al., 2007). Therefore, the reduced oxygen transport may have a strong impact on performance variables, such as CP and W′, in women who are likely affected by hypoxia differently than men.
To better understand the influence of hypoxia on upper body performance in women, the purpose of this study was to examine the parameters of the work–time relationship (CP and W′) as well as maximal (VO2peak) and submaximal RCP responses to normoxia and normobaric hypoxia during upper body ergometry. Our hypothesis was that normobaric hypoxia would reduce CP values leading to a proportionately greater reliance on W′ relative to CP while also causing a reduction in VO2peak and lowering of the power output associated with RCP.
Materials and Methods
Participants
Fourteen participants were recruited for this study. One participant did not complete the study due to scheduling conflicts; therefore, 13 total participants completed the outlined procedures. All participants met the American College of Sports Medicine physical activity recommendations to be classified as recreationally active. To eliminate residual fatigue and soreness during testing, participants were asked to refrain from any strenuous activity within 48 hours before testing. Before enrolling in the study, participants completed a Confidential Medical and Activity Questionnaire as well as a Physical Activity Readiness Questionnaire (PAR-Q) to determine if they had any physical limitations that would keep them from performing any of the study procedures. Participants were excluded if they were unable to perform physical exercise as determined by the PAR-Q. Participants were asked to keep their diet and, if any, nutritional supplementation consistent throughout the study. Written informed consent was obtained from all participants before testing and it was approved by the university's internal review board.
Research design
An acute cross-sectional design was used to evaluate the effects of normabaric hypoxia on upper body CP and W′. This was determined through the comparison of performances within multitrial constant work rate tests under normobaric normoxia and hypoxia. Each participant visited the Human Performance Laboratory seven times, which included a familiarization trial, 2 days of maximal graded exercise tests (GXTs) under either normobaric normoxia or normobaric hypoxia, and 4 days of TTE trials randomized with respect to intensity and environment. On the initial visit, paperwork was completed, body composition was measured using a bioelectrical impedance analysis device, and a familiarization trial was performed for the GXT. During the following two visits, participants performed one GXT under each environment to determine VO2peak and PPO. During the final four visits, participants performed two TTE trials per session. Participants completed the entire study over 6 weeks with a minimum of 48 hours between visits.
Testing methods
Body composition and familiarization
Body composition was assessed through multifrequency bioelectrical impedance analysis (InBody 770; InBody, Seoul, Korea) to determine percent body fat and upper extremity lean mass. A familiarization of the GXT was provided to each subject with the arm ergometer (891E, Monark Upper Body Ergometer; Vansbro, Sweden) before testing sessions took place. Participants performed an unweighted (0 W) 5-minute warm-up before the GXT. As adapted from the study by Hill and colleagues (2016), participants were required to maintain a cranking cadence of 50 revolutions per minute (RPM) at an initial workload of 50 W for 3 minutes. The workload was then increased by 10 W every 2 minutes until the participant was unable to maintain a cadence above 50 RPM for 5 seconds despite verbal encouragement or volitional fatigue. Each subject was seated with the crank arm lined up with the center of their glenohumeral joint and positioned so that their arms were extended, but not fully locked out, during cranking.
Incremental testing protocol
An incremental test to volitional exhaustion was performed on a cycle ergometer (891E, Monark Upper Body Ergometer; Vansbro, Sweden) to determine PPO in watts (W) and peak oxygen consumption (VO2peak) in liters per minute (L·minute−1). Before testing, each participant was fitted with a heart rate monitor (Garmin Ltd., Canton of Schaffhausen, Switzerland), to record the participants' heart rate, and a mask that stabilized a one-way valve around their mouth and nose to collect respiratory gases. All breath-by-breath gas exchange data were collected using a metabolic gas analyzer (Quark CPET; Cosmed, Rome, Italy) and all calibration procedures were carried out as per manufacturer's instructions. In addition, participants will perform these tests inside a large transparent cubicle (At-Home Cubicle; Hypoxico, Inc., New York, NY), which is connected to an altitude generator (Everest Summit II; Hypoxico, Inc.) to simulate a moderate altitude environment. Participants sat inside the enclosed tent for at least 5 minutes before the start of each test to acclimate to the environment (Dekerle et al., 2012). Oxygen saturation was measured using a finger pulse oximeter (CMD50D+; Contec Medical Systems, Qinhuangdao, China) to verify acclimation. The environment for the second and third visits was randomized so that each participant would perform one GXT at a simulated altitude of 500 m (fraction of inspired oxygen [FiO2] = 0.201 ± 0.002, normoxic conditions) and one at 3250 m (FiO2 = 0.14 ± 0.001, hypoxic conditions). A dehumidifier (DH-35K1SJE5; Hisense International Co., Ltd, Qingdao, Shandong, China) was used inside the tent to mitigate extreme increases in relative humidity. The testing environment was monitored through the metabolic gas analyzer's environmental sensor with average values of temperature (24.5 ± 1.87°C), relative humidity (37.7% ± 6.6%), and barometric pressure (756.8 ± 4.7 mmHg). Before the GXT, participants performed an unweighted (0 W) 3-minute warm-up and then were required to maintain a cranking cadence of 50 RPM at an initial workload of 50 W. Thereafter, the workload was increased by 10 W every 2 minutes until the participant was unable to maintain a cadence above 50 RPM for a duration of 5 seconds despite verbal encouragement or volitional fatigue. The power output achieved in the last 2-minute stage was recorded as PPO and the highest breath-by-breath oxygen consumption rate was recorded as VO2peak. RCP was determined using the autodetect feature in the metabolic system software (Omnia HL7; Cosmed). Upon indication of an abnormality, visual inspection was used to verify RCP, which was defined as the VO2 value corresponding to the point of departure from linearity of the minute ventilation versus VCO2 relationship.
Constant work rate tests
Four high-intensity, constant work rate tests (90%, 100%, 110%, and 120% PPO) were performed under both normoxia and hypoxia within a large transparent cubicle (Shearman et al., 2016). All participants were able to complete at least 1 minute at 120% PPO during these tests. Trials were randomized for environment and intensities for every testing visit. Participants were exposed to the environment for 5 minutes before testing (N; O2 saturation: 98.1 ± 1.1: H; O2 saturation: 89.8 ± 1.5). Following the same GXT warm-up, participant's oxygen saturations were measured to confirm acclimation to the environment. Breath-by-breath gas exchange analysis was conducted in a manner similar to the GXT. Participants were given a metronome set at 100 beats per minute and were allowed to view their RPM value on the ergometer's digital display to aid in maintaining 50 RPM. TTE was determined to the nearest second at the moment of volitional fatigue or failure to maintain a cranking cadence above 50 RPM for longer than 5 seconds. Linear regression was used to determine the slope of the line from the relationship between TTE and TW (calculated as the product of TTE and power output) for each set of trials performed under normoxic and hypoxic conditions. According to the work–time model (Smith et al., 1998), the slope of the regression line was considered the CP, while the Y-intercept was deemed W′. Goodness-of-fit values for the work–time relationship are reported in the Results section.
Statistical analyses
Normality was assessed using Shapiro–Wilk's test. Paired sample t-tests were used to compare mean differences between VO2peak, PPO, and CP, while the Wilcoxon signed-rank test was used to compare the median difference in W′ between conditions (normoxia vs. hypoxia). For the constant work rate tests, a two-way repeated measures analysis of variance (ANOVA) [environment (normoxia vs. hypoxia) × intensity (90%, 100%, 110%, and 120% PPO)] was used to examine differences in mean VO2, TTE, and TW during the constant work rate trials. A two-way repeated measures ANOVA environment (normoxia vs. hypoxia) was used to examine differences in mean CP and RCP. In the event of a significant interaction, post hoc analysis included paired sample t-tests and one-way repeated measures ANOVAs. An alpha level of p < 0.05 was considered significant. Cumming's estimation plots were used to create Figures 1 and 2 utilizing online software (Ho et al., 2019) These plots were used to visualize how individual differences affected delta scores between hypoxia and normoxia during the GXT and the four intensities utilized during the constant work rate trials. All analyses were performed using statistical software (IBM SPSS Statistics for Windows, Version 22.0; IBM Corp, Armonk, NY).
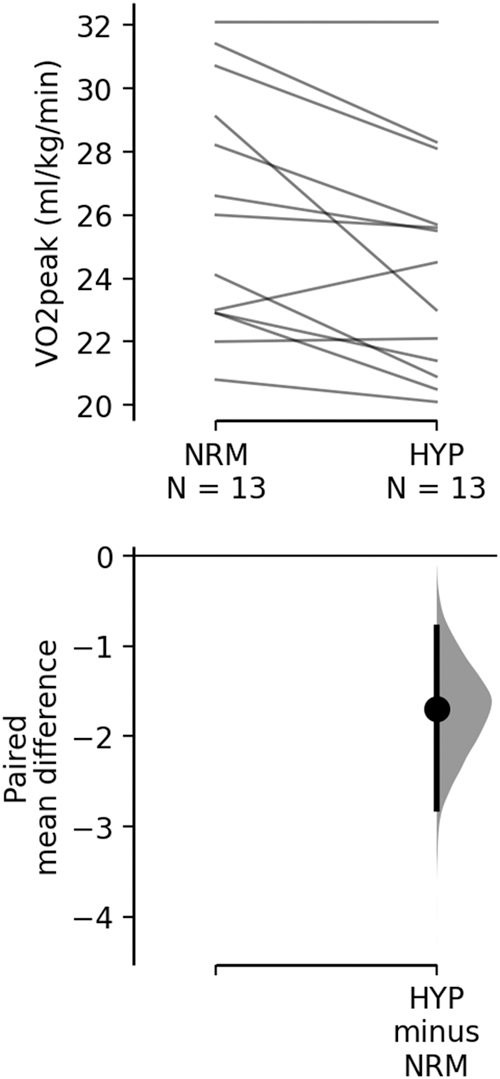
Peak oxygen consumption (VO2peak) values relative to body mass for graded exercise test trials. The paired mean differences (normoxia: NRM vs. hypoxia: HYP) are shown in the above Cumming estimation plot. The raw data are plotted on the upper axes; each paired set of observations is connected by a line. On the lower axes, each paired mean difference is plotted as a bootstrap sampling distribution. Mean differences are depicted as dots; 95% confidence intervals are indicated by the ends of the vertical error bars.
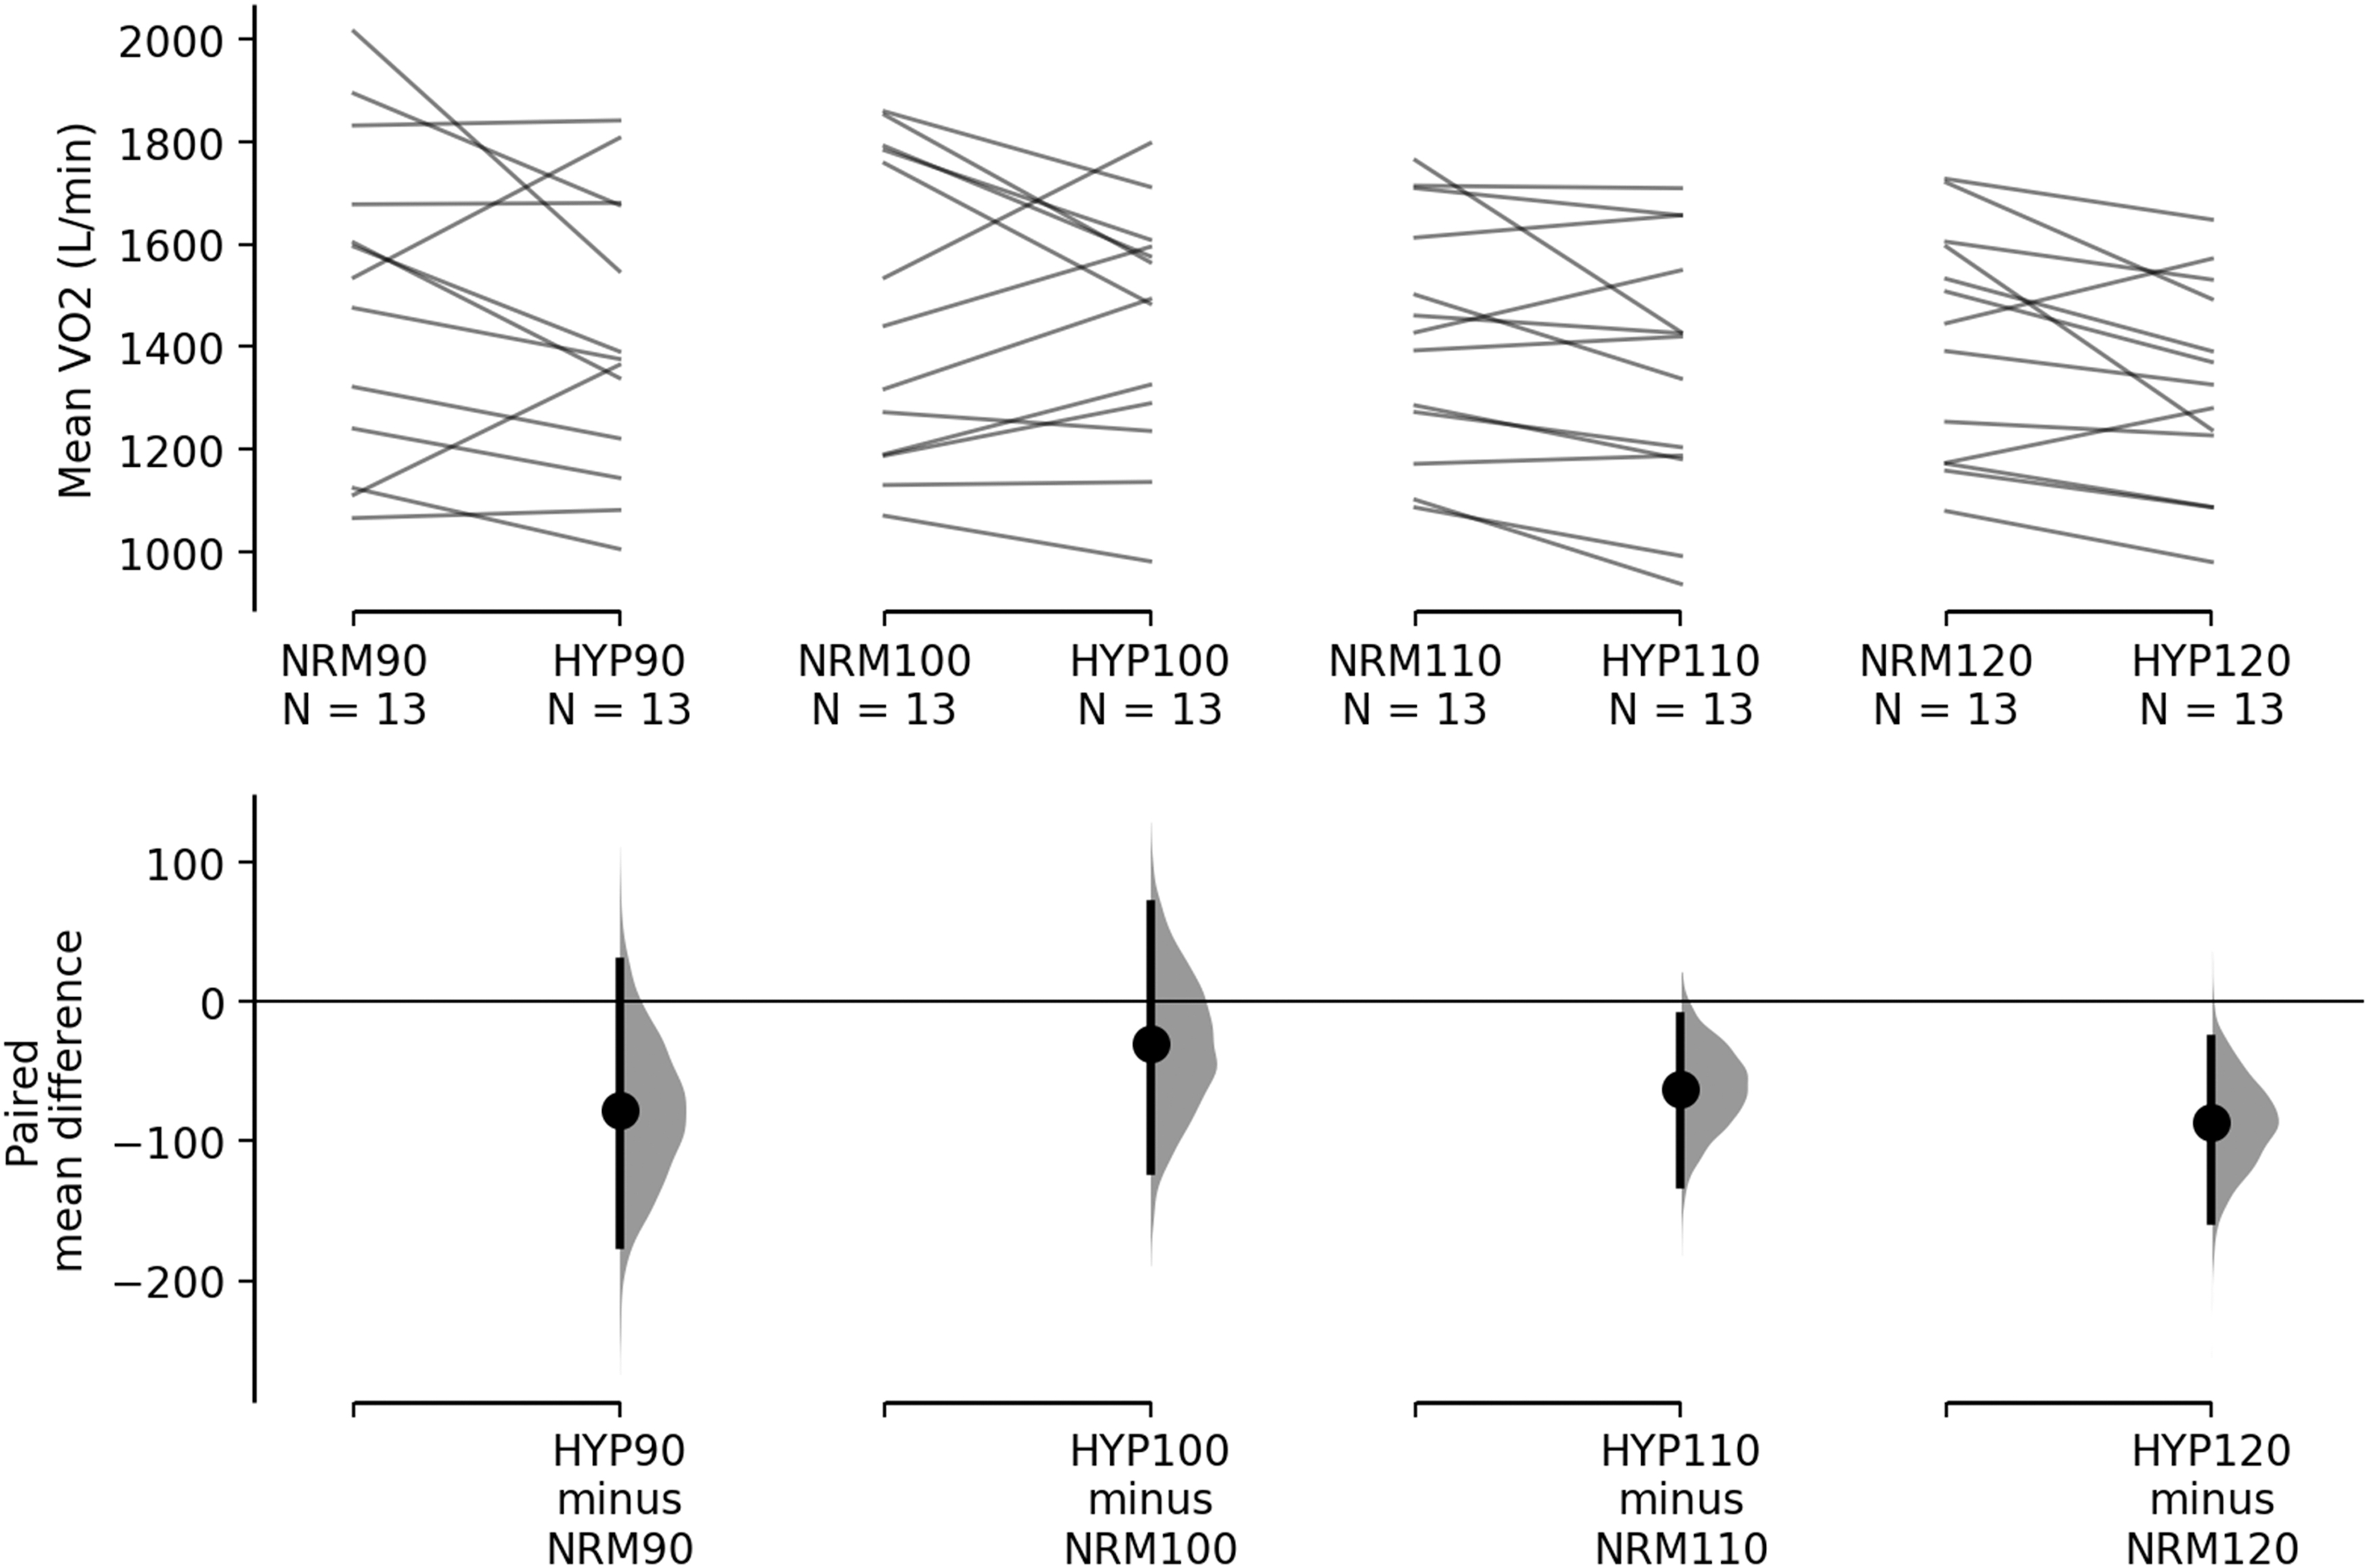
Mean oxygen consumption (VO2) values for constant work rate tests. The paired mean differences (normoxia: NRM vs. hypoxia: HYP) for four comparisons (90%, 100%, 110%, and 120% of PPO) are shown in the above Cumming estimation plot. The raw data are plotted on the upper axes; each paired set of observations is connected by a line. On the lower axes, each paired mean difference is plotted as a bootstrap sampling distribution. Mean differences are depicted as dots; 95% confidence intervals are indicated by the ends of the vertical error bars.
Results
With the exception of W′, all variables exhibited normality according to Shapiro–Wilk's test. VO2peak (p = 0.008; Fig. 1) was significantly greater in normoxia than hypoxia. No differences due to condition were found for PPO (p = 0.09; normoxia: 78.08 ± 14.51 W; hypoxia: 75.38 ± 13.46 W), CP (p = 0.55; normoxia: 57.44 ± 18.89 W; hypoxia: 56.01 ± 12.36 W), and W′ (p = 0.510; normoxia: 4.81 ± 1.01 kJ; hypoxia: 4.56 ± 0.91 kJ). No significant condition × intensity interactions were noted for TW or TTE (p > 0.05). The r2 for the work–time relationship was 0.947 ± 0.131 (range 0.816–0.999) in normoxia and 0.964 ± 0.044 (range 0.898–0.999) in hypoxia; (Fig. 3). A main effect for environment (F = 6.655, p = 0.024; Fig. 2) was observed for mean VO2, with normoxia (1.50 ± 0.26 L·minute−1) being significantly greater than hypoxia (1.40 ± 0.23 L·minute−1) during the constant work rate tests. A main effect for threshold (F = 18.669, p = 0.001) was observed, with power output at RCP (92.0 ± 8.2 W) being significantly greater than CP (73.1 ± 18.9 W) calculated from the constant work rate tests.

Work–time relationship between conditions. There are four points for both normoxia and hypoxia; each point represents mean values of a time-to-exhaustion trail at a power output of 90%, 100%, 110%, or 120% of peak power. The error bars represent 95% confidence intervals for each point. Note: the mean values for 120% of peak power output trials are relatively similar, causing the normoxia data point (134 s, 12,400 J) to obscure the hypoxia data point (136 s, 12,300 J).
Discussion
This investigation is the first to examine the impact of normobaric hypoxia on CP and W′ during upper body exercise in women. Moderate normobaric hypoxia (FiO2 = 0.14; 3250 m) significantly reduced VO2peak, but had minimal effect on CP and W′ during arm ergometry. The lack of significant differences in CP values is in contrast to previous findings in men (La Monica et al., 2018). This may be due to physiological differences, specifically oxidative phosphorylation, vasodilatory response, and muscle size/strength, between sexes (Miller et al., 1993; Fulco et al., 1999; Casey et al., 2013). Notably, similar to previous CP investigations, the work–time relationship was highly linear (Capodaglio and Bazzini, 1996; Bergstrom et al., 2012; Dekerle et al., 2012).
Significant reductions in VO2peak during the GXTs and average VO2 during the constant work rate trials were observed in hypoxia during this investigation. Similar reductions in VO2peak during normobaric hypoxia in both upper and lower body exercise modalities have been previously reported (Angermann et al., 2006). These decrements in VO2 values are likely caused by reduced oxygen availability due to the lower partial pressure of O2 (FiO2 = 0.14) used in this investigation. La Monica et al. (2018) observed similar results in a recent investigation with significantly reduced VO2peak values (N: 2.34 ± 0.34 L·minute−1 vs. H: 2.27 ± 0.34 L·minute−1, p = 0.04). Although not measured, it is likely that maximal cardiac output and peak blood flow were reduced, contributing to the lower VO2 values during moderate hypoxia (Calbet et al., 2003).
In agreement with previous studies, the current investigation found that W′ was not affected by moderate hypoxia. Dekerle et al. (2012) found no significant differences in W′ during lower body cycling at a comparable level of hypoxia (FiO2 = 0.15). Interestingly, there may be a threshold that must be surpassed for hypoxia to affect W′. After testing at multiple simulated altitudes (250, 1250, 2250, 3250, and 4250 m), Townsend et al. (2017) showed that W′ during cycle ergometry was only reduced at the highest level evaluated. It appears that this altitude threshold may hold true during upper body ergometry as normobaric hypoxia (3250 m) had minimal, if any, effect on W′ in the current study or during a recent investigation in men (La Monica et al., 2018).
Hypoxic conditions decrease the partial pressure of oxygen, which has been shown to reduce CP determined through the work–time relationship (Shearman et al., 2016). These hypoxia-influenced reductions have been extensively examined in the lower body using cycle ergometers (Moritani et al., 1981; Shearman et al., 2016) and more recently in the upper body (La Monica et al., 2018) in male participants. However, the current investigation utilizing female participants found no significant differences in CP between hypoxic and normoxic conditions. This disparate finding may have been caused by a multitude of factors, including unique responses to submaximal exercise, a greater capacity for oxidative phosphorylation, slower fatigue rate, greater vasodilation, and lower overall upper body strength in women compared with men (Green et al., 1984; Miller et al., 1993; Fulco et al., 1999, 2001; Casey et al., 2013; La Monica et al., 2018).
Sex-based differences in cardiorespiratory endurance have been consistently observed in the scientific literature, with women typically being outperformed by men. Men have a larger depression of the parasympathetic nervous system during exposure to intermittent hypoxia, while both sexes, when matched for age and body–mass index, have similar increases in minute ventilation under normobaric hypoxic conditions (Wadhwa et al., 2008). Changes in the hormonal milieu throughout the menstrual cycle, specifically alterations in progesterone, are often discussed as possible contributors to the sex-based differences in aerobic performance. However, Jordan et al. (2000) observed a lack of difference in poststimulus ventilatory decline measures between men and women or the phases of the menstrual cycle. This suggests that progesterone does not influence aerobic performance in women as previously thought. Women have a greater postexercise vasodilatory response compared with men, but this difference likely disappears with age (Casey et al., 2013). Therefore, it is possible that this increased vasodilation in women is the result of compensation for reduced oxygen availability during exercise in hypoxic conditions.
It has been postulated that differences in the capacity for oxidative phosphorylation result in women fatiguing more slowly and recovering more quickly than men (Fulco et al., 1999). For example, women exhibited an attenuated fatigue rate and TTE under hypobaric hypoxia during intermittent, submaximal static contractions compared with men (Fulco et al., 2001). Interestingly, the differences in CP between normoxia and hypoxia during upper body ergometry in men appeared to be driven by decreased TTE at 90% of PPO (La Monica et al., 2018), which did not occur in the current sample of recreationally active women. Thus, upper body performance-based differences, particularly during submaximal exercise, might have resulted in the limited effect on CP in the current sample of women, which are in contrast to previous findings in men.
Specific to the upper body, women have also shown greater vasodilatory responses to hypoxia during rhythmic forearm exercise compared with age-matched men (Casey et al., 2013). Significant correlations have been reported between strength and muscle cross-sectional area after measuring voluntary strength and muscle fiber type and size (Miller et al., 1993). Furthermore, women possess 45% smaller cross-sectional area in the biceps brachii compared with men as well as significantly lower percentages of total cross-sectional areas occupied by type II fibers (Miller et al., 1993). This may have been a contributing factor influencing the determination of CP since the biceps brachii is a prime mover during upper body ergometry exercise (Forman et al., 2014). Average upper body CP values in recreationally trained men have been recorded as 90.22 ± 12.88 W in normoxia, which were significantly reduced (85.26 ± 9.64 W) in hypoxia (La Monica et al., 2018). The lower overall CP values in the current sample of women (∼57 W) may be caused by less overall muscle mass than men, generally leading to less upper body strength (Miller et al., 1993). Therefore, lesser muscle mass (Janssen et al., 2000) and greater type I fiber distribution (Miller et al., 1993) coupled with greater vasodilatory response in women may have limited the influence of hypoxia on CP values.
RCP and CP have often been treated as interchangeable thresholds occurring at the same power output while differentiating between the heavy and severe exercise intensity domains (Bergstrom et al., 2013; Jones et al., 2019). RCP, unlike CP, can be determined from a single incremental test, while CP requires multiple constant work rate trials or an all-out effort test (Hughson et al., 1984; Vanhatalo et al., 2007). If these thresholds are truly interchangeable, evaluation of exercise intensity domains would be much easier and more time efficient using RCP. Both RCP and CP occur around 80% of VO2max, and numerous studies have been conducted examining intensities either above or below this threshold, failing to disassociate RCP from CP (Bergstrom et al., 2013). The current investigation determined average CP to occur at ∼73% PPO, while RCP occurred at ∼92% PPO. A high degree of variability exists between these parameters, which limits accurate estimations based on one another (Broxterman et al., 2015). More recent literature on the topic suggests that RCP and CP are not physiologically equivalent and should not be treated as the same fatigue threshold (Dekerle et al., 2003). Furthermore, work rates associated with CP and RCP have been found to be different from one another, with CP appearing before RCP. While neither CP nor RCP was altered due to hypoxia, the current investigation demonstrated a significant difference in the power outputs between these two thresholds during upper body ergometry in women.
Some limitations in the current study should be noted. The initial power output during the initial stage of the GXT (50 W) was restricted due to the ergometer (equivalent to the unloaded weight basket and suggested cranking cadence) and may have impacted subsequent performance. While a previous investigation appears to support this power output as an appropriate starting point for males during upper body exercise (La Monica et al., 2018), further investigation may be needed to corroborate this issue in females. Furthermore, this topic as well as the specific evaluation of exercise intensity and the reliability of CP modeling during arm ergometry may need to be examined in follow-up studies to parse out methodological factors affected by hypoxia. While not the primary aim of the current investigation, a true VO2max value from the upper body GXT using female participants was not established. This investigation evaluated VO2peak; however, recent work in this area suggests that validation procedures may be required (Poole and Jones, 2017). Nonetheless, future work is needed to develop these procedures specific to upper body exercise.
Conclusions
In conclusion, this investigation demonstrated that normobaric hypoxia (FiO2 = 0.14) had minimal effect on CP and W′ during upper body ergometry in women, which differs from the findings previously reported in men under similar circumstances. Sex-based differences, such as vasodilatory responses and muscle mass, may have dampened the effect of hypoxia on upper body CP in women. Although submaximal fatigue thresholds were unaltered, this study demonstrated that both peak and average VO2 were significantly decreased under normobaric hypoxia. Limitations in oxygen availability may have been overcome by the ability of women to more efficiently deliver oxygen to a relatively smaller upper body musculature compared with men while allowing similar performance during upper body time-to-exhaustion trials of varying intensities. Overall, this investigation demonstrated not only that normobaric hypoxia alters the rate of oxygen consumption during upper body ergometry but also that these decrements do not appear to translate to decreased submaximal or maximal exercise performance. These findings should be used to uniquely inform the design of training programs for women, particularly those aimed at manipulating environmental conditions during upper body exercise.
Footnotes
Authors' Contributions
M.B.L.M. and T.M.S.S. conceived and designed the research. T.M.S.S. and M.B.L.M. performed the data collection. T.M.S.S. and D.H.F. analyzed the data. T.M.S.S. wrote the article. D.H.F., M.B.L.M, and J.R.S. provided edits and reviewed the article. All authors read and approved the article.
Author Disclosure Statement
No competing financial interests exist.
Funding Information
No funding was received for this investigation.