
Abstract
Vinueza Veloz, Andrés Fernando, Aymaru Kailli Yaulema Riss, Chris I. De Zeeuw, Tannia Valeria Carpio Arias, and María Fernanda Vinueza Veloz. Blood pressure in Andean adults living permanently at different altitudes. High Alt Med Biol. 21:360–369, 2020.
Aims:
To estimate the association between blood pressure (BP) and chronic exposure to altitude in nonhypertensive Andean adults, while taking ethnicity into consideration.
Materials and Methods:
Sample included 10,041 nonhypertensive adults with indigenous or mixed ethnic background (the latter also referred to as mestizos), who permanently lived at different altitudes. BP was measured following international recommendations. Altitude was measured in meters above the sea level (masl) using a global positioning system. Data were analyzed through linear regression models with restricted cubic splines.
Results:
A significant nonlinear relation between altitude and systolic blood pressure (SBP) as well as diastolic blood pressure (DBP) was found (both p < 0.001). BP described a j-shaped curve, where the minimum was observed between 750 and 1250 masl, from where both SBP and DBP rose as altitude increased. These associations were independent from sex, age, index of economic wellbeing, body mass index, and years of education. Interestingly, at all altitudes indigenous people had lower SBP and DBP in comparison to mestizos (both p < 0.001).
Conclusions:
Living permanently at altitudes ≥750 masl is associated with higher SBP and DBP in Andean dwellers and this association is modulated by their ethnic background.
Introduction
Regulation of blood pressure (BP) depends on the complex interactions between genetic and environmental factors (Ashraf, 2015). Among environmental factors are those associated with lifestyle and others such as temperature, noise, pollution, and altitude (Brook et al., 2011; Bruno et al., 2017). Altitude can affect BP due to its influence on the availability of O2 for the organism. Acute exposure to moderate/high altitudes (≥2000 masl), as is the case for nonacclimated visitors of highlands, triggers activation of hypoxia-induced chemoreflexes that activate the sympathetic nervous system with a subsequent release of catecholamines (Bärtsch and Saltin, 2008). The initial cardiovascular response is characterized by an increase in cardiac output, tachycardia, and peripheral vasoconstriction, which eventually result in elevated BP levels (Kanstrup et al., 1999; Bärtsch and Gibbs, 2007; Naeije, 2010).
With progressive acclimatization, BP gradually reduces until basal levels are reached, a process that can last weeks or even months (Niu et al., 1995; Kanstrup et al., 1999; Bärtsch and Gibbs, 2007). Moreover, since acclimatization results from adaptations at the genetic and the epigenetic level, it is necessary to analyze populations with different ethnic backgrounds (Childebayeva et al., 2019). So far, only few studies have investigated the effects of chronic exposure to altitude on BP while taking ethnicity into consideration (Hurtado et al., 2012; Mingji et al., 2015; Aryal et al., 2016). In this way, it was found that while in Tibetans BP varies with altitude, in non-Tibetans (including Andean dwellers) such variation of BP related to altitude is not observed (Aryal et al., 2016).
Furthermore, whereas some studies suggest that chronic exposure to altitude is associated with an increase in BP as well as in prevalence of hypertension, others suggest the opposite (Hurtado et al., 2012; Mingji et al., 2015; Aryal et al., 2016). The heterogeneity of these results may be linked to different degrees of adaptation, different duration of time of residence in moderate/high altitudes, different periods during the life cycle of exposure to hypobaric hypoxia, different lifestyle habits, different sociocultural and socioeconomic factors, and/or different genetic factors (Rothhammer, 1987; Kanstrup et al., 1999; Beall, 2007; Mingji et al., 2015; Aryal et al., 2016).
Within this context Ecuador with its various geographical regions and ethnic diversity is a privileged territory for studying the influence of altitude on BP. Being crossed by the Andean Mountains at the level of the equator, Ecuador covers 256,370 km2 in the north west region of South America and is divided into three natural regions seated at different altitudes. The country, in which nearly 16 million people reside, is populated by various ethnic groups, of which the most numerous are “mestizos” (mix of European and Native Americans) and “indigenous people” (Native Americans) (Knapp et al., 2018). The objective of the present study was to study the association between BP and altitude in nonhypertensive Andean adults, who permanently live at different altitudes, and find out to what extent this potential association depends on ethnic background.
Materials and Methods
Study design and setting
The present work is a cross-sectional analytic study. The study sample included people who participated in the ENSANUT-ECU study, which was carried out by the Ministerio de Salud Pública (MSP) and the Instituto Nacional de Estadísticas y Censos (INEC) in Ecuador in 2012. The objective of ENSANUT-ECU was to assess and describe in the Ecuadorian population health outcomes, physical activity, nutritional status, and access to health services, focusing on specific age-target populations. ENSANUT-ECU was carried out countrywide, covering urban and rural areas of the 24 provinces of Ecuador following Belmont Report guidelines; informed consent was obtained from participants (Freire et al., 2014). Data of the study are publicly available and can be downloaded from the INEC web page from the following link: https://www.ecuadorencifras.gob.ec/encuesta-nacional-de-salud-salud-reproductiva-y-nutricion-ensanut-2012
Participants of ENSANUT-ECU
Participants of ENSANUT-ECU were selected by stratified multistage probabilistic sampling performed by clusters (censal sectors). Strata refer to urban and rural areas. During the first stage, 64 censal sectors were selected with a probability proportional to the size of urban and rural areas of each province. During the second stage, from the censal sectors, 12 dwellings were randomly selected. During the third stage, from the 12 selected dwellings, 1 individual from each age-target population was selected by simple random sampling (Freire et al., 2014).
Sample
From the 92,502 people who participated in ENSANUT-ECU, we selected all individuals that had geographic and anthropometric data and were 20 years old or older (n = 29,781). People who did not autoidentify themselves as mestizo or indigenous people (n = 2951), who did not always live in their actual place of residence (n = 10,489), pregnant women (n = 586), people who were diagnosed as hypertensive or had a BP higher than 140/90 mm Hg (n = 2280) were excluded from the study sample. We only included mestizos and indigenous people, because they form the most numerous ethnic groups in Ecuador. Hypertensive individuals were excluded since the main question of this article is to find out to what extent BP is related to altitude under normal circumstances and thus conclusions would have been confounded if these people were included. On the other hand, because several people were living together in the same dwelling and therefore at the same altitude (coinhabitants), we randomly selected one person from each dwelling. As a result, the final study sample included 10,061 persons (Fig. 1).

Study sample calculation.
Variable definition
Altitude
Altitude of each dwelling was measured in meters above the sea level (masl) using a global positioning system (Freire et al., 2014).
Systolic and diastolic blood pressure
Systolic blood pressure (SBP) and diastolic blood pressure (DBP) expressed in mm Hg were measured using digital sphygmomanometers SECA, following international recommendations (Freire et al., 2014). BP was measured twice, with a period of 5 minutes between the recordings. In case the difference of the two measurements were 5 mm Hg or more, a third measurement was performed after another 5 minutes. For the current study, values of SBP and DBP corresponded to the average of the two or three measurements taken.
Ethnic group
Ethnic group was determined by asking the participants: how do you identify yourself according to your culture? Participants could identify themselves as “mestizo” (mixed ethnic ancestry), “indígena” (indigenous people), or another ethnic group (Freire et al., 2014).
Index of economic wellbeing
The index of economic wellbeing (Q) was calculated with the use of principal component analysis of 42 variables related to the characteristics of the dwelling and income (Freire et al., 2014). Q was calculated for each dwelling and was expressed in quintiles from Q1 to Q5. The lower the quintile the lower the economic condition of the dwelling.
Statistical analyses
We considered two main outcome variables (SBP and DBP) and two secondary parameters (pulse pressure [PP] and mean arterial pressure [MAP]), all of which are continuous measures. To model the outcomes we considered one explanatory continuous variable (altitude), one moderator variable (ethnicity), and five potential confounders (sex [males vs. female], age in years, years of education, Q, body mass index [BMI], and area of residence [urban vs. rural]). To investigate the association between SBP, DBP, PP, MAP, and altitude we implemented linear regression models with restricted cubic splines (RCSs).
Implemented RCS regression models determined the shape of the relationship between altitude and outcomes without any prior assumption. RCSs fitted a smooth continuous curve of adjusted means with 95% confidence intervals (95% CIs) across altitude levels. RCSs allowed for changes in the function at defined knot points and restricted the splines to linear relationships at the tail ends. Knot points were located at percentiles 5, 27.5, 50, 72.5, and 95 of altitude, as previously recommended to avoid forcing curvature or inflections (Harrell, 2019). All models were adjusted by the potential confounders listed above.
We also included interaction terms for altitude*ethnicity and altitude*age in each model to determine if the effect of altitude on BP was different between indigenous and mestizos, and between different age levels. There were no statistically significant interactions for altitude*ethnicity or altitude*age nor for SBP or DBP, and so the interaction terms were dropped from the models. Models were adjusted for sampling weights, which were extracted from ENSANUT-ECU. Poststratification weighting method was applied. Goodness-of-fit plots showed that chosen models fitted well with the data (Supplementary Figure S1). All statistical analyses were performed using R, RStudio and related packages available in R, including MASS, sfsmisc, and rms (Venables and Ripley, 2002; Maechler, 2017; R Core Team, 2018; RStudio Team, 2018; Harrell, 2019).
Results
Twenty persons (0.2%) were dropped from the analysis, because of missing values in variables' altitude (n = 3), BMI (n = 15), or index of economic wellbeing (n = 2). Thus, the analyzed sample included 10,041 people, the majority of whom reported having always lived at <1000 masl (49%) or at 2000–3000 masl (36%) (Table 1). Mean age was similar at different altitudes, but average years of education and BMI was slightly lower at >3000 masl in comparison with the other categories of altitude (Table 1). Percentage of women was higher compared with men at all altitudes, being lower at <1000 masl in comparison with the other altitudes (<1000 masl: 56%; 1000–2000 masl: 57%; 2000–3000 masl: 62%; >3000 masl: 66%) (Table 1).
Characteristics of the Population at Different Altitudes
In total 10,061 people were included in the study from whom 20 presented missing values: 15 regarding BMI, 2 regarding index of economic wellbeing and 3 regarding altitude. The final sample included 10,041 people.
BMI, body mass index; M, mean; masl, meters above the sea level; n, number; Q, index of economic wellbeing; SD, standard deviation.
Percentage of indigenous people was lower compared with mestizos at all altitudes; this percentage drastically increased from 8% at 2000–3000 masl to 36% at >3000 masl (Table 1). The distribution of mestizos and indigenous people living at different altitudes can be observed in Table 2, which also shows that in comparison to mestizos, a higher percentage of indigenous people reported having always lived >3000 masl (6% of mestizos vs. 25% of indigenous). Additionally, distribution among Q showed that, at different altitudes (except 2000–3000 masl), most people were living in poverty (Q1 and Q2) (Table 2).
Mean Values of Systolic and Diastolic Blood Pressure, Pulse Pressure, and Mean Arterial Pressure at Different Altitudes by the Ethnic Group
Table also shows distribution of mestizos and indigenous people at different altitudes.
Three missing values are observed in the variable altitude.
DBP, diastolic blood pressure; MAP, mean arterial pressure; PP, pulse pressure; SBP, systolic blood pressure.
Mean SBP of the whole sample was 114.60 mm Hg (SD = 10.22), and mean DBP was 71.45 mm Hg (SD = 7.85). Mean PP and MAP for the whole sample was 43.1 (SD = 7.67) and 85.8 (SD = 7.92), respectively. In general, mean SBP, DBP, PP, and MAP were lower among indigenous people in comparison to mestizos, and these values increased with altitude (Table 2). To study the association of BP, PP, MAP, and altitude we implemented RCSs regression models adjusted by sex, age in years, years of education, Q, and BMI (see Materials and Methods section).
BP and altitude
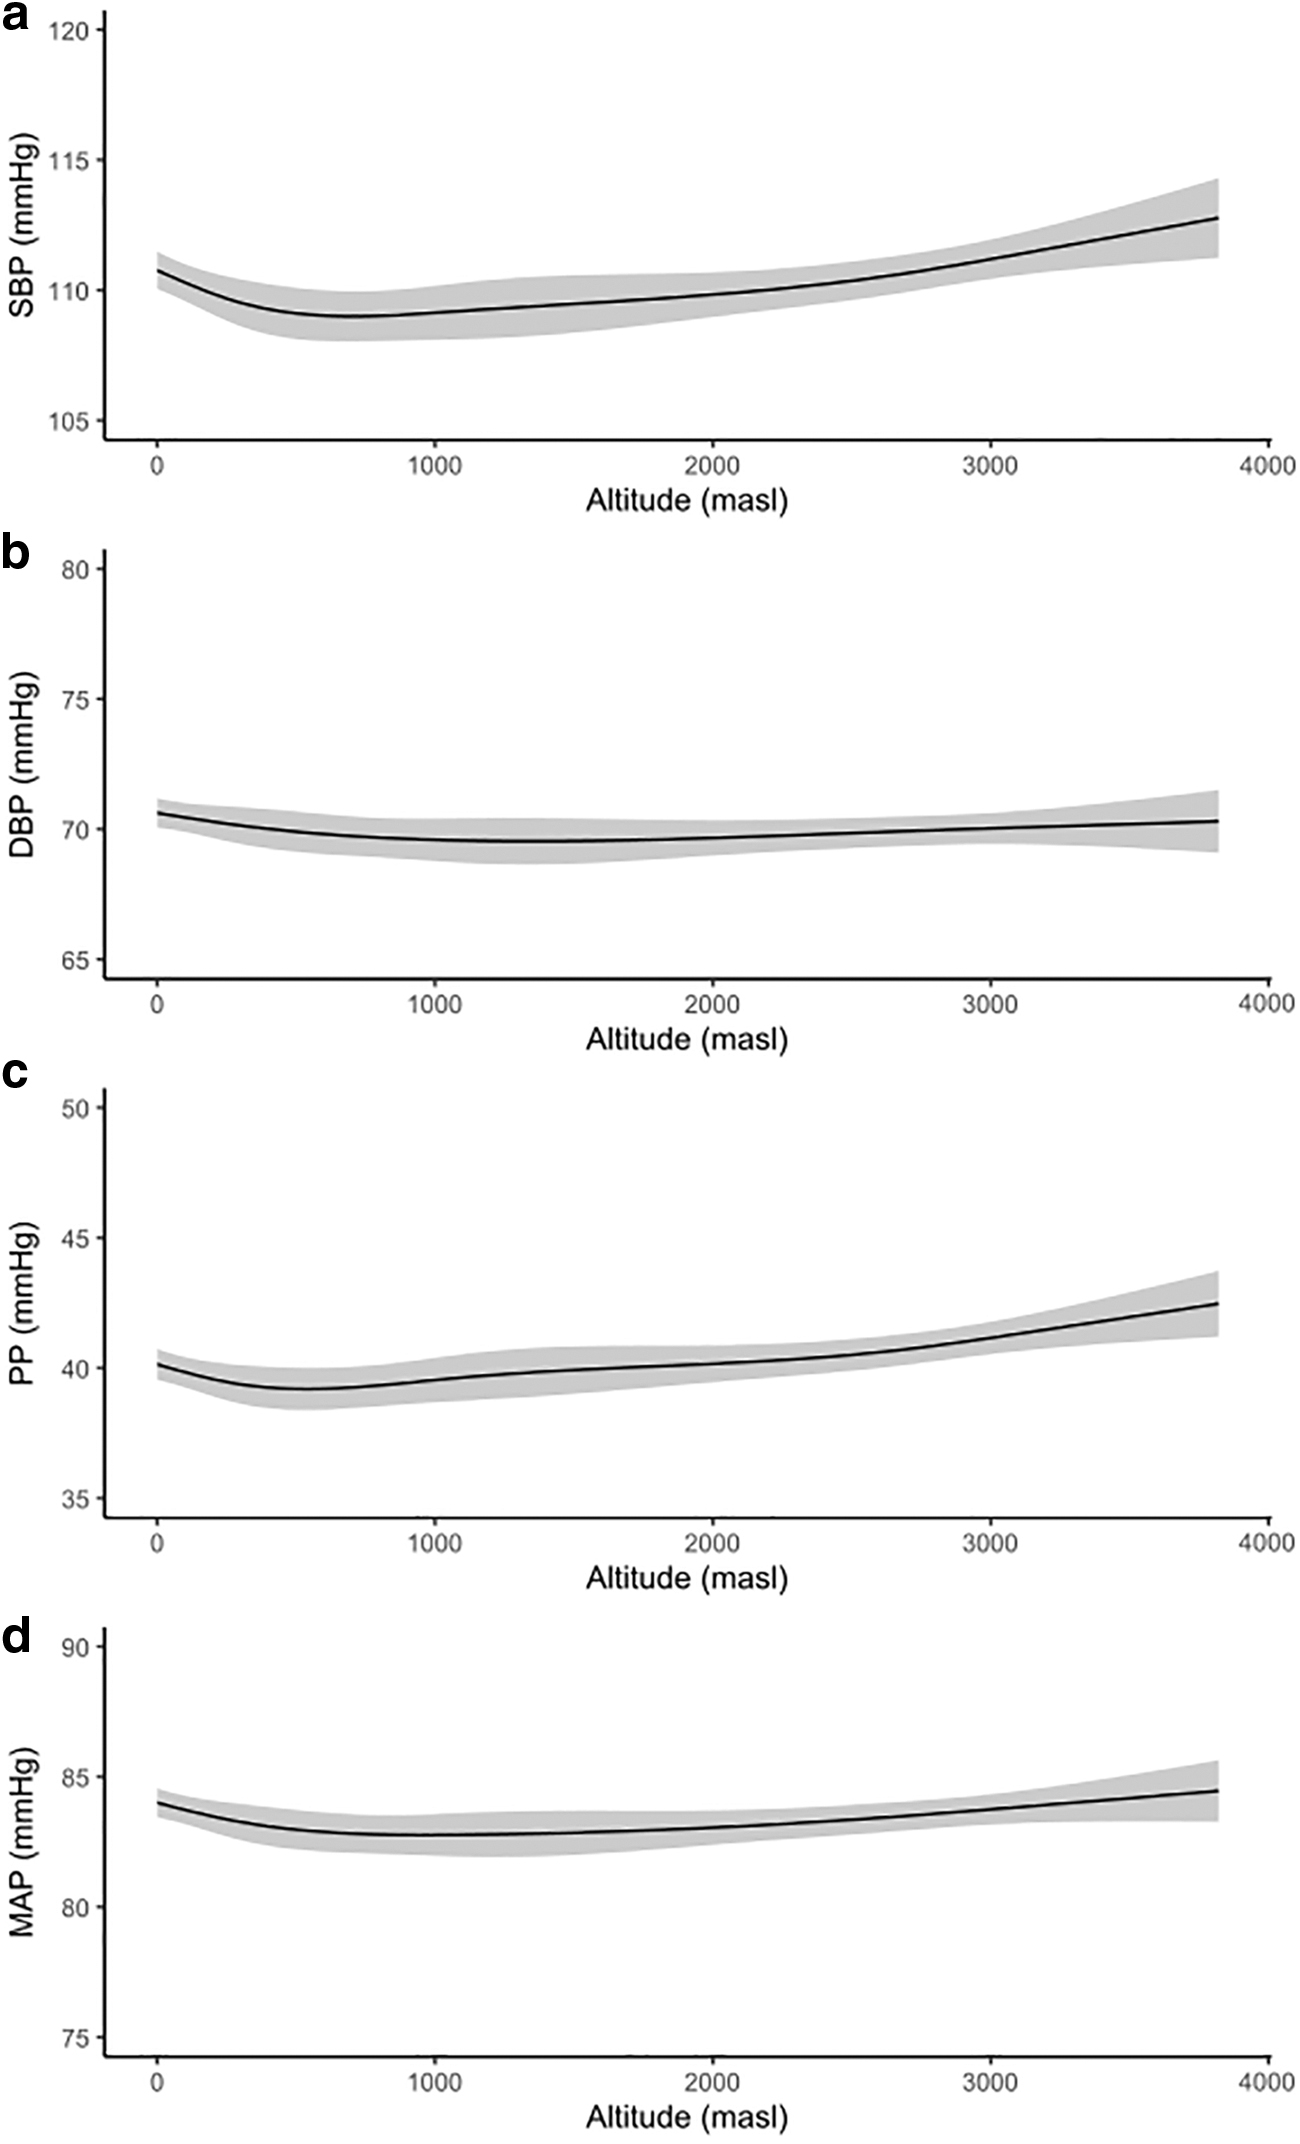
Figure 2 shows multivariate adjusted predicted mean and 95% CIs for regression models with RCSs for SBP, DBP, PP, and MAP. Corresponding predicted mean values and 95% CIs of SBP, DBP, PP, and PAM for percentiles 5 (12 masl), 25 (259 masl), 50 (1068 masl), 75 (2657 masl), and 95 (3142 masl) of altitude are shown in Supplementary Table S1.
Multivariate adjusted predicted mean for the regression models with RCSs for
A significant nonlinear relation between altitude and SBP was found [F(3) = 11.00, p < 0.001]. SBP in relation to altitude showed a j-shaped curve. In fact, it was higher at 0 masl than at 750 masl, where the minimum of SBP was observed (Fig. 2a). After 750 masl, SBP was higher as altitude increased. When analysis was restricted to compare SBP between the minimum point of the curve at 750 masl and percentile 95 of altitude (3142.15 masl), an increase of 2.46 mmHg (95% CI 1.66–3.27) was observed (Fig. 2a).
A significant nonlinear relation between altitude and DBP was also found [F(3) = 3.01, p = 0.029]. DBP also described a j-shaped curve in relation to altitude, although it was less pronounced. In fact, it was higher at 0 masl than at 1250 masl, where the minimum of DBP was observed (Fig. 2b). After 1250 masl, DBP was higher as altitude increased. When analysis was restricted to compare DBP between the minimum point of the curve at 1250 masl and percentile 95 of altitude (3142.15 masl), a nonstatistically significant increase of 0.54 mmHg (95% CI −0.23 to 1.30) was observed (Fig. 2b).
BP and ethnicity and other covariates
SBP was significantly associated with ethnicity [SBP: F(1) = 13.34, p < 0.001]. SBP was 1.54 mm Hg (95% CI −−2.37 to −0.72) lower in indigenous in comparison to mestizos (Fig. 3a). SBP was also significantly associated with sex [F(1) = 1739.36, p < 0.001], age [F(3) = 11.16, p < 0.001], Q [F(1) = 9.31, p = 0.002], BMI [F(3) = 40.26, p < 0.001], and area of residence [F(1) = 7.65, p = 0.006], but not with years of education [F(3) = 2.09, p = 0.099]. In this way, SBP was higher in men in comparison to women (Fig. 3b), increased with age, and BMI (Fig. 3c, e) decreased with Q (Fig. 3d), and was higher at rural in comparison to urban areas (Fig. 3f).

Multivariate adjusted predicted means for DBP are shown by
DBP was significantly associated with ethnicity [SBP: F(1) = 9.17, p = 0.003]. DBP was 1.00 mm Hg (95% CI −1.65 to −0.35) lower in indigenous in comparison to mestizos (Fig. 4a). DBP was also significantly associated with sex [F(1) = 1026.11, p < 0.001], age [F(3) = 17.192, p < 0.001], Q [F(1) = 12.05, p = 0.001], and BMI [F(3) = 27.19, p < 0.001], but not with years of education (F(3) = 0.66, p = 0.578) or area of residence [F(1) = 0.07, p = 0.791]. In this way, DBP was higher in men in comparison to women (Fig. 4b), increased with age and BMI (Fig. 4c, e), and decreased with Q (Fig. 4d).
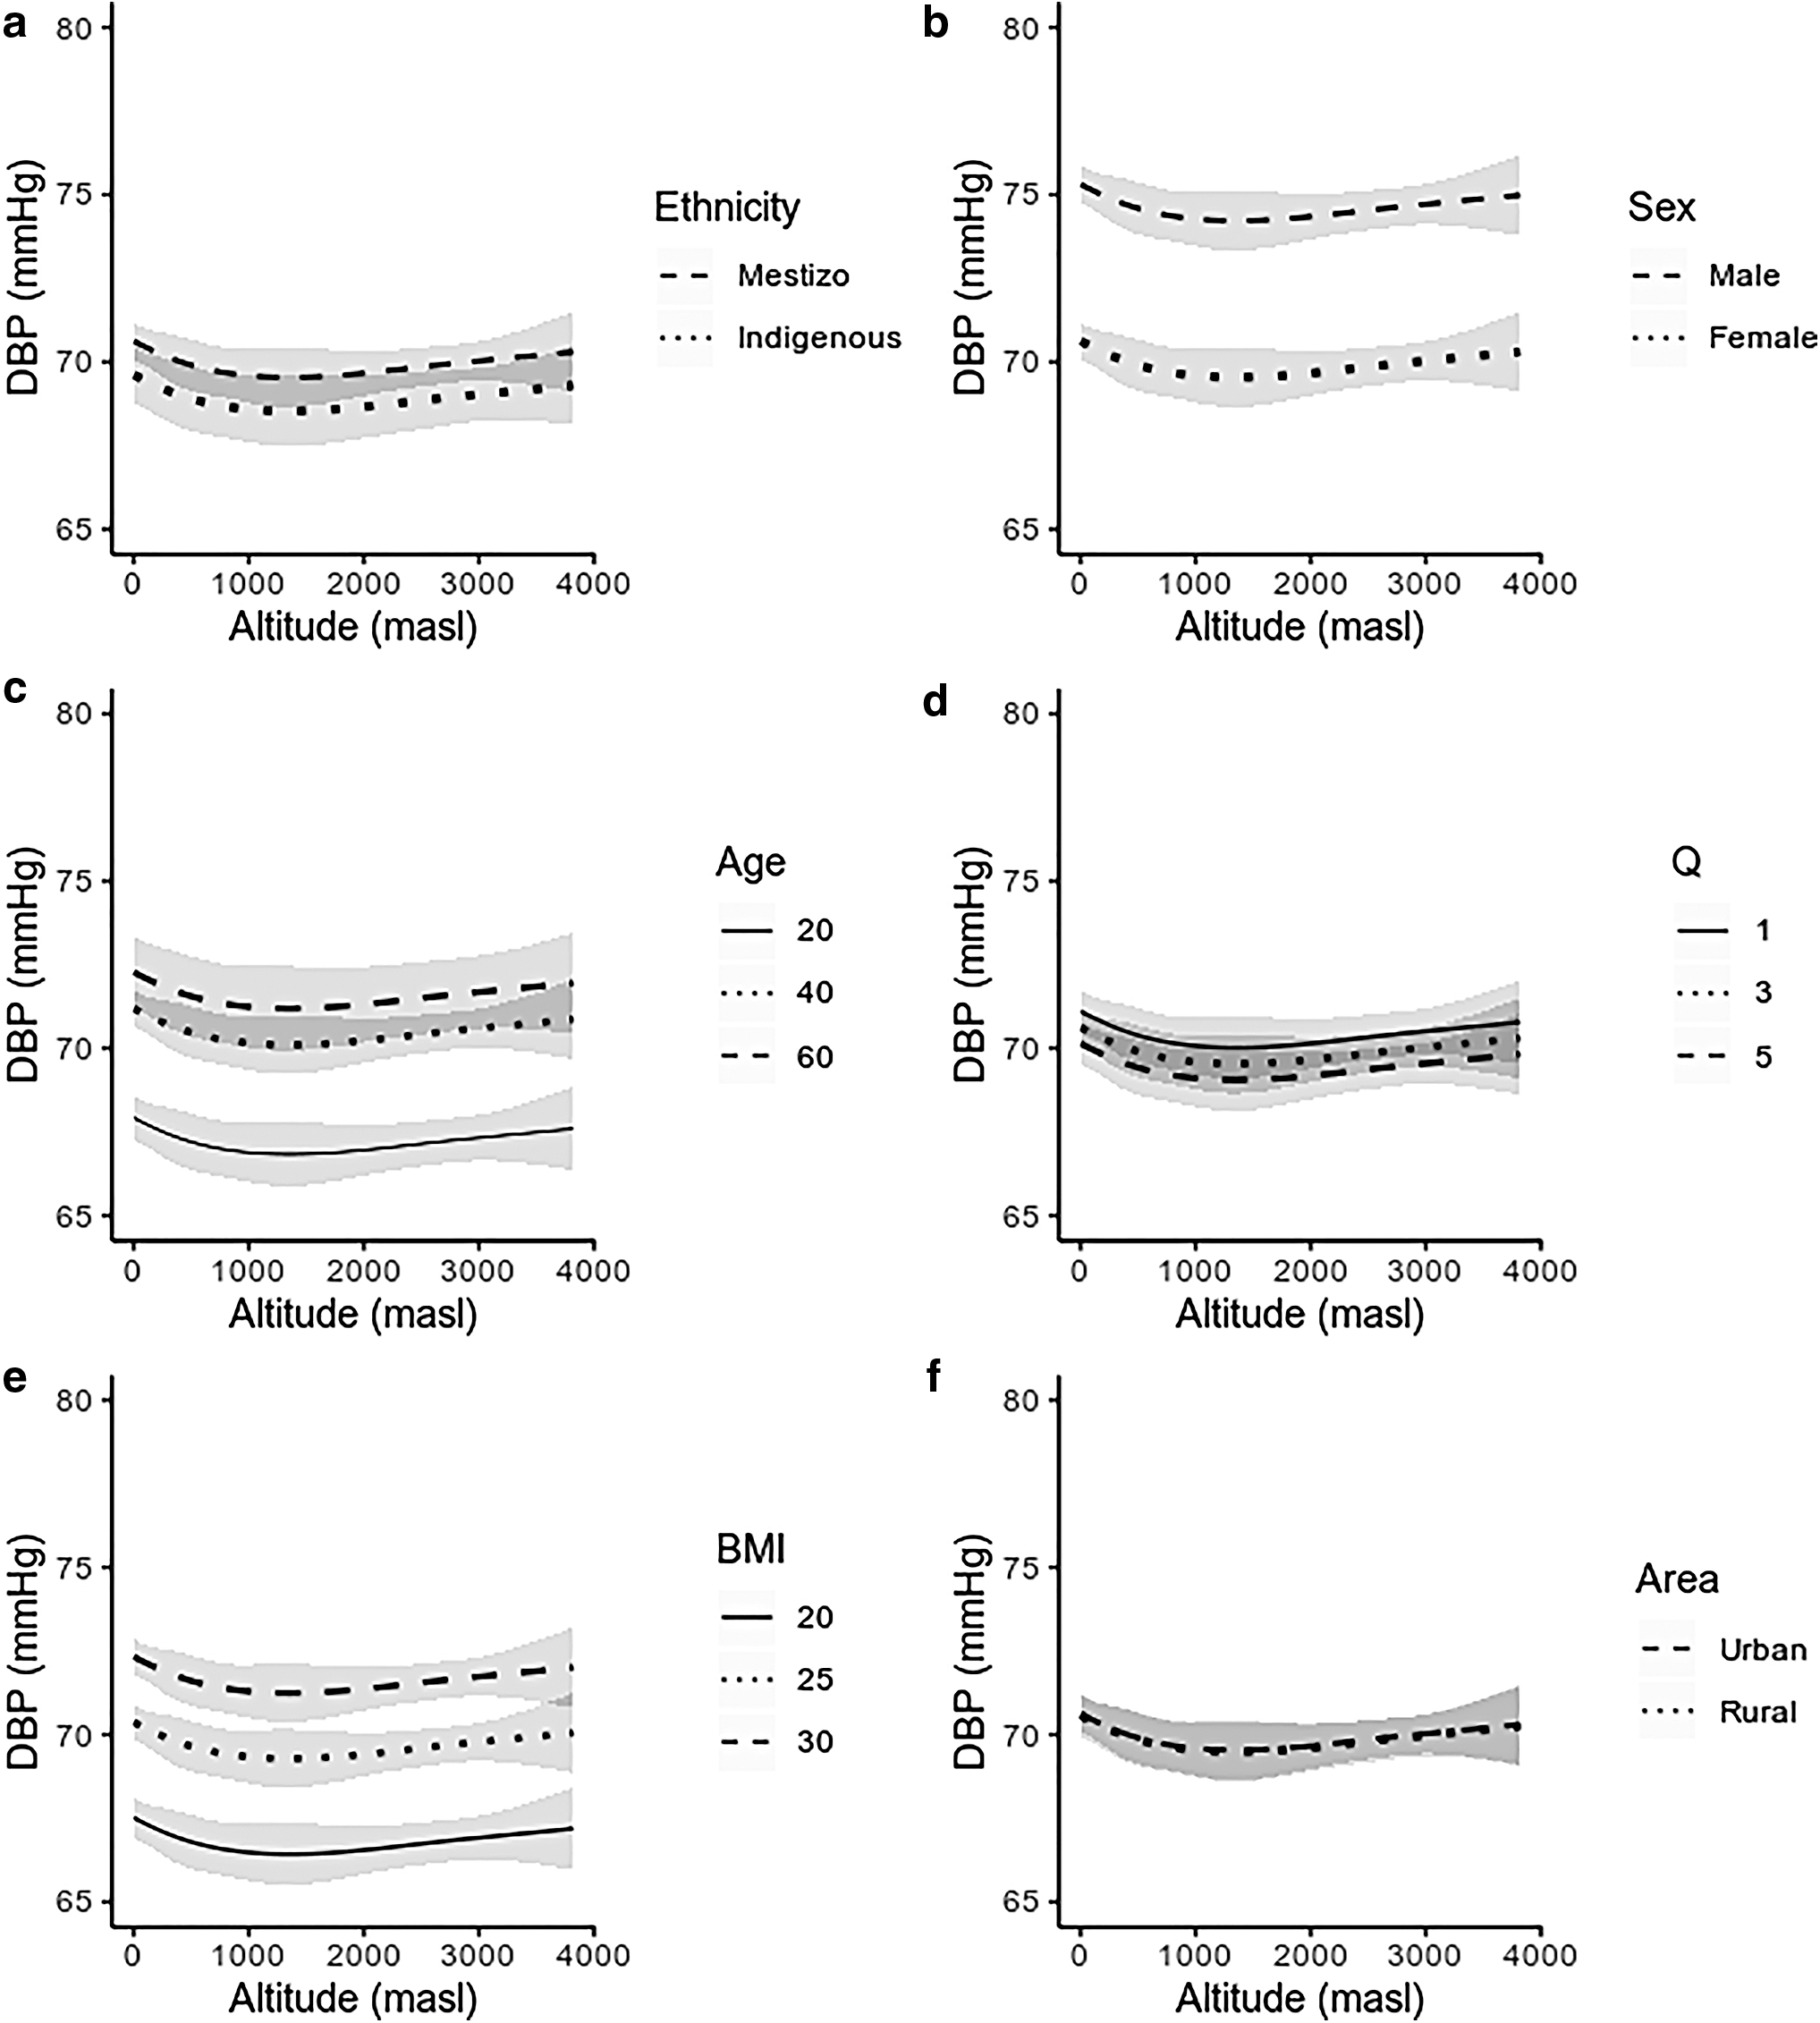
Multivariate adjusted predicted means for DBP are shown by
PP and MAP
A significant nonlinear relation between altitude and PP was found [F(3) = 5.90, p = 0.001]. PP in relation to altitude showed a j-shaped curve. In fact, it was higher at 0 masl than at 500 masl, where the minimum of PP was observed (Fig. 2c). After 500 masl, PP was higher as altitude increased. When analysis was restricted to compare PP between the minimum point of the curve at 500 masl and percentile 95 of altitude (3142.15 masl), an increase of 2.18 mmHg (95% CI 1.46–2.90) was observed (Fig. 2c). PP was significantly associated with sex [F(1) = 403.99, p < 0.001], age [F(3) = 59.99, p < 0.001], BMI [F(3) = 8.03, p < 0.001], and area of residence [F(1) = 13.01, p < 0.001], but not with ethnicity [F(1) = 2.40, p = 0.121], years of education [F(3) = 0.99, p = 0.396], or with Q [F(1) = 0.16, p = 0.692].
A significant nonlinear relation between altitude and MAP was found [F(3) = 6.76, p = 0.001]. MAP in relation to altitude showed a j-shaped curve. In fact, it was higher at 0 masl than at 750 masl, where the minimum of MAP was observed (Fig. 2c). After 750 masl MAP was higher as altitude increased. When analysis was restricted to compare MAP between the minimum point of the curve at 750 masl and percentile 95 of altitude (3142.15 masl), an increase of 1.07 mm Hg (95% CI 0.45–1.69) was observed (Fig. 2d). MAP was significantly associated with ethnicity [F(1) = 13.24, p < 0.001], sex [F(1) = 1585.38, p < 0.001], age [F(3) = 4.60, p = 0.003], BMI [F(3) = 39.41, p < 0.001], and Q [F(1) = 13.53, p < 0.001], but not with years of education [F(3) = 1.38, p = 0.247] or with area of residence [F(1) = 1.03, p = 0.309].
Discussion
The present study investigated the association between BP and altitude in nonhypertensive Andean adults belonging to two of the major ethnic groups in Ecuador, indigenous people and mestizos, who permanently live at different altitudes. Our main finding was that there is a significant association between altitude and BP; this increment was independent of sex, age, years of education, Q, BMI, and area of residence. Furthermore, a close examination of both ethnic groups allowed us to identify an interesting difference: SBP and DBP of indigenous people were lower than those of mestizos.
Other studies have also reported a positive effect of chronic exposure to altitude on BP. Most of them have been performed in human communities permanently living in geographical regions located at moderate/high altitudes (≥1500 masl), including people from Tibet and Ethiopia. Such studies have shown that in Tibetan and Ethiopian dwellers, BP rises as altitude increases (Clegg et al., 1976; Aryal et al., 2016). Furthermore, two systematic reviews have reported that in dwellers of Tibet the prevalence of hypertension increases with altitude (Mingji et al., 2015; Aryal et al., 2016). Even so, the effect of altitude on BP is modified by genetic, cultural, and lifestyle factors, among others (Baker, 1969; Makela et al., 1978), which may well explain why debates about the relation between altitude and BP in Andean indigenous communities are still ongoing (Baker, 1969; Makela et al., 1978; Lindgärde et al., 2004; Aryal et al., 2016). Furthermore, such factors may also explain the j-shaped curve described by BP in relation to the increase of altitude.
Why is the response of BP to the increase of altitude different between indigenous people and mestizos?
Our findings showed differences between indigenous people and mestizos regarding the effect of altitude on BP. For example, BP of indigenous people was lower compared with mestizos. To our knowledge, this is the first study that reports such differences in BP between nonhypertensive mestizos and indigenous people in Ecuador. A possible explanation is that indigenous people have indeed developed specific physiological adaptations in response to hypoxia that are likely inherited from generation to generation. Such specific physiological adaptations probably depend on genetic variations, the identification and nature of which have recently begun to be investigated. For example, Hyndman et al. (2002) and Kumar et al. (2015) reported that a point genetic variation (Thymine 786—Cytosine) in the Endothelial Nitric Oxide Synthase 3 gene (eNOS3) is associated with a higher SBP, but not DBP (Hyndman et al., 2002; Kumar et al., 2015). eNOS3 is involved in the synthesis and release of nitric oxide (NO) from the vascular endothelium, where it plays an important role in regulating the vascular tone and thereby BP. This genetic variation has recently been identified in Tibetans and could explain why their BP increases as altitude increases. However, it is not known whether similar genetic variations are also present in Andean dwellers, and it will have to be investigated to what extent such potential variations may also contribute to the difference in the BP among indigenous people and mestizos.
Clinical implications
Genetic variations such as those involved in O2 regulation, erythropoietic response, or NO production and their subsequent effects on BP, could endow indigenous people with flexible physiological mechanisms to adapt to altitude (Winslow et al., 1989; Bigham et al., 2009; Yi et al., 2010; Moore, 2017). Although hypoxic and hypobaric conditions are known to lead to functional adaptations of the organism that optimize O2 transport with a secondary effect on BP, their specific implications for susceptibility to suffer from cardiovascular diseases are still debated.
For example, whereas some studies suggest that hypoxia may directly reduce the prevalence of hypertension in Andeans, others indicate the opposite (Ruiz and Peñaloza, 1977; Baker, 1969; Mingji et al., 2015; Aryal et al., 2016). Culturally driven dietary or lifestyle habits plus genetic susceptibility may be the main reason behind this controversy. Such factors may also explain why the prevalence of hypertension is lower in Tibetan monks, who generally have a healthy lifestyle (Li et al., 2015). Thus, habits related to education, healthy diet, and lifestyle, may all contribute to BP and interact with factors that are triggered by changes in altitude.
Implications for public health
While the prevalence and absolute burden of hypertension is increasing globally, the awareness of hypertension and the relevance of its treatment and control are unacceptably low (Mills and Stefanescu, 2020). This may be particularly relevant for countries with low and medium income, such as Ecuador, where the increase in the prevalence of this disease is even greater with respect to high-income countries (Mills and Stefanescu, 2020). Therefore, our findings suggest that health policies in countries like Ecuador should be applied with great attention and even be reformulated to be sensitive to ethnic variations.
Limitations and methodological considerations
There may be several aspects that could interfere with our findings, such as health status and salt consumption of interviewed people. For instance, our models were adjusted by sex, age in years, years of education, index of economic wellbeing and BMI, but not by biochemical indicators of cardiovascular risk or salt consumption. We did not include such variables, because information on this regard was available only for half of the sample. Another limitation of the present study concerns the method that was used to categorize people as mestizo or indigenous in the ENSANUT-ECU study. Belonging to a particular ethnic group was determined by asking each individual how he/she identifies his/herself according to his/her culture and not by performing a genetic analysis. So our study could suffer from information bias. People may autoidentify themselves as mestizo instead of indigenous to prevent “social stigma.”
Further research and recommendations
More studies should be performed to help to better understand our findings. Further research should focus on investigating the influence of genetic, physiological, environmental, and lifestyle factors on BP and cardiovascular susceptibility taking ethnicity into consideration.
Conclusions
Our main finding was that SBP, DBP, PP, and MAP increased with altitude in Andean dwellers in a nonlinear fashion, and that such increment was independent from from sex, age, years of education, Q, BMI, and area of residence. Furthermore, a close examination of ethnic groups allowed us to identify one interesting difference: SBP and DBP of indigenous people were lower than those of mestizos.
Footnotes
Author Contributions
The main author of this work declares that all authors have contributed and work on the development of it as follows: Andrés Fernando Vinueza Veloz, MD: Conception and design, analysis and interpretation of data, drafting of the article, and final approval of the version to be published. Dr. Aymaru Kailli Yaulema Riss: Conception and design, analysis and interpretation of data, drafting of the article, and final approval of the version to be published. Prof. Dr. Chris I. de Zeeuw: Critical revision for important intellectual content, and writing and final approval of the version to be published. Dr. Tannia Valeria Carpio Arias: Critical revision for important intellectual content, and final approval of the version to be published. María Fernanda Vinueza Veloz: Conception and design, analysis and interpretation of data, drafting of the article, critical revision for important intellectual content, and final approval of the version to be published.
Acknowledgments
The authors would like to thank the School of Medicine and the Faculty of Public Health of the Escuela Superior Politécnica de Chimborazo (ESPOCH) and the Secretaría Nacional de Educación Superior e Investigación (SENESCYT) for their support. Special thanks are given to Dra. Silvia Proaño Lucero and Dra. Paulina Robalino Valdivieso for their professional feedback and support. C.I.D.Z. is supported by the Dutch Organization for Medical Sciences (ZonMw), Life Sciences, and Social and Behavioral Sciences, NeuroBasic, Medical NeuroDelta, INTENSE as well as ERC-adv and ERC-POC of the EU. The authors also thank Carlos Martin Román, Silvia Gonzales, and Marco Gonzales for their technical support.
Author Disclosure Statement
No competing financial interests exist.
Funding Information
The authors received no financial support for the research, authorship, and/or publication of this article.
References
Supplementary Material
Please find the following supplemental material available below.
For Open Access articles published under a Creative Commons License, all supplemental material carries the same license as the article it is associated with.
For non-Open Access articles published, all supplemental material carries a non-exclusive license, and permission requests for re-use of supplemental material or any part of supplemental material shall be sent directly to the copyright owner as specified in the copyright notice associated with the article.