
Abstract
Background:
There are ∼83 million people living at high altitude (>2500 m) worldwide who endure chronic hypoxia conditions. This article aims to analyze the relationship between high altitude, identified in several cities in Ecuador, and the prevalence of congenital heart disease (CHD).
Methods:
Set in Ecuador, this epidemiological observational cross-sectional study analyzes data over a range of 18 years (from 2000 to 2017), including 34,904 reported cases of CHD, with a mean of 1939 cases per year.
Results:
The mean prevalence rate of CHD found is 70.6 per 10,000 live newborns. A K-means analysis resulted in three clusters. Cluster 1 shows the lowest altitude and prevalence of CHD, with an average of 2619 m and 63.02 cases per 10,000 live newborns. Cluster 2 presents the second highest altitude and prevalence of CHD, with an average of 2909 m and 72.04 cases per 10,000 live newborns. Cluster 3 shows the highest values of altitude and prevalence of CHD, with an average of 3176 m and 86.62 cases per 10,000 live newborns. Pearson's coefficient is 0.979, so the correlation between the variables is positive. An altitude ranging from 2500 to 2750 m relates to a prevalence of CHD of ≤71 cases per 10,000 live newborns. An altitude ranging from 2751 to 3000 m relates to a prevalence of CHD of >71 and <89 cases per 10,000 live newborns. An altitude ranging between 3001 and 3264 m relates to a prevalence of CHD of ≥89 cases per 10,000 live newborns.
Conclusions:
The findings show that high altitude (>2500 m), ethnicity (Native American), rural locations, and limited access to health care are factors that influence and increase the prevalence rate of CHD. A correlation coefficient of 0.914 shows the direct relationship between high altitude and prevalence rates of CHD. For each year elapsed, the prevalence of CHD increased by 3.33 cases per 10,000 live newborns.
Introduction
High-altitude hypoxia occurs at elevations >2500 m above sea level because of decreased oxygen availability brought on by lowered barometric pressure at high elevations (Azad et al., 2017). This poses a number of challenges to human health, survival, and reproduction. It is estimated that there are ∼83 million people living at high altitude, in various locations such as the Qinghai–Tibetan Plateau, the Andean Altiplano, and the Semien Plateau in Ethiopia (Bigham, 2016). Populations in these areas have lived under chronic hypoxia conditions for thousands of years, and show chronic adaptation to altitude (Bigham and Lee, 2014). They include the Sherpa and Ayurveda (Qinghai–Tibetan Plateau), the Kichwa and Aymara highlanders (Andean Altiplano), and the Ethiopian Amhara and Oromo highlanders (Semien Plateau in Ethiopia) (West, 2017).
The most important physiological adaptations include changes in pulmonary function, arterial oxygen saturation (SaO2), hemoglobin concentration, and maternal physiology during pregnancy (Chun et al., 2019). Several studies (Castilla et al., 1999; Luquetti et al., 2013) have associated these changes with congenital defects, especially congenital heart disease (CHD) and microtia/anotia (Gonzalez-Andrade et al., 2010). Another study proposed that high-altitude adaptation is one of the strongest instances of natural selection acting on humans (Huicho and Niermeyer, 2006). Among Andean populations, phenotypes are characterized by no increase in resting pulmonary ventilation, a decrease in hypoxic ventilatory response, and an increase in SaO2, hemoglobin concentration, and birth weight (Castilla and Adams, 1996).
Chronic hypoxia under the pressure of natural selection may be due to specific mutations that confer an evolutionary advantage upon the population under selection, in relation to other control populations (Ambale-Venkatesh et al., 2017). From the point of view of the Mendelian genotype, the selection would lead to a difficult sweep, or to a soft and selective sweep with foot variations (Brutsaert, 2016).
Despite research undertaken to understand cardiac development and the identification of many related genes, the fundamental etiology for most cases of CHD remains unknown (Lopez-Camelo and Orioli, 1996). The literature describes several risk factors, such as folic acid insufficiency, increased nuchal translucency during the first trimester, assisted reproductive technology, maternal diabetes or obesity, maternal hypertension, and maternal antihypertensive medication, among others. Genetic causes produce ∼45% of CHD cases, both isolated and in syndromes (Miao et al., 1988; Crawford et al., 2017; Alderman et al., 1995). Low heritability patterns suggest that environmental factors, such as altitude, rather than genetic factors, play an essential role in the incidence of CHD (Zheng et al., 2017). Nongenetic causes for impairment of normal heart development include viral infections, maternal exposure to alcohol, drugs, environmental teratogens, metabolic disturbances, rubella, measles, exposure to chemicals, and maternal systemic lupus erythematosus (Chen et al., 2009; Fernández et al., 2016).
The purpose of this article is to analyze the relationship between high altitude, identified in several cities in Ecuador, and the prevalence of CHD. Ecuador is uniquely suited for this analysis for three reasons: first, it is demographically multiethnic and multicultural, with 3 main ethnic groups and 13 Native Amerindian nationalities; second, 10 of its 24 provinces are located >2500 m; and third, there is a marked inequality among its inhabitants (Santangelo et al., 2017).
Methods
Study design
This is an epidemiological, observational, and cross-sectional study.
Setting
Ecuador
Data analyzed was from 2000 to 2017, showing 34,904 cases in 18 years. ICD-10 codes Q20 to Q28 were analyzed to classify CHD.
Variables
The variables were number of cases of CHD, prevalence group, province, prevalence rate, year, and high-altitude locations.
This study did not analyze the subgroups according to gender and age groups, because the existing information is too large and merits making a new statistical analysis and drafting a new article. In relation to ethnicity, and age at diagnosis, this database does not include this subdivision.
Data sources
Data regarding the prevalence of hospital discharges were provided by the National Institute of Statistics and Census (INEC). At present, this is the only source for this information available in the country. Cases considered suitable for this study included all children born in Ecuador from January 1, 2000, to December 31, 2017.
The information that exists in the INEC database includes the final diagnoses upon discharge from the patients in each health facility. The diagnosis in each site varies, although the majority of patients are identified by clinical diagnosis at birth and finally diagnosed by echocardiography. Pulse oximetry is not a routine practice for diagnosing CHD in most health facilities in Ecuador. In a previous study (González-Andrade et al., 2018), our research team determined that CHD can only be partially diagnosed. Identifying those with oxygen saturation <90% after three successive measurements or a pre- and postductal oxygen difference of >3% resulted in successful identification of atrial septal defect (ASD) and patent ductus arteriosus (PDA). It is necessary to implement new cutoff points in saturation values to identify critical cardiac anomalies in cities placed at a high altitude. Pulse oximetry should be recommended, as a routine practice, in all newborns. Initially all patients were diagnosed by physical examination at birth, and after the findings were confirmed with echocardiography. Physical examination consisted in cardiac auscultations and clinical manifestation screening. An echocardiography was performed to confirm and identify the subtype of CHD.
Bias avoidance
The same person always collected the information using a standardized data collection sheet.
Interobserver variation, defined as the amount of variation between the results obtained by two or more observers examining the same material, could not be fully controlled because the training of Ecuadorian doctors in this field is heterogeneous. However, when the confirmation of diagnosis was made with ultrasound, in most cases, it was reduced due to the high reliability of the method itself.
Statistical analysis
The goal was to calculate the prevalence rate per 10,000 live newborns. To determine the correlation between altitude and the prevalence of CHD, the selected cities were first categorized by altitude to obtain homogeneous samples without significant variations between them. This was accomplished by using the hierarchical cluster and the centroid-based clustering methods. Possible cluster solutions were determined, and after defining the number of clusters, a K-means analysis was carried out to obtain city clusters, as well as their centers and means, based on altitude and the prevalence of CHD. Subsequently, Pearson's correlation was used to measure the strength of the relationship and determine whether it was linear. Finally, correspondence analysis was used to validate the categorization, the cluster centers or means, and the correlation. Statistical significance was determined if p-value <0.05. Using the means or centers of the altitude clusters and the prevalence of CHD, clusters were categorized as follows: altitude from 2500 to 2750 m, from 2751 to 3000 m, and from 3001 to 3264 m; prevalence of CHD ≤71 cases per 10,000 live newborns, >71 and <89 cases per 10,000 live newborns, and ≥89 cases per 10,000 live newborns.
Results
Table 1 shows the distribution of number of CHD cases per year and prevalence rates from 2000 to 2017. The mean prevalence rate of CHD found was 70.6 per 10,000 live newborns. Table 2 gives the distribution of number of cases in the highest cities and prevalence rates from 2008 to 2017. Table 3 gives the distribution of number of cases by highest prevalence rate and the average altitude of each city from 2008 to 2017.
Distribution of Number of Cases of Congenital Heart Disease by Year and Prevalence Rate Since 2000–2017
Rate calculated by 10,000 newborns.
LNB, live newborns.
Data source: Institute of Statistics and Census (INEC).
Elaboration and analysis: author.
Distribution of Number of Cases by Highest Cities and Prevalence Rate of Congenital Heart Disease Since 2008–2017
Rate calculated by 10,000 newborns.
masl, meters above sea level.
Data source: Institute of Statistics and Census (INEC).
Elaboration and analysis: author.
Distribution of Number of Cases by Highest Prevalence Rate and Average Altitude of the City Since 2008–2017
Rate calculated by 10,000 newborns.
Data source: Institute of Statistics and Census (INEC).
Elaboration and analysis: author.
Using K-means analysis, three clusters formed by the following cities were identified:
Cluster 1: Latacunga, Guano, Suscal, San Fernando, Salcedo, Déleg, Guaranda, Biblián, Bolívar, Pelileo, Cuenca, Otavalo, Saraguro, Azogues, Ambato, and Sangolquí. Cluster 2: El Ángel, Huaca, El Tambo, Tulcán, Quero, Pujilí, Machachi, Saquisilí, Cevallos, Tabacundo, San Gabriel, Quito, Cayambe, Píllaro, and Riobamba. Cluster 3: Mocha, Tisaleo, Cajabamba, Pucará, Cañar, and Guamote.
Cluster 1 was characterized by the lowest altitude and prevalence of CHD; the average was 2619 m and 63.02 cases per 10,000 live newborns. Cluster 2 showed the second highest altitude and prevalence of CHD, with an average of 2909 m and 72.04 cases per 10,000 live newborns. Cluster 3 showed the highest values of altitude and prevalence of CHD, with an average of 3176 m and 86.62 cases per 10,000 live newborns (Tables 1 and 2).
This categorization of cities based on altitude and the prevalence of CHD revealed a strong correlation between both variables. Pearson's coefficient was 0.979, so the correlation between them is positive, meaning that as altitude increased, so did the prevalence of CHD. This correlation was not linear since the p-value was >0.05.
Table 3 gives the distribution of number of cases by highest prevalence rate and average altitude of the city since 2008–2017. Table 4 gives the distribution of group parameters and the correlation between variables.
Distribution of the Parameters of the Groups and Correlation Between the Variables
Important Pearson correlation force.
SD, standard deviation.
Source: author.
Figure 1 shows the dendrogram where solutions with two or three clusters are displayed, with three clusters being the option that offers better discrimination between altitude and the prevalence of CHD. Figure 2 shows the categorization and correlation force through the correspondence analysis, for which the variables of altitude and prevalence of CHD were projected in the two-dimensional space. The results show that an altitude ranging from 2500 m to 2750 m relates to the prevalence of CHD in ≤71 cases per 10,000 live newborns. An altitude ranging from 2751 to 3000 m relates to the prevalence of CHD in >71 and <89 cases per 10,000 live newborns. An altitude ranging from 3001 to 3264 m relates to the prevalence of CHD in ≥89 cases per 10,000 live newborns.

Dendogram based on altitude and prevalence of CHD. Note: based on hierarchical cluster. CHD, congenital heart disease. Source: author.
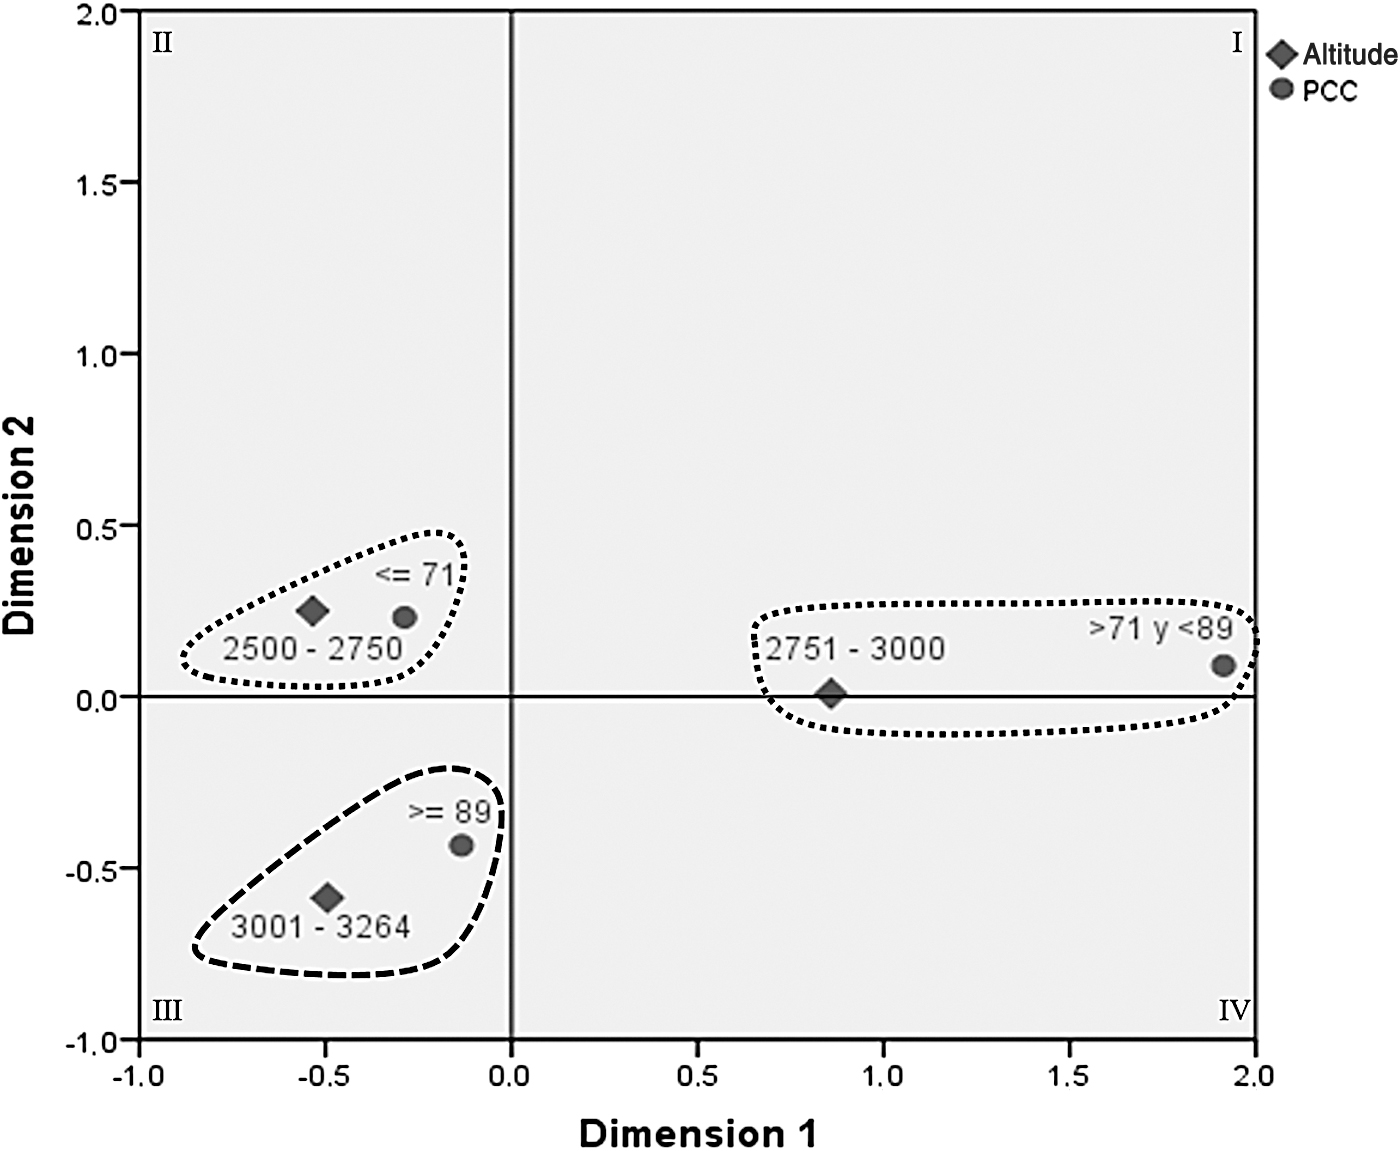
Correspondence analysis based on altitude and prevalence of CHD. PCC, prevalence of CHD. Elaboration: author.
In the analysis of the prevalence time series, it was observed that during the period from 2000 to 2017, the linear relationship in the prevalence of CHD shows a p-value of 0.000, where the correlation coefficient 0.914 shows that the relationship has been direct. This means that the prevalence of CHD shows a tendency toward growth. In the linear regression model, it was observed that, for each year elapsed, the prevalence of CHD increased by 3.33 cases per 10,000 live newborns, as shown in Figure 3. Figure 4 shows the distribution map by provinces of CHD by diagnostic group.
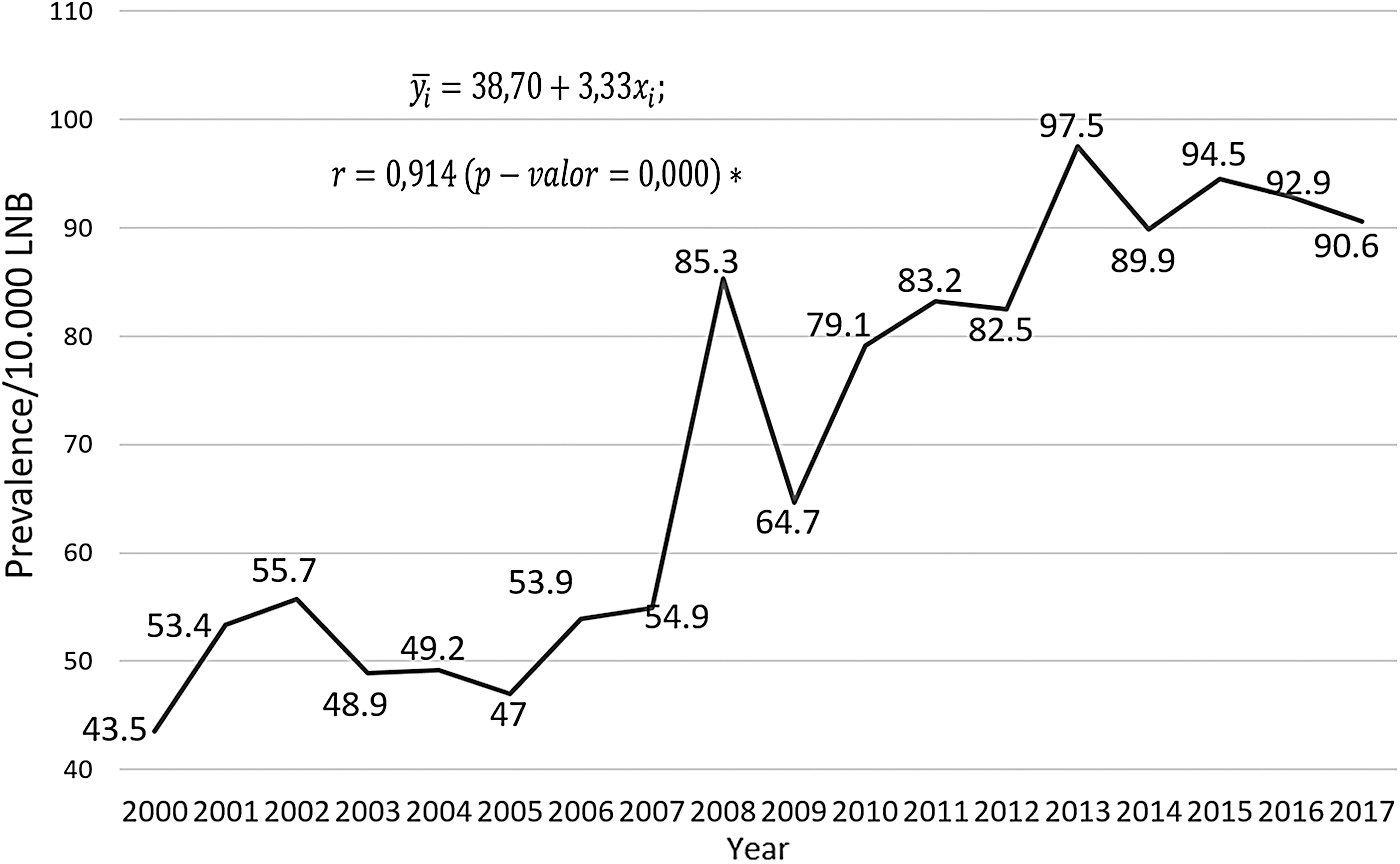
Time series of the prevalence of CHD during 2000–2017. *Significant correlation, based on the regression model. Source: author.

Distribution map of the number of cases by highest cities and prevalence rate since 2008–2017.
Apparently, the prevalence of CHD in this study of 70.6 per 10,000 live births is lower than that of the general population, which is 80 per 10,000 live births. This could be confusing. However, Table 3 gives 10 cities in which the prevalence is higher than the highest prevalence reported worldwide, in Asia. You can also see five cities in which the prevalence is higher than the average prevalence in the world. This explains that the high altitude is significant in the appearance of CHD. Of course, more thorough studies are needed to ratify this assertion.
It is not possible that some cases might have been missed, leading to lower average prevalence because the database collects all existing information. Ecuador is a relatively small country that facilitates the capture of information.
Discussion
The mean prevalence rate of CHD found was 70.6 per 10,000 live newborns. This value is similar to those of most countries in the world. However, if a comparison is made between the clusters previously described, as given in Table 3, a strong correlation between altitude and prevalence can be identified. Pearson's coefficient was 0.979, so the correlation between variables is positive. This means that as altitude increases, so does the prevalence of CHD. This correlation was not linear since the p-value was >0.05.
High altitude >2500 m, ethnicity (Native American), and rural locations are factors that influence and increase the prevalence rate of CHD. It is a fact that the highest prevalence rate reported in developed countries is 125 per 10,000 live newborns. In contrast, Ecuador reports higher prevalence rates between 128.5 and 497.9 cases per 10,000 live newborns. This is a significant difference that coincides with the hypothesis that high altitudes could increase the prevalence of CHD. Another important factor is that higher prevalence rates are most frequent in rural areas. One can observe that the prevalence rates are heterogeneous; the distribution by altitude clusters shows the differences.
Although these findings remain a hypothesis, it is evident that there is causality between CHD and high altitude. In addition, access to health services is also heterogeneous, so there would be a bias in larger cities where higher prevalence rates are present due to the national health care referral system. Despite this, the town of Nabón in the province of Azuay, located at 2864 m, shows a prevalence of 497.9 per 10,000 live newborns. This rate is extremely high and could be explained by the fact that the local population has limited access to health services and, therefore, the prevalence of CHD could be due to lack of adequate prenatal control. However, high altitude could also be the direct cause of this high prevalence.
This study includes all Ecuadorian cities >2500 m. The towns of Nabón (15,121 inhabitants), Mocha (1209), Pucará (1200), and Quero (11,544), which are small in terms of number of inhabitants, show the highest prevalence of CHD. They are semirural villages with the majority of the population being Native American. This could also explain the presence of an ancestral ethnic component as a causal factor.
It found increased prevalence of CHD in recent years compared with early 2000s. This is explained by three reasons: (1) increased access to health facilities, (2) increase in the number of doctors specializing in pediatrics and pediatric cardiology, (3) improvement of clinical diagnostic and ultrasound methods.
Unique environments characterize the places located at high altitude; one such characteristic is low air compressibility. Although the amount of oxygen remains constant, 20.93%, at both high and low altitudes, the number of gaseous molecules per unit volume is greater at lower altitudes than at higher altitudes. Therefore, barometric pressure, which depends on the concentration of molecular air, has an inversely proportional relationship with the altitude at which it is measured. This particular pressure follows a nonlinear trend.
It is worth noting that adaptation to chronic hypoxia is polygenic and implies the presence of several biological pathways. In addition, geographically isolated populations could have developed different physiological and genetic adaptation mechanisms. An alternative strategy explores the fact that adaptation to hypoxia in humans is relatively recent (<1000 generations), with a strong natural selection, which coincides with the arrival of populations to the South American continent ∼14,000 years ago. The polymorphic regions under selection have long haplotypes with low genetic diversity. It has been described that >1000 genes are potentially involved in chronic hypoxia due to high altitude.
The results show that an altitude ranging from 2500 to 2750 m relates to the prevalence of CHD in ≤71 cases per 10,000 live newborns. An altitude from 2751 to 3000 m is related to the prevalence of CHD in >71 and <89 cases per 10,000 live newborns, whereas an altitude from 3001 to 3264 m was related to the prevalence of CHD in ≥89 cases per 10,000 live newborns. In summary, the higher the altitude, the higher the prevalence.
In the analysis of the prevalence time series, it is observed that during the period from 2000 to 2017, the linear relationship in the prevalence of CHD has a p-value of 0.000, wherein the correlation coefficient 0.914 shows that the relationship has been direct. This means that the prevalence of CHD has a tendency toward growth. In the linear regression model, it is observed that for each year elapsed, the prevalence of CHD increased by 3.33 cases per 10,000 live newborns.
The most important and largest study performed in Tibet populations >3000 m has shown that high altitude is a significant environmental risk factor for CHD, especially patent ductus arteriosus. Women showed high prevalence in comparison with men. They found a prevalence of 52.1 per 10.000 in children students of both genders (Chun et al., 2019). Another study showed a wide variation in CHD prevalence and composition existed in Tibetan children among different altitudes with no clear differences (Zheng et al., 2013). However, the CHD prevalence and composition differed significantly between populations of school children living above and below 4200 m (Zheng et al., 2017). At altitudes of 3500–4100 m and 4548, children from 4200 to 4900 m were compared for CHD prevalence (120.9 vs. 43.2 per 10,000, p < 0.001), patent ductus arteriosus and atrial septal defect were most frequent. The differences were more remarkable in women, who had slightly and insignificantly greater prevalence of total CHD, PDA, and ASD than men. In summary, in Tibet a direct relationship between high altitude >3000 m and CHD has been demonstrated, mostly in women, the PDA being the most frequent pathology.
Functional experimentation is needed to answer chronic adaptation questions associated with high-altitude exposure. Greater knowledge regarding the identification of epigenetic modifications is necessary to gain further insight into the molecular mechanisms of adaptive changes in Andean populations. Such knowledge is important to understand biological traits and their genetic control on human patterns, origins, and the evolutionary forces that maintain them.
Results
Limitations of the study
Unfortunately, the only existing database is the one maintained by the INEC. This database only reports hospital discharges from all over the country, which means that there is a tendency toward patient selection. However, the database is quite complete and, although it does not reflect some specificities, it has national coverage. Targeted and well-designed studies are required to confirm these results.
Conclusions
High altitude >2500 m, ethnicity (Native American), rural locations, and limited access to health care are factors that influence and increase the prevalence rate of CHD. A correlation coefficient of 0.914 shows the direct relationship between high altitude and CHD prevalence rates. For each year elapsed, the prevalence of CHD increased by 3.33 cases per 10,000 live newborns.
Availability of Data and Materials
The data supporting this article is available upon request to the corresponding author.
Consent for Publication
Data from the INEC are available to the public. No consent is required for its use.
Footnotes
Acknowledgments
The author thanks all the medical colleagues and hospital professionals who in some way facilitated the development of this research.
Authors' Contributions
The research protocol and its design, data collection, statistical analysis, evaluation and interpretation of the data, critical analysis, discussion, writing, and approval of the final article were all carried out by the author.
Author Disclosure Statement
The author reports no conflict of interest.
Funding Information
The author declares that the financial resources for the elaboration of this investigation do not come from any external funds. This research was self-funded.