
Abstract
Moore, James, Martin J. MacInnis, Jon Dallimore, and Matt Wilkes. The Lake Louise Score: A Critical Assessment of Its Specificity. High Alt Med Biol. 21:237–242, 2020.
Introduction:
The Lake Louise Score (LLS) has low specificity for diagnosing acute mountain sickness (AMS). As this tool is used for research and clinical decision making, it is important to understand the origins of this poor specificity. We reviewed AMS diagnoses in a population trekking at low altitude (“false positives”) to critically assess LLS specificity.
Method:
We retrospectively analyzed data from a sample of 123 adolescents trekking at low altitude to establish the predominant causes of false-positive AMS diagnoses (1993 LLS criteria), separately removing each LLS component to assess its contribution to the final score. Exploratory factor analysis (EFA) was applied to the data to establish component patterns.
Results:
Removal of LLS components individually showed fatigue contributed slightly more to false-positive AMS diagnoses than sleep quality in this group. An EFA from morning data highlighted sleep quality as a stand-alone factor in the measurement of AMS. Although of smaller significance, an EFA of the evening data highlighted fatigue and headache as the stand-alone factor.
Conclusion:
Our findings not only supported the recent removal of sleep quality from the LLS, but also demonstrated that fatigue had an equal part to play in the misdiagnosis of AMS in this population. These data highlighted the poor specificity of the LLS and suggest that the measurement of illness at altitude undergo further review.
Introduction
Acute mountain sickness (AMS) can affect insufficiently acclimatized persons after ascent to altitudes >2500 m. It has been most commonly characterized using the Lake Louise Score (LLS) (Roach et al., 1993), which, until recently, was a combined measure of the five primary symptoms experienced at altitude: headache, gastrointestinal disturbance, fatigue/weakness, dizziness, and impaired sleep quality. However, the broad nature of the prodromal characteristics of AMS (as defined by the score) have led to a lack of specificity: the LLS can record scores consistent with an AMS diagnosis (abbreviated here as “AMS+ve”) even in those at low altitude and, by definition, not suffering from the effects of hypobaria and hypoxia (Jenzer and Bärtsch, 1993; Bailey et al., 2003; Ayus and Moritz, 2008; Bennett et al., 2014). Furthermore, although the LLS was designed as a research tool, it has subsequently been adopted as a clinical decision-making tool, a purpose for which it was never intended but has subsequently been appropriated (Davis et al., 2005; Imray and Johnson, 2015). Decisions made using a highly sensitive, but poorly specific test risk negative consequences such as separating expedition team members, initiating unnecessary treatment, incurring unnecessary rescue expenses (Schultz, 2018), and discouraging further trips to altitude.
Exploratory factor analysis (EFA) and network analysis are two techniques that aim to reveal the underlying structure and the strength of relationships between multiple variables. Using EFA (Macinnis et al., 2013) and network analysis (Hall et al., 2014), two previous studies have highlighted one particular LLS component (sleep quality) as negatively affecting specificity. These studies led others to question the inclusion of sleep quality (Milledge, 2014) and then, by wider consensus, to remove sleep quality completely from the 2018 revision of the LLS (Roach et al., 2018). Similarly, the aim of this study was to investigate the relationship between LLS internal, multivariate measures using low-altitude subjects who, by definition, do not have AMS. We reasoned that, in a low-altitude setting, an analysis of AMS+ve individuals would provide insights into the specificity of the LLS by identifying the components that were most problematic. Our hypothesis was that symptoms other than sleep quality also contributed to the poor specificity of the LLS.
Methods
A previous study (Dallimore et al., 2012) investigated the incidence of AMS+ve symptoms (1993 LLS) within an adolescent population undertaking a 3-day hike <600 m. A total of 123 subjects (59 boys, 64 girls) took part in the original study, with a mean average age of 17 years (range = 13–19 years). Participants completed LLS questionnaires on five occasions over 3 days with a 100% response rate (n = 615 questionnaires). LLSs consistent with the agreed 1993 AMS+ve definition were reported at an average of 11.8% (standard deviation = 9.6%) with a range of 11%–14%, per recording session. These results were reanalyzed in this study for features that would potentially contribute to the specificity of the LLS.
Ethical approval for secondary analysis of primary data
This study was undertaken in accordance with the Peninsula University Schools of Medicine and Dentistry (PUSMD) Research Ethics Committee guidelines and approved by the Faculty of Health and Human Sciences Research Ethics Subcommittee. In the original study, all participants provided informed written consent (per original ethical review).
AMS symptoms and severity
To distinguish between AMS symptom incidence (Fig. 1), and AMS severity (Fig. 2), individual component measurements were plotted against the recording sessions for all participants.
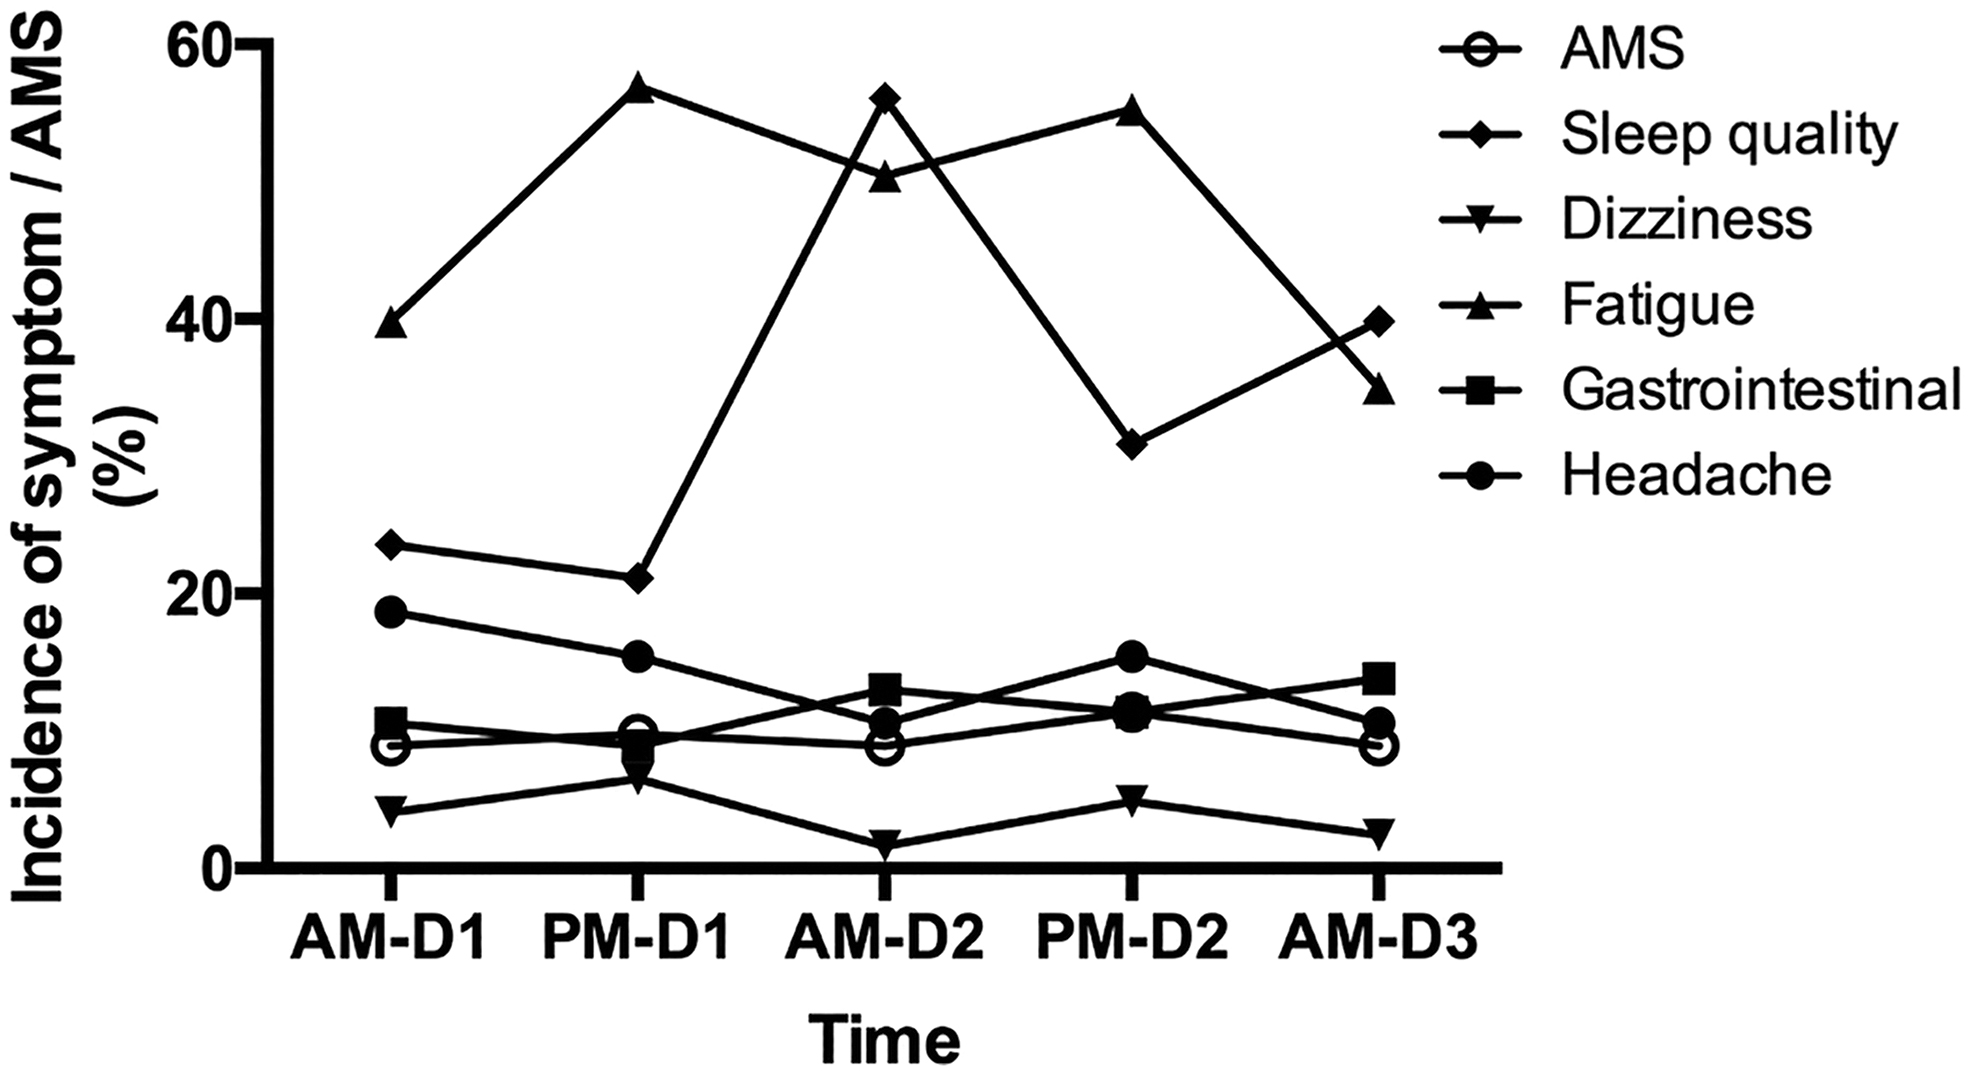
The incidence of AMS and its symptoms in all participants across the five time points. AMS, acute mountain sickness.
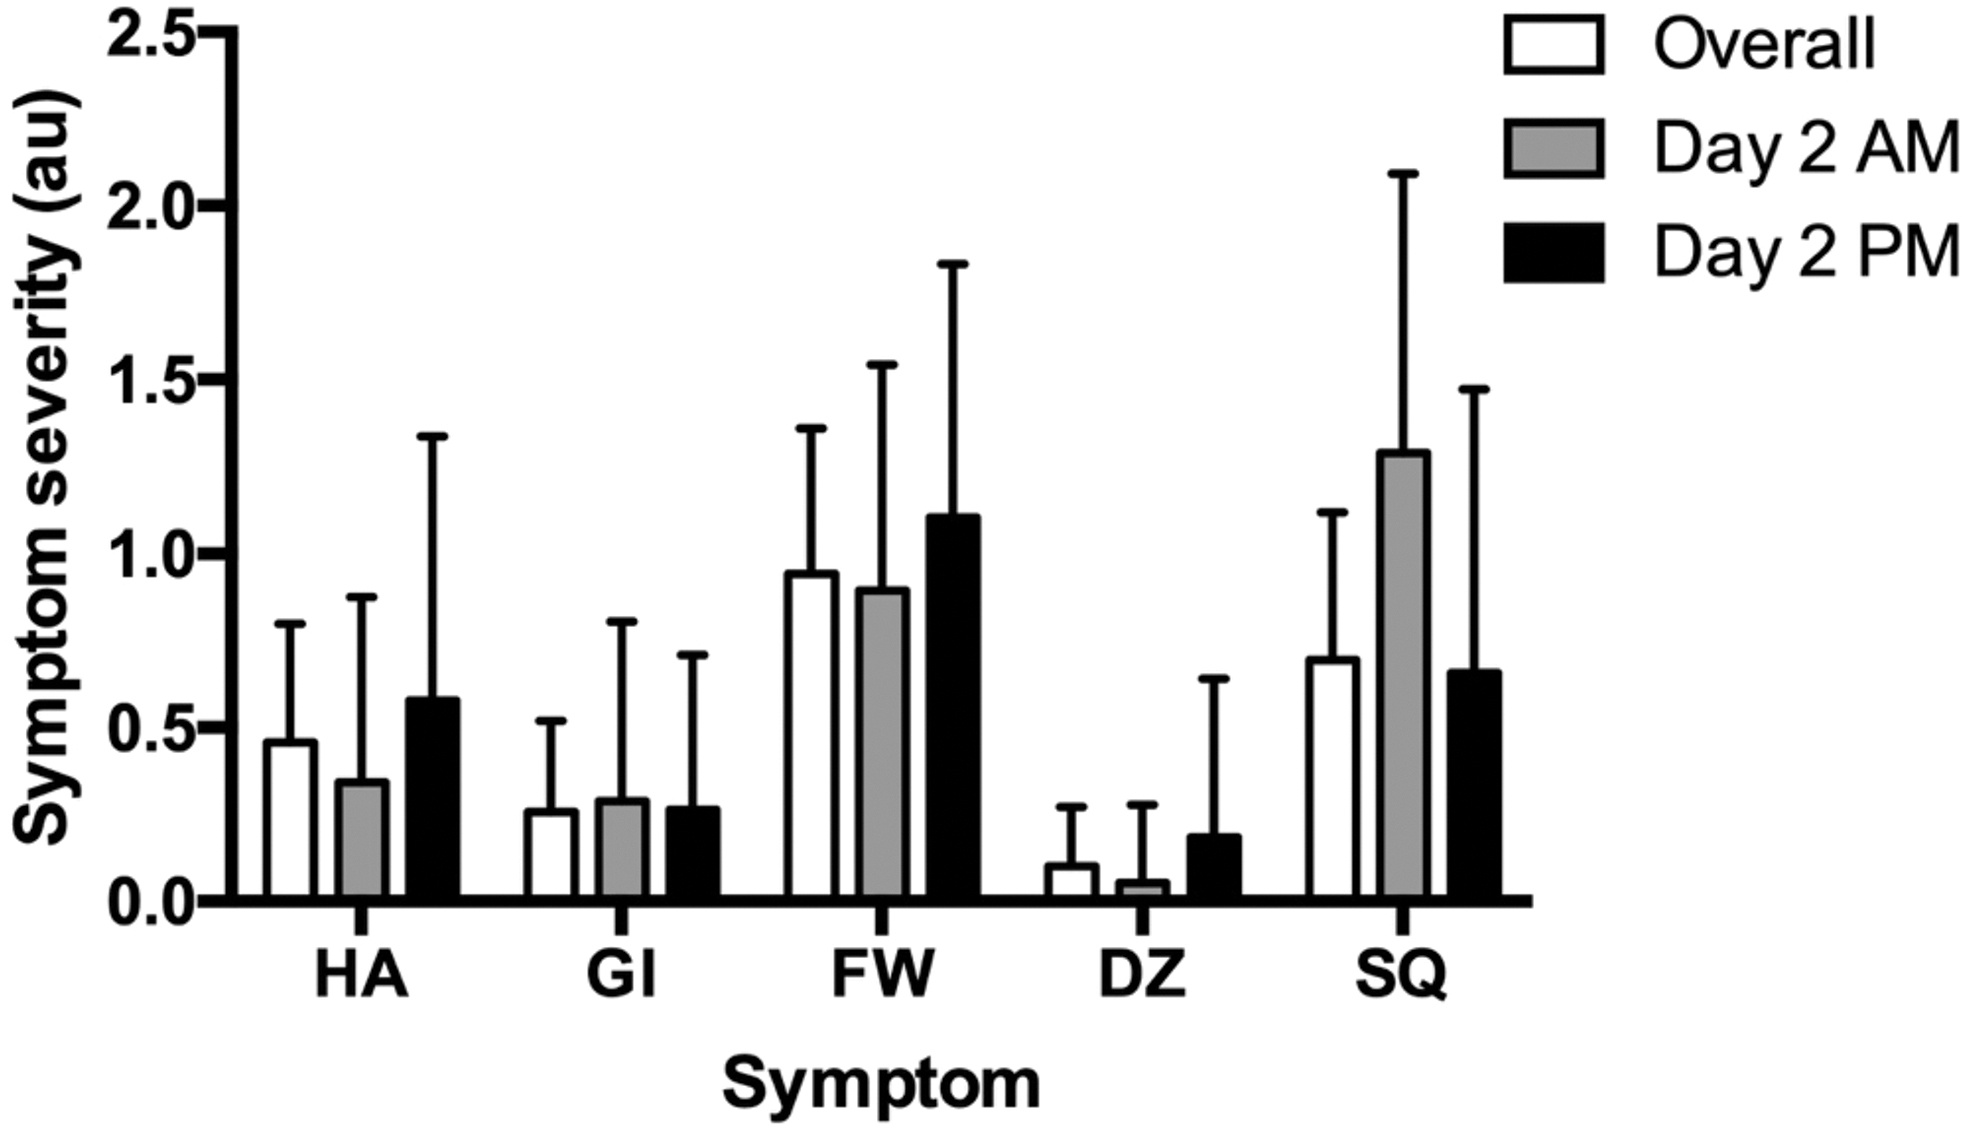
Mean and standard deviation for Lake Louise Score symptom severity—Overall and day 2 AM and PM data. DZ, dizziness; FW, fatigue and weakness; GI, gastrointestinal disturbance; HA, headache; SQ, sleep quality.
EFA and principal component analysis
Data from day 2 (AM and PM), equivalent to acquiring LLS (1993 criteria) 24 hours after arrival at altitude and after 1 day of trekking at altitude, were analyzed in two separate EFAs using principal axis factoring (SPSS Statistics v24©; IBM© Software). As previous studies have demonstrated the existence of principal factors (Macinnis et al., 2013; Hall et al., 2014), direct oblimin rotation was used for the EFAs (Field, 2009). All factors with an eigenvalue >1.0 were retained (Guttman, 1954; Kaiser, 1960), and factor loadings >0.5 were considered significant, as suggested for a sample size of 120 (Hair et al., 1998).
Re-evaluation using the 2018 LLS and component removal
To establish whether the 2018 LLS (Roach et al., 2018) provided greater specificity in the low-altitude population (i.e., reduced AMS+ve recorded incidence), individual components were removed in turn, before new, adjusted scores were calculated. Headache was not removed, as its presence is a mandatory component of the 1993 and 2018 LLS. The incidence was calculated as the number of individuals who were AMS+ve (1993 LLS) at one or more time points over the 3 days. Changes in the incidence of AMS after the individual removal of the four symptoms over the 3-day period, and changes in the incidence of poor sleep (i.e., a sleep quality score >0) throughout day 2 were assessed with McNemar's test using a binomial distribution. Absolute reductions in AMS incidence were reported for the removal of each symptom individually. Specificity was calculated as the number of true negatives divided by the sum of true negatives and false positives (i.e., the sample size). Jeffreys intervals were used to construct 95% confidence intervals (CI) for specificity.
Results
AMS and symptom incidence and severity
Across the 3 days, 38 of 123 participants had a positive diagnosis for AMS at least once (specificity = 69.1% [95% CI = 60.6%–76.8%]) using the 1993 LLS criteria, whereas only 10 of 123 participants had a positive diagnosis for AMS at least once (specificity = 91.9% [95% CI = 86.1%–95.7%]) using the 2018 LLS criteria. The frequencies of symptoms for all individuals and for those reporting a headache are given in Table 1 for the overall dataset and for the day 2 AM and PM datasets. The time course of AMS and symptom incidence is given in Figure 1, and the time course of LLS and symptom severity, among AMS+ve participants, is given in Figure 2. Note that for day 2, the reporting of sleep quality was inconsistent from morning to evening (p < 0.001): referring to sleep quality from the previous evening: 31 participants reported poor sleep at both time points, 7 reported poor sleep only in the evening, 38 reported poor sleep only in the morning, and 47 participants reported no sleep issues at either time point.
The Incidence of Individual Symptoms and the Specificity of the Lake Louise Score After Each Symptom Was Removed for the Overall, Day 2 Morning, and Day 2 Evening Datasets
n = 123.
The number of participants who presented with a score ≥1 for each symptom.
The number of participants with a headache score ≥1 who presented with a score ≥1 for each symptom.
Using the 1993 Lake Louise Score criteria (Roach et al., 1993). Without removing any items, specificities were 69.1% [95% CI = 60.6%–76.8%], 91.1% [95% CI = 85.1%–95.2%], and 88.6% [95% CI = 82.1%–93.3%] for the overall, day 2 morning, and day 2 evening datasets, respectively.
Jeffreys intervals were used to construct the 95% CI for the specificity values.
CI, confidence intervals; DZ, dizziness; FW, fatigue and weakness; GI, gastrointestinal disturbance; HA, headache; N/A, not applicable; SQ, sleep quality.
EFA: day 2 morning and evening data
The Kaiser–Meyer–Olkin measure of sampling adequacy was 0.596, chi-square 69.02 (day 2, AM) and 0.689, chi-square 70.86 (day 2, PM), and the Bartlett's test of phericity reached statistical significance (p < 0.0001) for both morning and evening datasets, indicating that correlations were sufficiently large for EFA. For day 2 morning data, two factors (Table 2) explaining 36.6% of the variance were extracted. For factors 1 and 2, sleep quality and dizziness, respectively, were the only questionnaire items with factor loadings >0.5. For day 2 evening data, one factor (comprising fatigue + headache components), which explained 27% of the variance, was extracted (Table 2) based on an Eigenvalue >1.0.
Factor Loadings for the Exploratory Factor Analysis Performed on Day 2 Morning and Evening Data
n = 123.
Factors were extracted using principal axis factoring.
For the morning data, where more than one factor was extracted, the Oblimin rotation with Kaiser normalization method was used to generate factor loadings.
Removal of LLS components
When symptoms were removed individually from the 1993 LLS in our low-altitude dataset, the removal of fatigue (p = 0.001) and sleep quality (p = 0.004) significantly reduced the absolute incidence of AMS by 8.9% and 7.3% across all timepoints, respectively, whereas removing gastrointestinal disturbance (p = 0.063) and dizziness (p = 1.0) did not impact the incidence of AMS significantly. The specificities for AMS diagnosis after the removal of each symptom, according to the 1993 LLS criteria, are given in Table 1.
Discussion
We investigated the specificity of the LLS by analyzing AMS symptoms reported by individuals who, by virtue of being at sea level, did not have AMS. We considered the influence each LLS component had on the overall AMS incidence and, finally, using EFA, if any LLS component in a low-altitude population stood out as being unrelated to other symptoms.
Retrospective application of the 2018 LLS
Although leading to a considerable and significant reduction in AMS+ve scores (7.3%), retrospective application of the 2018 LLS (Roach et al., 2018) (i.e., removal of the sleep quality component) did not make the score wholly specific, as it did not remove all the false positives (Table 1). More objective measures of sleep, such as polysomnography, provide a range of recordings reflecting sleep architecture (proportions of the different sleep stages) from which an inferred sleep quality can be obtained (Buysse et al., 2006), whereas clinical sleep-quality scores rely on multiple measures, such as “difficulty getting to sleep,” “number of nocturnal arousals,” and “total sleep time” (Buysse et al., 1989). However, even these measures have a level of subjectivity when related to sleep disorder, as they are found at similar levels in individuals not complaining about poor sleep (Carskadon et al., 1976; Coleman et al., 1982). Given that “sleep quality” lacks a clear definition and is as much perception as pathology, it is unsurprising that its inclusion renders the LLS less specific (Krystal and Edinger, 2008). Poor sleep at altitude may be because of periodic breathing (Wickramasinghe and Anholm, 1999; Weil, 2004), but additional causes, such as jet lag and the novelty and psychological stressors of high-altitude travel should always be considered. Although the findings of this study therefore support the recent removal of sleep quality from the LLS, we arrived at this conclusion in a different manner to those of previous studies (Macinnis et al., 2013; Hall et al., 2014).
One observation noted across the low-altitude data was the diurnal variation in sleep quality. Reports of the previous night's sleep quality should be consistent throughout the following day; however, participants perceived the previous night's sleep quality as worse when asked in the morning compared with that in the evening (see Results and Table 1). We suggest this as an important finding, further highlighting the potential for reporting bias within the LLS, both supporting the removal of sleep quality and completion of AMS assessment at consistent times of day.
Sequential removal of LLS components
Having established removal of sleep quality from the LLS caused a 7.3% absolute reduction in false AMS+ve recordings (30.5% relative reduction), the removal in turn of other components revealed a novel observation: whereas the removal of gastrointestinal disturbance and dizziness had a moderately small impact (4.1% and 0.5% absolute reductions, respectively), the removal of the fatigue/weakness measure caused a 8.9% reduction in the absolute number of AMS+ve scores in this population over the five time points.
Although fatigue and weakness can be objectively quantified using oculomotor measures (Schleicher et al., 2008; Sundelin et al., 2013), these are not incorporated within the LLS, making the LLS assessment subjective. Increasing numbers of studies have demonstrated the role of cognitive biases in individual responses to questions about fatigue/weakness and sleep quality. Poor sleepers generally have an exaggerated response to sleep-related questions (Ree et al., 2006; Ellis et al., 2007). Ellis et al. (2010) demonstrated that poor sleepers were more likely to have an insomnia-related bias to questions when subjective sleep-quality assessment primed their thought processes. Interpretive biases have also been shown to affect the perception of sleep-quality measures, such as overestimating the time taken to get to sleep and underestimation of total sleep time (Semler and Harvey, 2005; Tang and Harvey, 2006). Furthermore, those reporting poor sleep have also been shown to look for signs of poor sleep (e.g., fatigue/weakness, visual appearance cues) throughout the following day (Semler and Harvey, 2004), a trait noticed in young adults (Akram et al., 2016).
Acute hypoxia is well known to induce muscle fatigue, reduced exercise ability, and endurance performance (Calbet et al., 2003; Verges et al., 2010). The compensatory mechanisms used to combat the effects of hypoxia, such as increased cardiac output and heart rate can compound the physiological demand on individuals (West et al., 2013a). Furthermore, at altitude, activity can be perceived as disproportionately tiring. This is not just a function of increased basal metabolism, but also through the physical activities associated with trekking (West et al., 2013b), or just existing in a relatively hostile environment (Boyer and Blume, 1984). However, this low-altitude population, not exposed to hypobaric hypoxia, demonstrated the significant impact that factors such as exertion and poor sleep might have on any fatigue measure.
As with sleep quality, fatigue is likely multifactorial at altitude, with acute hypoxia but one of a number of potential causes. While the link between acute hypoxia and fatigue may justify its inclusion in the LLS, the current measure of fatigue does not differentiate between separate, causative factors (such as actual or perceived exertion or psychological stress). We were drawn to the conclusion that the current fatigue component was too nonspecific to warrant a place in the LLS and consideration should be given to its removal until a more satisfactory and specific measure of fatigue (independent of exercise) could be included.
Exploratory factor analysis
An EFA performed on the morning data revealed two factors. Analysis of the first factor demonstrated that sleep quality contributed most to the variance, whereas in factor 2, dizziness appeared as a primary contributor. The onehat factor extracted from the evening data comprised fatigue and headache. The data from Macinnis et al. (2013) agreed with this study's morning data, as sleep quality was seemingly unrelated to the other items. These results suggested LLS in low-altitude morning data measured two dimensions: how well people slept and whether they felt dizzy (note that only two participants indicated dizziness at this time point).
Low-altitude evening data were collected at a time mirroring that of Macinnis et al. (2013), occurring after physical activity and before sleep. The low-altitude data at this point appeared to reflect group feelings of fatigue and headache. LLS in the evening appeared to measure a more uniform constellation of symptoms than morning data, with sleep quality, dizziness, and gastrointestinal disturbance having factors loadings below the cutoff of >0.5 but >0.4. This finding suggests that the LLS administered in the evening measured symptoms related to exertion from trekking.
Limitations
Overall, our EFA of the low-altitude morning data supports Macinnis et al. (2013), showing sleep was least related to the other components, at least in the morning. However, this finding must be interpreted in light of the fact that the sleep-quality component was, in itself, a weak measure. The morning scores, in this study, may have been exaggerated (given the tendency to report worse sleep when questioned in the morning rather than the evening), affecting EFA findings. The suggestion that the LLS component weaknesses affect EFA outcome must also be applied to the low-altitude evening data, which initially suggested that fatigue and headache were the main symptoms being assessed by the LLS, but we were applying EFA to a potentially weak scoring system.
In Likert measures, scoring robustness relates to the precision and validity of the descriptors and scale being used and the applicability of EFA. Utilized in research for many years, Likert scales (Likert, 1932) have been a well-validated data collection method, measuring latent constructs by giving subjects a scale on which to score a response (DeVellis, 1991; Spector, 1992). Research suggests factor analysis can provide inaccurate results when characterizing the internal structure of Likert scales (Holgado-Tello et al., 2008), particularly true of scales with fewer response categories.
Scoring systems in complex pathology
Scoring systems are often welcomed by clinicians, perhaps by offering a frame of reference when managing complex conditions (Green, 2011). A simple diagnostic system is potentially even more appealing for clinicians on an expedition, practicing without secondary support in a remote environment.
Three-part clinical scores comprising 15 points have been shown to have poor interrater reliability (Gill et al., 2004; Zuercher et al., 2009), with authors attempting where possible, to reduce these down to six measures (Ross et al., 1998; Van de Voorde et al., 2008). The 2018 LLS, reduced to four parts (16 points) was certainly a user improvement along these lines. However, if the remaining LLS components were to be successively removed on the grounds of poor specificity, the score would broaden to a point where again, it was of questionable value. Sensitivity and specificity would again decline. However, given the LLS demonstrated lack of specificity, we would argue that perhaps we have been relying on our clinical judgment all along, using the score only as a psychological support and an insufficiently precise research tool.
Notwithstanding its widespread use and acceptance, we would contend that this study [building on those of Hall et al. (2014) and Macinnis et al. (2013)] demonstrated that the LLS components were insufficiently specific and therefore of questionable value in both the score's original and 2018 iterations. This mirrored commentaries on another widely used (and misused) measure of complex pathology, the Glasgow Coma Scale (Green, 2011; Stratton, 2018). Our conclusion, if robust and valid, questions the utility of the LLS as a decision-making tool in clinical settings, and as a scoring mechanism in the context of research.
Conclusions
The LLS has held an important place in high-altitude research: in part, perhaps, by seemingly creating order from chaos and the lack of a better alternative. However, our study demonstrated that in a low-altitude AMS+ve (“false positive”) population, factors such as recording time, broad prodromal symptoms, and individual component relationships contributed significantly to the poor specificity of the LLS. If, as a research and expedition community, we require a quantifiable definition of AMS, then we must make a robust effort to ensure its validity and move beyond the “best we have” arguments for the continued use of the LLS.
Footnotes
Acknowledgments
The authors acknowledge Dr. Kara Stevens for assistance with statistical analysis.
Author Contributions
Study concept and design (J.M., M.W.); obtaining funding (not applicable); acquisition of the data (J.M.); analysis of the data (J.M., M.J.M., M.W.); drafting of the article (J.M., M.J.M., M.W.); critical revision of the article (M.W., M.J.M.); and approval of final version of the article (J.M., M.J.M., M.W., J.D.). Original low-altitude study concept design, data collection, and analysis (J.D.). All co-authors have reviewed this article and provided approval for its submission.
Author Disclosure Statement
No competing financial interests exist.
Funding Information
No funding was received for this article.