
Abstract
Uday, Yanamandra, Revanth Boddu, Suman Pramanik, Kundan Mishra, Rajan Kapoor, Ankur Ahuja, Tathagata Chatterjee, and Satyaranjan Das. Prevalence and clinical characteristics of post-thrombotic syndrome in high-altitude–induced deep vein thrombosis: experience of a single tertiary care center from real-world settings. High Alt Med Biol. 21:319–326, 2020.
Background:
Exposure to high altitude (HA) is a recognized predisposing factor for venous thrombosis. Post-thrombotic syndrome (PTS) is a significant late complication, occurring in ∼30%–50% of patients of deep vein thrombosis (DVT). There are not many studies about the characteristics of PTS in patients with HA-DVT.
Aim:
The aim was to study the epidemiology and clinical characteristics of PTS using a noninvasive Villalta score and identify the risk factors for its development in patients with HA-DVT.
Methodology:
This is a retrospective single-center observational study (n = 47). The diagnosis of HA-DVT was confirmed using color Doppler ultrasonography at HA. The patients were managed with low molecular weight heparin, followed by vitamin K antagonist therapy till normalization of D-dimer and imaging. The therapeutic target range of >80% was ensured. Villalta scale was used for PTS assessment. JMP 15.0 was used for statistical analysis.
Results:
All study participants were male with a median age of 34 years, of which 46.81% developed PTS with mean Villalta of 5.29 ± 4.25. The most common symptom was pain (87.23%; n = 41), whereas the most common sign was hyperpigmentation (42.5%; n = 20). On multivariate analysis, the time from onset of DVT and the extent of DVT were related to the development of PTS (degree of freedom [dF] = 5, χ2 = 17.34, p = 0.0039) with a likelihood ratio of 4.95 (p = 0.026) and 4.96 (p = 0.026), respectively. The extent of DVT was associated with the severity of PTS (dF = 5, χ2 = 12.6, p = 0.0273) with a likelihood ratio of 5.24 (p = 0.022).
Conclusions:
PTS develops in approximately half of the patients with HA-DVT. The extent of DVT is a significant risk factor for both development of PTS and its severity, whereas time to assessment of PTS from the onset of DVT was associated only with the occurrence of PTS.
Introduction
There has been a constant rise in the number of lowlanders sojourning to high altitude (HA) for occupational purposes and leisure activities over the years. Exposure to HA can lead to a spectrum of short- and long-term medical illnesses labeled as HA illness, including venous thrombosis (Yanamandra, 2019). Venous thrombosis at HA can present as pulmonary thromboembolism, mesenteric vein thrombosis, splenic infarction, cerebral vein thrombosis, and deep vein thrombosis (DVT) of the extremities (Gupta and Ashraf, 2012; Pandey et al., 2016; Zavanone et al., 2017). There is extensive literature available on the immediate mortality and morbidity secondary to HA-induced deep vein thrombosis (HA-DVT), but the literature is sparse on long-term complications of HA-DVT (Gupta and Ashraf, 2012; Pandey et al., 2016; Zavanone et al., 2017).
DVT of lower extremities leads to structural damage to the venous valvular system, subsequently causing ambulatory venous hypertension (Vedantham, 2009; Kahn, 2016). Prolonged venous hypertension over a period can lead to a myriad of symptoms and signs combinedly labeled as post-thrombotic syndrome (PTS) (Kahn, 2016). PTS occurs in ∼30%–50% of patients with DVT, of which up to 5% have severe PTS (Kahn, 2009). However, similar literature regarding the epidemiology of PTS in HA-DVT is lacking. The development of PTS and its severity are heterogeneous among DVT patients (Kahn, 2016). The literature suggests specific risk factors that can predict the severity and incidence of PTS in DVT (Rabinovich and Kahn, 2014; Galanaud et al., 2016; Kahn, 2016). There are no studies to suggest whether these risk factors apply to the HA-DVT as well.
We planned this study to fill in the gaps in the literature, as already mentioned. The aim was to study the epidemiology, clinical characteristics of PTS using noninvasive Villalta score, and identify the risk factors for its development in patients with HA-DVT in real-world settings.
Patients and Methods
Study characteristics
This is a retrospective single-center observational study (n = 47) conducted at a tertiary care center in north India from January 01, 2017, to February 28, 2020.
Study population
All the healthy lowlanders who developed DVT at HA were analyzed at the first point of contact after the start of the study. HA was defined as an altitude of >8000 ft above the sea level (>2438 m ASL). All sojourners were otherwise asymptomatic and healthy before traveling to HA. All sojourners were medically examined before proceeding to HA for any medical illnesses, and those found to have any medical comorbidities or history of venous insufficiency or venous thromboembolism were excluded. These sojourners had a stay at HA of not more than 2 years.
All patients enrolled in the study group were evaluated twice using color Doppler ultrasonography, initially at HA (for establishing diagnosis before deinduction to the study center at sea level) and again at the time of presentation to the study center (to reconfirm the diagnosis and assess the extent of DVT). Common iliac, external iliac, common femoral, deep femoral, superficial femoral, and popliteal veins were defined as proximal. Anterior tibial, peroneal, and posterior tibial veins were defined as distal deep veins. Patients were not subjected to computed tomography or magnetic resonance venography, ideal for evaluating common iliac vein and its tributaries, which otherwise are poorly visualized by color Doppler ultrasonography.
All the patients with confirmed DVT were started on low molecular weight heparin (LMWH). LMWH was given at 1 mg/kg twice daily and later overlapped with dose-adjusted oral vitamin K antagonist (VKA) until an International Normalized Ratio (INR) of 2–3 was achieved. LMWH was stopped after target INR was achieved. Therapy (VKAs) was given for at least 6 months and were stopped after ascertaining complete/near-total recanalization without any residual thrombus or development of collaterals and normalization of D-dimer (<0.5 mcg/dL). D-dimer was done at diagnosis, 6 months after diagnosis, and before stopping the anticoagulation at any time point after 6 months (in case the duration of anticoagulation is prolonged). Time in therapeutic range (TTR) for >80% of treatment duration (until the patient was on VKAs) was an inclusion criterion. Wherein TTR was defined as INR of 2–3 assessed through monthly INR evaluation at primary health care facilities. Only VKA was given to the study population with no usage of the direct oral anticoagulants. Patients were placed on lifelong secondary antiplatelet prophylaxis (Ecosprin 75 mg OD) after stopping anticoagulation based on the primary physician's choice.
The prothrombotic state was evaluated among all these patients 1 month after the end of therapy, that is, stopping the anticoagulation. The evaluation included protein C, protein S, activated protein C resistance, lupus anticoagulant, and homocysteine levels. Only those patients who did not have any other established acquired or prothrombotic predisposing factor were included in this study.
Assessment of PTS
The PTS was assessed using a noninvasive Villalta scale (also known as Villalta–Prandoni Scale) as per the recommendations from the International Society on Thrombosis and Hemostasis (ISTH) (Supplementary Table S1) (Kahn 2009). A total score of 0–4 indicates the absence of PTS, and a score of >4 indicates PTS (5–9, mild PTS; 10–14, moderate PTS; and >14 or the presence of an ulcer, severe PTS). Patients were analyzed for the PTS at any subsequent visit after 6 months of the onset of DVT or stopping anticoagulation whichever is later. All the components of the Villalta score were recorded at different time points from the onset.
Factors studied
We analyzed the incidence, severity of PTS, and the incidence of various components of the Villalta score in young males developing DVT at HA. We then analyzed the correlation of the common risk factors (age, body mass index [BMI], duration of anticoagulation, time of assessment from the onset of DVT, antiplatelet prophylaxis, and extent of DVT) with presence and severity of PTS. These factors were also correlated with each component of the Villalta score.
Statistical analysis
JMP 15.0 was used for statistical analysis. The results are represented as mean ± standard deviation (median; range). For analyzing how the distribution of a nominal/ordinal Y variable differs across groups defined by a categorical and continuous X variable, contingency analysis and logistical analysis were used, respectively, in fit Y by X analysis platform. In the logistic fit and mosaic plots, the Y-axis (vertical axis left) shows the response probability. The whole Y-axis is equivalent to a probability of 1 (representing the total sample). In a logistic fit plot, the X-axis represents the predictor (continuous independent variable), whereas in the contingency mosaic plot, it represents the proportions (the number of observations) for each level of the X variable. In contingency plots, the proportions on the vertical axis at right represent the overall proportions of each subgroup of the X-axis for the combined levels. The whole model test for logistic fit was done using either nominal logistic fit or stepwise linear regression analysis. The results of these analyses are represented by the degree of freedoms (dF), the chi-square (χ2), and its p-value. Likelihood ratio and the corresponding p-values are mentioned for the parameters that had a significant relation during multivariate analysis. A p-value of <0.05 was considered significant.
Results
Of the total DVT patients (n = 382) who were managed at this center, 239 patients were evaluated or managed within the first 6 months of the onset of DVT. Of the residual 143 patients who were assessed for PTS (after 6 months of DVT onset), 47 patients had DVT onset at HA. Of the 47 patients with HA-DVT who were analyzed in this study, the median age of the population cohort was 34 years (range = 22–50; mean = 35.27 ± 5.76). All the individuals were males. Baseline demographics of the study cohort are appended as Table 1 and Figure 1. The distribution of the extent of DVT, patients on antiplatelet prophylaxis, presence of PTS, and its severity are as shown in Figure 2A–D. PTS was present in 46.81% (n = 22) of patients and 53.19% (n = 25) did not develop this complication. In those who developed PTS, 13.63% (n = 3) had severe PTS, 18.18% (n = 4) had moderate PTS, and the rest, 68.18% (n = 15), had only mild PTS. The median total Villalta score was found to be 4 points (0–22; 5.29 ± 4.25). The distribution of various components of the Villalta score in those who developed PTS is as shown in Table 2 and Supplementary Figure S1. Among the symptoms of PTS, the most common symptom was pain, seen in 87.23% (n = 41), followed by cramps and heaviness in 72.34% (n = 34) patients each. The most common signs of PTS were hyperpigmentation in 42.55% (n = 20) and pain on calf compression in 40.42% (n = 19). Of the 13.63% (n = 3) who had severe PTS, the venous ulcer was present in two patients (66.66%).

Distribution of the study population's using Box–Whisker plots with histogram for

Distribution of the study populations using histogram and mosaic plots for
Baseline Characteristics of the Study Population
DVT, deep vein thrombosis; Max, maximum; Min, minimum; PTS, post-thrombotic syndrome; SD, standard deviation.
Distribution of Various Components of Villalta Score, Represented as n (% of Total)
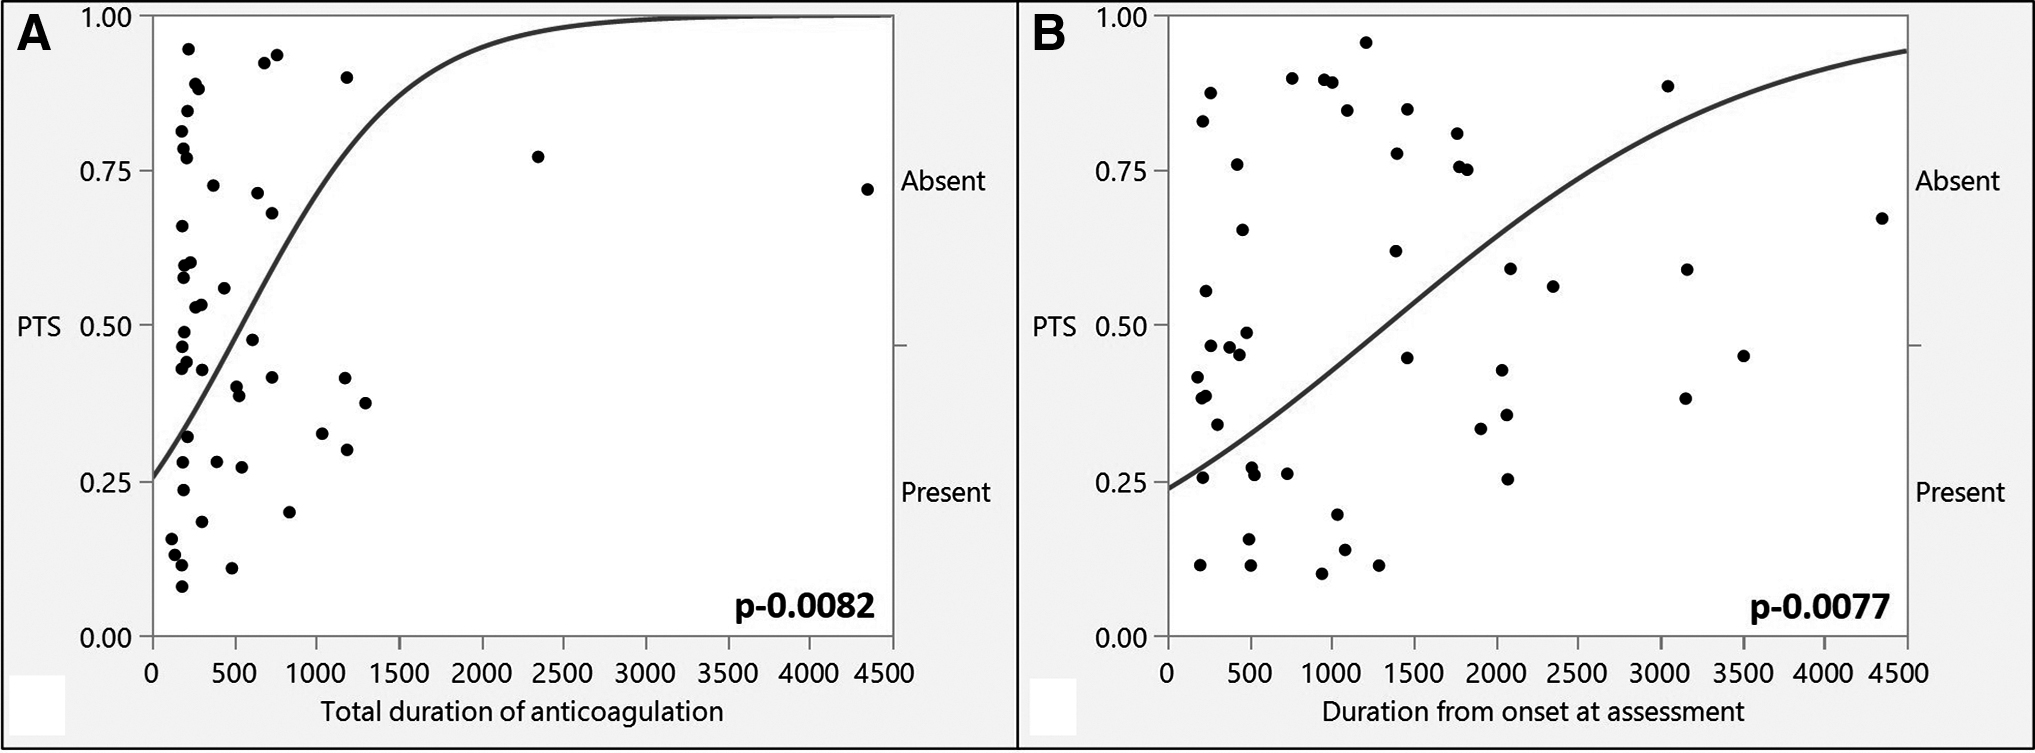
On fit Y by X analysis, the occurrence of PTS was significantly correlated with the duration of anticoagulation administered and the time of assessment from the onset of DVT (dF = 1, χ2 = 6.98, p = 0.0082), (dF = 1, χ2 = 7.09, p = 0.0077), respectively (Fig. 3A, B). There was no relationship between the presence of PTS and age of patients (dF = 1, χ2 = 2.40, p = 0.13), extent of DVT (dF = 1, χ2 = 3.1, p = 0.08), BMI (dF = 1, χ2 = 0.81, p = 0.37), and antiplatelet prophylaxis (dF = 1, χ2 = 6.98, p = 0.98) (Supplementary Fig. S2). On multivariate analysis of all the factors already mentioned, only the time to assessment of PTS and the extent of DVT were found to have significant relation with occurrence of PTS (dF = 5, χ2 = 17.34, p = 0.0039), with a likelihood ratio of 4.95 (p = 0.026) and 4.9554 (p = 0.026), respectively.
Logistic fit plot showing correlation of the presence of PTS with
On fit Y by X analysis, there was no relationship between the severity of PTS and the duration of anticoagulation administered, time of assessment from the onset of DVT, age of patients, the extent of DVT, BMI, and antiplatelet prophylaxis (Supplementary Fig. S3). On multivariate analysis of all the factors already mentioned, only the extent of DVT was found to have significant relation with the severity of PTS (dF = 5, χ2 = 12.6, p = 0.0273), with a likelihood ratio of 5.24 (p = 0.022).
Among all the characteristics of the Villalta, the use of antiplatelet prophylaxis was found to have a significant correlation with the incidence of hyperpigmentation (p = 0.035), skin induration (p = 0.03), and venous ectasia (p = 0.04) on fit Y by X analysis. The heaviness of limb was found to correlate with the duration of anticoagulation (p = 0.0016), duration from onset to assessment (p = 0.02), and age of the patient (p = 0.04). Also, the extent of DVT was found to be significantly correlated with the occurrence of pruritus (p = 0.04). The correlation of various aspects of the Villalta with a duration of anticoagulation, time of assessment of PTS, age of patients, the extent of DVT, BMI, and antiplatelet prophylaxis is appended as Supplementary Figures S4–S15. On multivariate analyses, there was no correlation of all the mentioned factors with pain (dF = 6, χ2 = 12.21, p = 0.06), cramps (dF = 6, χ2 = 10.68, p = 0.1), heaviness (dF = 6, χ2 = 15.57, p = 0.016, but no significant LR with any of the factors), paresthesia (dF = 6, χ2 = 6.16, p = 0.41), pruritis (dF = 6, χ2 = 8.59, p = 0.19), redness (dF = 5, χ2 = 2.71, p = 0.74), hyperpigmentation (dF = 5, χ2 = 5.44, p = 0.36), venous ectasia (dF = 5, χ2 = 2.55, p = 0.76), and venous ulcer (dF = 5, χ2 = 5.47, p = 0.36). Whereas pretibial edema had a significant correlation (dF = 6, χ2 = 19.7, p = 0.0031) with the total duration of anticoagulation, antiplatelet prophylaxis, and extent of DVT with a likelihood ratio of 8.61 (p = 0.003), 8.28 (p = 0.004), and 6.26 (p = 0.012), respectively. Similarly, skin induration had a significant correlation (dF = 6, χ2 = 24.52, p = 0.0004) with the total duration of anticoagulation, antiplatelet prophylaxis, and BMI with a likelihood ratio of 10.6 (p = 0.001), 16.52 (p < 0.0001), and 5.36 (p = 0.02), respectively.
Discussion
HA environment induces a hypercoagulability state (Gupta and Ashraf, 2012). At HA, thrombotic episodes are a hazard and often present as thrombosis of pulmonary, mesenteric, cerebral, splenoportal veins, and deep venous system in the lower limbs (Kumar et al., 2019; Yanamandra, 2019). On the evaluation of pathophysiology, these individuals were detected to have increased platelet activation, increased proinflammatory markers, increased endothelial dysfunction, and decreased fibrinolytic activity (Gupta and Ashraf, 2012; Nair et al., 2016; Yanamandra et al., 2017). The genetic analysis was suggestive of dysregulation of miRNA (miRNA-320) and specific mutations to predispose these individuals to hypercoagulability state (Jha et al., 2018; Srivastava et al., 2019, 2020). Despite the extensive literature on the HA-DVT, the literature on the long-term complications of HA-DVT is lacking (Shishir, 2006).
PTS can be extremely debilitating because of venous ulcerations, pedal edema, and dragging pain, impeding the activities of day-to-day living (Prandoni et al., 1996; Schulman et al., 2006; Kahn et al., 2008). PTS also has social and financial implications (Ashrani and Heit, 2009). Our study is the first of its kind to assess the PTS in patients with HA-DVT. There are not too many studies from real-world settings about the prevalence and clinical characteristics of PTS. In our study, we found 47% of the individuals developing this complication, with only 6% of the study cohort developing severe PTS.
PTS is generally diagnosed using either invasive testing (phlebography) or noninvasive testing (various scoring systems). Villalta scale (noninvasive scoring system) is validated to diagnose and grade PTS; also, it has been used in various multicentric trials and has been recommended by the ISTH (Utne et al., 2016). There is a paucity of data on which component of the Villalta scale is more common in patients with PTS. We assessed the patients for PTS only after a minimum period of 6 months, as the symptoms of acute DVT are often overlapping with PTS, and it may take 3–6 months for the development of PTS. In this study, the most common symptom was found to be a pain, followed by cramps and heaviness. The most common signs were hyperpigmentation and pain on calf compression, respectively. The venous ulcer was present in 6.38% (n = 3) patients, which is in concordance with previously published literature, demonstrating a 5% incidence among PTS patients during a 10-year course (25).
All the individuals included in the study were males because of the selection bias (being occupational sojourners). However, in a few studies, gender was not found to have an impact on the incidence or severity of PTS (Ageno et al., 2003; Prandoni et al., 2004; Kahn et al., 2005), whereas there are studies to show increased risk among women and men accordingly (Stain et al., 2005; Van Dongen et al., 2005).
Specific risk factors related to increased risk of development of PTS can be classified as those present at the time of diagnosis (previous ipsilateral DVT or venous insufficiency, proximal DVT, higher age, and higher BMI), those related to the therapy of DVT (TTR of INR <50% in the first 3 months of VKA and thrombolysis), and those after DVT therapy (ipsilateral recurrence, venous symptoms even after 1 month of therapy, radiological evidence of residual thrombosis, and persistently elevated D-Dimer).(Rabinovich and Kahn, 2014; Galanaud et al., 2016; Kahn, 2016)
As TTR <50% is a significant risk factor for the development of PTS (Van Dongen et al., 2005), we ensured all the patients in the study cohort a TTR >80%. This was possible as most of our clientele are kept under strict follow-up for the first 6 months of therapy or until the continuation of anticoagulation, whichever is later.
We assessed patients at only one point in time for the presence and severity of PTS, that too at different periods from diagnosis of DVT. It usually takes 3–6 months for the initial pain and swelling to resolve, and the diagnosis of PTS should be deferred for resolution of the acute episode (Kahn, 2016). We had thus excluded the patients evaluated for the PTS in the first 6 months after the diagnosis. PTS becomes apparent within 1 year after the acute DVT, with little increase in incidence after that (Kolbach et al., 2005). We found a significant positive relationship between the incidence of PTS and increasing time duration from DVT diagnosis. This could be explained by the otherwise active males who return to their routine physical activity after stopping anticoagulation, leading to increased venous pressure in lower limbs with compromised venous valvular structure.
The incidence of PTS was significantly higher in patients with increasing duration of anticoagulation. The radiological evidence of residual thrombosis and persistently elevated D-dimer even after 6 months of therapy is positively correlated with the incidence of PTS (Rabinovich et al., 2014; Kahn, 2016). In our routine practice, we usually prolong VKA therapy till radiological resolution and normalization of D-dimer. Thus, the duration of anticoagulation, a surrogate for residual thrombus load and persistently raised D-dimer, is an indirect risk factor, which was positively correlated with the incidence of PTS, as was seen in our study. The effect was not significant in the multivariate analysis, probably because of the small sample size.
Several other studies have reported recurrent venous thrombosis as a risk factor for the development of PTS (Prandoni et al., 1996, 2004; Biguzzi et al., 1998; Stain et al., 2005; Van Dongen et al., 2005). Unfortunately, we were unable to investigate this parameter as the presence of the previous DVT, or venous insufficiency was a contraindication for travel to HA.
Higher BMI is often an aspect of interest, as it is a potentially modifiable risk factor for PTS, and weight reduction may play a role in the prevention of PTS. High BMI is related to a lack of physical exercise and, therefore, a reduced function of the muscle pump. It is expected to increase the venous pressure and promote reflux in already compromised veins (Tick et al., 2008a). The PTS was not associated with BMI in this study, contrary to previous reports (Biguzzi et al., 1998; Ageno et al., 2003; Kahn et al., 2005; Stain et al., 2005; Van Dongen et al., 2005). This can probably be attributed to these patients being otherwise healthy and fit individuals involved in daily physical activity ascending to HA for occupational purposes developing DVT. Also, very few patients have higher BMI (mean BMI = 23.98 kg/m2).
The age of the individual is a recognized risk factor in the development of PTS (Schulman et al., 2006; Tick et al., 2008b). However, there was no statistically significant correlation seen in this study.
The literature suggests a two- to threefold increased risk in those with proximal DVT (Labropoulos et al., 2008; Tick et al., 2010). In our study, 4 out of 17 patients (23.52%) with distal DVT had PTS, and 17 out of 30 (56.66%) with proximal DVT had PTS. On multivariate analysis, the extent of DVT showed a significant relation with the development and severity of PTS.
Contrary to the literature, in our study, there was no correlation of the antiplatelet prophylaxis with the occurrence or incidence of PTS (Belcaro et al., 2018). This could be because of the small cohort size.
Limitations and Strengths of the Study
The major strength of this study is its uniqueness in not only identifying the epidemiology of the PTS in HA-DVT patients but also in studying the risk factors for the development and severity of the PTS among the HA-DVT patients in real-world settings. The major limitations of the study are small cohort size, retrospective design, only male study subjects, and all patients were only evaluated with color-Doppler ultrasonography irrespective of the location or extent of DVT. Repeated evaluation of the same set of patients over a period could have aided in a better understanding of PTS in HA-DVT.
Conclusions
PTS develops in ∼47% of the young healthy male individuals who developed DVT at HA. The extent of DVT and the time from the onset of DVT were major risk factors for the development of PTS, whereas the severity of PTS was associated only with the extent of DVT. The other risk factors, such as age, BMI, duration of anticoagulation, and antiplatelet prophylaxis, did not correlate with the development of PTS or its severity.
Footnotes
References
Supplementary Material
Please find the following supplemental material available below.
For Open Access articles published under a Creative Commons License, all supplemental material carries the same license as the article it is associated with.
For non-Open Access articles published, all supplemental material carries a non-exclusive license, and permission requests for re-use of supplemental material or any part of supplemental material shall be sent directly to the copyright owner as specified in the copyright notice associated with the article.