
Abstract
Aim:
This study aimed to determine if eight sessions of supramaximal but steady-state, set duration interval training in hypoxia enhanced measured anaerobic capacity and work performed during high intensity exercise. High Alt Med Biol. 21:370–377, 2020.
Materials and Methods:
Eighteen cyclists (V̇O2peak: 57 ± 7 ml·kg−1·min−1) were pair-matched for anaerobic capacity determined by maximal accumulated oxygen deficit (MAOD) and allocated to a 4-week interval training in hypoxia (IHT; FiO2 = 14.7% ± 0.5%, n = 9) or interval training in normoxia (NORM; FiO2 = 20.6% ± 0.3%, n = 9). Cyclists completed twice weekly interval training (8 × 1 minutes: ∼120% V̇O2peak, 5 minutes recovery: ∼50% V̇O2peak) in addition to their habitual training. Before and after the intervention, a constant work rate supramaximal time to fatigue and a graded exercise test were used to determine changes in anaerobic capacity/supramaximal work performed and aerobic capacity/peak aerobic power output, respectively.
Results:
No interaction or main effects were observed. Using indirect calorimetry, anaerobic capacity was not significantly different in either group pre- to postintervention using MAOD (IHT: 4% ± 15%; NORM: −5% ± 12%) or gross efficiency methods (IHT: 7% ± 14%; NORM: −2% ± 9%), and VO2peak was unchanged (IHT: 1% ± 6%; NORM: 1% ± 4%). However, within-group analysis shows that supramaximal work performed improved with IHT (14% ± 13%; p = 0.02; d = 0.42) but not NORM (1% ± 22%), and peak aerobic power output increased with IHT (5% ± 7%; p = 0.04; d = 0.32) but not NORM (2% ± 4%).
Conclusion:
Steady-state, set duration supramaximal interval training in hypoxia appears to provide a small beneficial effect on work capacity during supramaximal and high intensity exercise.
Introduction
Cycling in an environment of reduced oxygen concentration augments the contribution of energy derived through anaerobic metabolism in skeletal muscle (Knuttgen and Saltin, 1973; Girard et al., 2017). As a result, to achieve a set external work rate in hypoxia compared to sea level, anaerobic energy provision must increase. Therefore, matched training in hypoxia may be an effective stimulus to improve anaerobic capacity. In this context, anaerobic capacity is defined as the work contribution, or oxygen equivalent, remaining when the measured aerobic contribution is subtracted from the total work or oxygen demand (Noordhof et al., 2013).
To date, no study has directly determined the impact of any intermittent hypoxic training intervention on anaerobic capacity in trained endurance cyclists. Studies have assessed the effects of various intermittent hypoxic training and repeated sprint methods on aspects of anaerobic performance, including the capacity for repeated high intensity aerobic efforts and sprints (Galvin et al., 2013; Goods et al., 2015; Hamlin et al., 2017), work done over set-duration trials (Faiss et al., 2013b; Millet et al., 2014), and other constant distance time trials (Alvarez-Herms et al., 2016). Critically, these studies provide information on anaerobic performance but do not provide measures of anaerobic capacity.
Importantly, anaerobic capacity may be estimated by multiple methods, and limitations of the traditional maximal accumulated oxygen deficit (MAOD) method are well known. For example, the MAOD method is dependent on a submaximal power output-oxygen consumption (VO2) linear regression, the outcomes of which may be altered due to the duration and number of submaximal bouts or due to a fixed or variable y-intercept (Noordhof et al., 2011). Therefore, estimation of anaerobic capacity by multiple methods may provide a greater certainty of outcome.
Variations in the format of intermittent hypoxic training exist. In contrast to repeated sprint training in hypoxia characterized by variable work rates and thus work done per sprint, the steady state work rates of interval training are appealing given that the training impulse can be precisely titrated for the management of total training load. However, intermittent hypoxic training that includes supramaximal efforts (Hamlin et al., 2010) and repeated sprint training in hypoxia (Faiss et al., 2013b; Galvin et al., 2013) have shown improved anaerobic performances and capacity for repeat high intensity efforts, indicating that supramaximal intensities may be important for type 2 muscle fiber recruitment and anaerobic adaptation (Faiss et al., 2013a; McLean et al., 2014). Therefore, a potential amalgamation, whereby steady state, set duration intervals are completed at supramaximal work rates, may promote superior adaptations to those previously observed with intermittent hypoxic training.
The aim of this study was to determine the effect of supramaximal intensity interval training in hypoxia (IHT) compared to matched training in normoxia (NORM) on anaerobic capacity and supramaximal work capacity assessed through a constant work rate supramaximal test in trained endurance cyclists. Our hypothesis was that eight sessions of supramaximal IHT undertaken in addition to 4 weeks of habitual endurance training would enhance anaerobic capacity to a greater extent than matched training in normoxia.
Materials and Methods
Participants
Eighteen trained performance level 3 (De Pauw et al., 2013) cyclists participated in this study. Participant characteristics at baseline can be found in Table 1. No participant reported prior exposure to a normobaric hypoxic environment or training at terrestrial altitude before the study. Study procedures were approved by the Human Research Ethics Committee of the Bond University (0000015873) and conformed to the Declaration of Helsinki. Participants provided written informed consent before commencing the study.
Participant Characteristics at Baseline (Mean ± Standard Deviation)
Habitual training volume during BL period.
BL, baseline; IHT, interval-training in hypoxia; NORM, interval-training in normoxia.
Study design
A single-blind parallel group design was used, with one investigator privy to environmental training conditions (DA). Regardless of experiential condition, all testing protocols were conducted at sea level in a temperature controlled (20°C ± 3°C) laboratory. Testing protocols were conducted over two sessions separated by ∼48 hours (2.6 ± 1.0 days) and were undertaken on three separate occasions: (1) at the commencement of the study (baseline); (2) after a 4-week baseline training period for determination of habitual training load (Foster et al., 2001) completed immediately before the interval training intervention (pre-Interval training [IT]); and (3) following a 4-week interval training intervention (post-IT; Fig. 1) to determine effects on high intensity work capacity and anaerobic capacity.

Study overview. The same testing protocol was repeated on three occasions, separated by a 4-week BL period and a 4-week IT intervention period. BL, baseline; GXT, graded exercise test; IHT, interval training in hypoxia; IT, interval training; NORM, interval training in normoxia; TTF, time to fatigue.
Participants were pair matched according to pre-IT anaerobic capacity assessed using MAOD as a primary dependent variable and allocated to either hypoxic (IHT; FiO2 = 14.7% ± 0.5%; n = 9) or normoxic (NORM; FiO2 = 20.6% ± 0.3%; n = 9) training intervention. Participants were instructed to replicate their habitual training load (from their baseline period) as closely as possible during the intervention period, with the addition of twice weekly, supervised interval training sessions. Daily training load was summed and presented as a weekly average.
All testing sessions were undertaken on a magnetically-braked cycle ergometer (Lode Excalibur Sport Ergometer, Lode, The Netherlands), and expired gasses were continuously analyzed by a metabolic cart calibrated to manufacturer's specifications (Quark CPET, Cosmed, Italy). Participants maintained the same self-selected cadence (80–100 rpm) throughout each test, and volitional fatigue was defined as a decrease in cadence by 10 rpm. Participants were fasted and rested (i.e., no training for a minimum of 36 hours) for all testing sessions and were familiarized with the supramaximal time to fatigue test procedures on two separate occasions before study commencement, as determined necessary by a reliability substudy undertaken in our laboratory (Supplementary Data).
Procedures
Session 1
The graded exercise test consisted of a stepped protocol commencing at a work rate between 125–325 W (204 ± 51 W) according to the participant's body mass and training status. Following the initial 150 seconds stage, work rate increased 50 W for 150 seconds and 25 W every 150 seconds thereafter until volitional exhaustion (Hawley and Noakes, 1992). The starting work rate for each participant was replicated on all testing occasions. V̇O2peak was determined as the highest average V̇O2 of two consecutive 30-s periods (Hawley and Noakes, 1992).
Following the graded exercise test and a 15-minute passive recovery, 3 × 6-minutes constant work rate steady-state exercise bouts were completed at mechanical work rates equivalent to 50%, 65%, and 80% of the peak power output attained in the graded exercise test. Each bout was separated by 6 minutes of passive recovery. The mechanical work rate and the O2 uptake from the final 2 minutes of the three steady-state exercise bouts, and the estimated oxygen uptake during unloaded cycling (5 ml·kg−1·min−1) (Medbø et al., 1988), were used to determine the mechanical work-O2 uptake linear regression equation. Gross efficiency was determined at both 50% and 65% peak power output (Garby and Astrup, 1987).
Session 2
Testing Session 2 was conducted at least 48 hours after Session 1. The supramaximal time to fatigue test was proceeded by a 5-minute warm up at ∼40% peak power output and 3 × 6-second all-out sprint efforts with 5-minute passive recovery. The time to fatigue test was completed at a mechanical work rate corresponding to 120% of time-averaged V̇O2peak according to the individual O2 uptake-mechanical work rate linear regression. In the 10 seconds before the onset of the test participants attained their required cadence, and the mechanical work rate was then applied until volitional fatigue. Participants were blinded to all data except cadence.
Calculations
Mechanical work performed during the time to fatigue test was calculated as time (s) × mechanical work (W) and presented relative to body mass (J·kg−1). Anaerobic capacity and energetic contributions were determined using two methods as follows: (1) the MAOD method (Medbø et al., 1988) and (2) the gross efficiency method (Serresse et al., 1988; Foster et al., 2003). For MAOD, the O2 deficit was calculated in 15-second periods recorded throughout the supramaximal time to fatigue test, and the O2 deficit summed for the oxygen equivalent of anaerobic capacity (ml·kg−1). Data from the final, partially completed 15-second periods were calculated using a 3rd order polynomial regression:
where y represents the V̇O2 value, x the time to fatigue (s), and c the estimated O2 cost of unloaded cycling (Medbø et al., 1988). The gross efficiency method was based on the methods of Serresse et al. (1988) and Foster et al. (2003) and determined using the mechanical power output, VO2, and respiratory exchange ratio (RER) during the time to fatigue with gross efficiency as previously calculated at 65% peak power output. During the time to fatigue test the average VO2 and RER per 15-second period were recoded and interpolated per second of the 15-second periods completed and in combination with gross efficiency used to determine aerobic contribution to power production and work completed. Any RER >1 was replaced with 1 and assumed attributable to nonmetabolic CO2 production due to bicarbonate buffering. Anaerobic capacity was determined by subtracting the work attributable to aerobic metabolism from the total work completed and presented relative to body mass (J·kg−1).
Interval training intervention
All interval-training sessions were supervised and comprised a 5-minute warm-up, followed by eight 1-minute constant intensity repetitions at a mechanical work rate equivalent to ∼120% of normoxic V̇O2peak, each with a 5-minute active recovery (∼50% normoxic V̇O2peak). Mechanical work rates were determined using individual regression equations as previously described, using test data collected immediately before the 4-week intervention (pre-IT). Participants undertook all interval training sessions on an air- and magnetically-braked cycle ergometer (Wattbike Pro, Wattbike, Nottingham, United Kingdom) and were permitted to view power output and adjusted cadence or resistance to match prescribed intensities as required.
Participants were instructed to maintain an even pacing strategy at the target work rate. All interval training sessions were held in the same 60 m2 climate controlled (19°C–24°C) normobaric chamber with FiO2 altered according to intervention. The hypoxic system provides reduced oxygen availability (simulated altitude) by gas dilution, with the systems delivering a flow rate of hypoxic gas mixture up to 1,000 l/minute (ATS-5KHP, Altitude Training Systems, Australia). During IHT the system was set to simulate 3,000 m of altitude, with O2 confirmed and reported according to a handheld oxygen sensor (Handi+, Maxtech).
Statistical analyses
All data are presented as mean ± standard deviation. Data were analyzed using two-way repeated measures analysis of variance, and statistical significance was set at p < 0.05. In addition, the pre–post change in variables of interest was calculated and defined as the change from the mean of the baseline and pre-IT data compared to the post-IT data. Using the mean of the two baseline tests (where no intervention was imposed) incorporates the physiological and technical variability of measurement for the variables of interest.
A paired t-test was used to compare the within-group change. Furthermore, Cohen's effect size (d) was used to compare the magnitude of pre–post changes with the following thresholds applied: 0.2 = small effect, 0.5 = moderate effect, and 0.8 = large effect (Cohen, 1977). The reliability of time to fatigue and MAOD anaerobic capacity in our laboratory is 6.3% (95% confidence interval [CI]: 4.3–8.3) and 4.4% (95% CI: 3.1–5.8), respectively (Supplementary Data). Pre–post change data can be interpreted with these data in mind.
Results
Group characteristics and training loads
There were no differences between IHT and NORM groups following the 4-week baseline period (Pre-IT) for any participant characteristics, anaerobic, or aerobic test data (Table 2). All participants completed all interval training sessions, and there was no difference between groups for the work rates undertaken during work (IHT: 367 ± 76 W; NORM: 364 ± 47 W) or recovery intervals (IHT: 129 ± 24 W; NORM: 129 ± 14 W). There was no difference in mean weekly training loads between IHT and NORM groups during the 4-week baseline (IHT: 2,940 ± 1,091 AU; NORM: 2,010 ± 1,114 AU) or intervention period (IHT: 2,619 ± 859 AU; NORM: 1,809 ± 1,106 AU). Both groups reported a small decrease in training load during the intervention period (load calculations exclude intervention sessions) compared to the baseline period, with no difference between groups (main effect: −9.2% ± 16.6%, p = 0.02, d = 0.23).
Anaerobic and Aerobic Test Variables (Mean ± Standard Deviation) Assessed at Baseline, Preinterval Training, and Postinterval Training
Data were analyzed using two-way mixed measures analysis of variance, with Bonferroni corrections for multiple comparisons.
Small effect size compared to prior time point.
Moderate effect size compared to prior time point.
Large effect size compared to prior time point.
GE, gross efficiency; IT, interval training; MAOD, maximal accumulated oxygen deficit.
Supramaximal time to fatigue test
There were no interaction or main effects for time to fatigue, work performed, anaerobic capacity, or anaerobic contribution to work calculated by both MAOD and gross efficiency method. There were nonsignificant but small to large effects between time points (Table 2).
When data were expressed as percent change, work performed increased 13.9% ± 12.9% (p = 0.02, d = 0.42, Fig. 2C) and time to fatigue 11.5% ± 14.9% in IHT (p = 0.05, d = 0.54). There were trivial effects on work performed (1.4% ± 21.7%, p = 0.88, d = 0.04, Fig. 2C) and time to fatigue (0.2% ± 24.2%, p = 0.98, d = 0.01) in NORM.
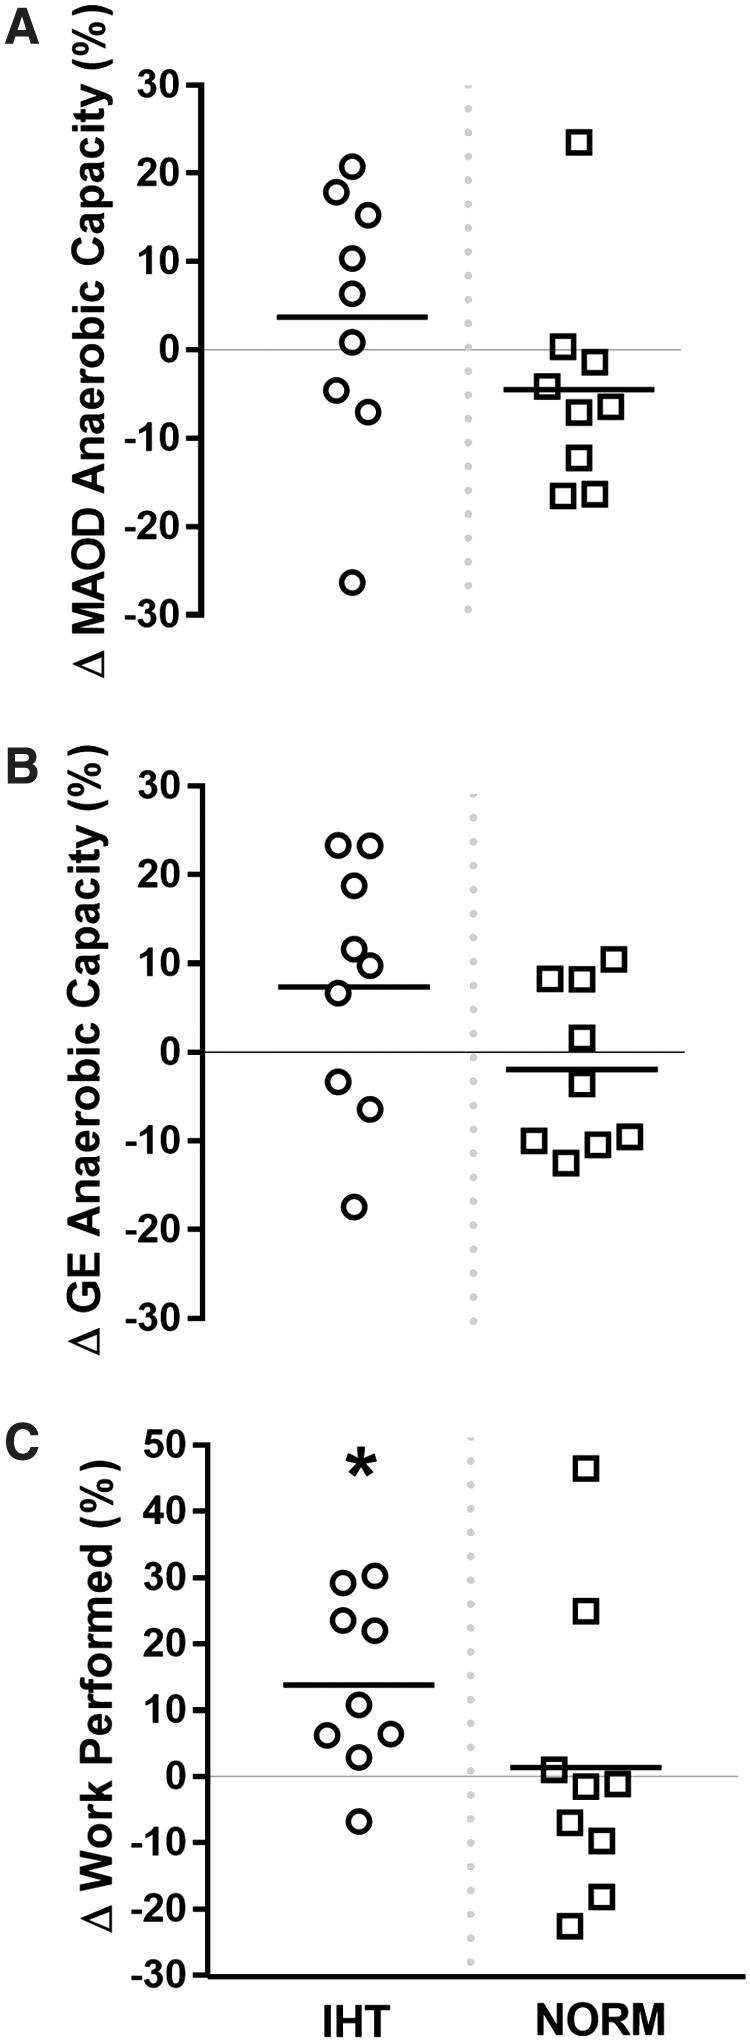
Relative changes (%) in anaerobic variables between the mean preintervention data (BL and Pre-IT) and Post-IT. Data from a supramaximal time to fatigue test determined
MAOD anaerobic capacity
When data were expressed as percent change, there were only trivial changes in MAOD anaerobic capacity (3.7% ± 14.9%, p = 0.74, d = 0.07, Fig. 2A), but the anaerobic contributions to supramaximal exercise were reduced 8.3% ± 10.0% in the IHT group (p = 0.03, d = 0.79). In contrast, there was a small decrease in anaerobic capacity (−4.5% ± 12.1%, p = 0.28, d = 0.37, Fig. 2A), but no change in the anaerobic contributions to supramaximal exercise in the NORM group (−2.9% ± 13.2%, p = 0.39, d = 0.15).
Gross efficiency anaerobic capacity
When data were expressed as percent change, there was a small beneficial effect size on changes in anaerobic capacity calculated using the gross efficiency method (7.4% ± 14.1%, p = 0.27, d = 0.23 Fig. 2B), and the anaerobic contributions to supramaximal exercise was similarly reduced 5.0% ± 12.1% in the IHT group (p = 0.25, d = 0.39). In contrast, there were trivial changes in anaerobic capacity (−1.9% ± 9.2%, p = 0.49, d = 0.16, Fig. 2B) and anaerobic contributions to supramaximal exercise in the NORM group (−1.2% ± 14.7%, p = 0.86, d = 0.04).
Graded exercise test
There were no interaction or main effects for aerobic capacity (Table 2), and there was no interaction but a main effect of time for peak power output during V̇O2peak testing (pre-IT: 4.20 ± 0.67 W·kg−1, post-IT: 4.36 ± 0.65 W·kg−1, p = 0.006, d = 0.24).
When data were expressed as a percent change, there was a small effect for an increased peak power output in the IHT group (5.2% ± 6.6%, p = 0.04, d = 0.32, Fig. 3B), but differences in the NORM training group were trivial (1.6% ± 3.5%, p = 0.19, d = 0.10, Fig. 3B). There were trivial changes in aerobic capacity for both IHT (1.4% ± 6.3%, p = 0.61, d = 0.09; Fig. 3A) and NORM groups (0.9% ± 4.3%, p = 0.55, d = 0.08, Fig. 3A).

Relative changes (%) in aerobic variables between the mean preintervention data (BL and Pre-IT) and Post-IT. Data from a graded exercise test determined
Discussion
The hypothesis of the present study was that eight sessions of steady-state supramaximal, set duration interval training in hypoxia compared with matched training in normoxia would induce a greater training response and enhance anaerobic capacity in endurance cyclists. In contrast to our hypothesis, there was no effect of interval training on anaerobic capacity as measured by the MAOD or gross efficiency methods in either the hypoxic or normoxic group. However, the IHT group showed a small within-group effect for increased capacity to perform work before fatigue during the supramaximal time to fatigue test and the graded exercise test suggesting that there may be practical outcomes associated with this training intervention.
A primary finding of this study was no meaningful change in anaerobic capacity with IHT in endurance trained cyclists. This is the first study to compare the training response of IHT and normoxic groups using a supramaximal constant-load time to fatigue test using the MAOD and gross efficiency methods. Previous studies using various models of IHT have compared changes in different measures of anaerobic performance, but findings are equivocal. For example, studies that have utilized either a single short duration (30–120 seconds) maximal effort test (Morton and Cable, 2005; Millet et al., 2014) or longer duration (∼10 minutes) time trial (Roels et al., 2005, 2007) have reported no benefit of IHT compared with normoxic training; however, it is important to note that these studies used training intensities less than peak power output. In contrast, some studies using various repeated sprint training protocols and tests of repeated sprint ability have shown enhanced anaerobic work/performance compared to equivalent normoxic training (Faiss et al., 2013b; Alvarez-Herms et al., 2016; Hamlin et al., 2017), while others are unclear (Galvin et al., 2013; Goods et al., 2015).
The possibility exists that specific training protocols for distinct athlete populations have the potential to augment anaerobic metabolism for improved repeated sprint ability or anaerobic work without a concomitant increase in measured anaerobic capacity. We extend on this previous work by measuring anaerobic capacity through several methods to show for the first time that IHT sessions incorporating 1-minute bouts of supramaximal cycling above V̇O2peak do not promote an increase in anaerobic capacity in trained cyclists. However, the variability of individual responses within the present study should be considered by practitioners when considering implementation of IHT.
Millet et al. (2014) have undertaken a comparable experimental design to the present study and examined the effect of IHT on an “all out” time trial performance of ∼2-minute duration. Specifically, cyclists completed two sessions per week of IHT (3,000 m), including two sets of 3 × 2-minute intervals at 100% of peak power output in hypoxia, and a single steady-state 60-minute ride at 60% of VO2peak. Our data are in partial agreement with Millet et al. (2014), showing improved peak power output despite no changes in VO2peak. However, in contrast to our findings they report similar peak power output improvements in both groups (IHT: 6.6%; NORM 7.2%), whereas we observed changes in only the IHT group.
Moreover, they show that mean mechanical power output was also improved in the time trial without differences between IHT and NORM groups, while our data show improvements in work capacity during a supramaximal time to fatigue test with IHT only. Interestingly, not only was the intensity of intervals ∼100 W lower in the study of Millet et al. (2014) compared with the present study but also exercise intensity was determined from peak power output achieved in hypoxia; as a result the absolute work rate was ∼50 W lower for IHT than the NORM group in that study. Several other studies have utilized a similar model of exercise prescription (Roels et al., 2005, 2007). We hypothesized that this method of prescription may result in a diluted stimulus with the potential to equalize the anaerobic stress between the different training conditions and may mitigate some aspects of anaerobic adaptation.
In addition, other factors, including an inability to maintain the required work rate and work duration in hypoxia, are factors that may also attenuate the adaptation response (Girard et al., 2013). Nonetheless, despite addressing these concerns in the present study, our data are similar to prior investigations showing a small and moderate within-group effect for improvements in IHT work capacity and time to fatigue, respectively; however, we observed only trivial effects in the NORM group.
An important consideration for our data is that the peripheral nature of adaptation responses in the muscle cell with IHT may not be precisely reflected in the oxygen demand and supply calculated in the anaerobic capacity methods using indirect calorimetry (Hoppeler and Vogt, 2001). Moreover, the increase in work performed during the time to fatigue test following IHT in the present study may indicate a modest improvement in maintaining contractile activity despite accumulation of metabolites and by-products of anaerobic metabolism, mitigating fatigue rather than enhancing anaerobic capacity per se (Faiss et al., 2013b; Alvarez-Herms et al., 2016).
The dynamic time course of contributions of energy systems during short exhaustive exercise also has potential to alter the time to fatigue, an effect that is unrelated to each energy system's maximal capacity. This is likely related to the oxygen kinetics, where the aerobic contribution early in the exercise bout may modify the time to fatigue without a concomitant change in the anaerobic capacity. The decrease in anaerobic contribution after hypoxic training in the present study provides some support for such a contention but the effect was small.
The response to training in the present study was subject to large variation between individuals, and this may have mitigated the potential to detect a change in anaerobic capacity and interaction effects for other measures. Indeed, participant training status is important contextual information in any training study. The participants in our study are classified as trained, performance level 3 according to published guidelines to characterize athletes (De Pauw et al., 2013). As such, improvements in exercise work capacity and adaptation may be relatively small and more difficult to detect compared with untrained individuals, but small changes may be practically meaningful to sports performance of athletes (Lamberts et al., 2009). The sample size in this study was highly comparable to other IHT interventions (Millet et al., 2014), but the observed power for detecting interaction effects for our measures of anaerobic capacity was low (<0.4).
Underpowered chronic training studies in sport science are commonplace because of the substantial challenges in recruiting trained athletes reluctant to disrupt training and competition schedules. Many published studies, including our own, would typically require a much greater sample to be well-powered (Erdfelder et al., 1996). However, it is important to consider that data from smaller studies in trained athletes can be synthesized (e.g., meta-analysis) to make valuable contributions to evidence-based training practices. Nonetheless, whether the outcomes of our current study would be replicated in elite cyclists who are typically more reliable in performance tests is a question for future studies to assess (Lamberts et al., 2009).
Finally, given the training status of our sample, the addition of IHT to each participant's habitual training may have increased training load above typical thresholds for some individuals, and we cannot exclude the possibility that some athletes within this cohort experienced over-reaching during training or retained some extended residual fatigue during postintervention testing.
The duration of hypoxic exposure in short-term intermittent hypoxic training studies is inadequate to induce the hematological changes that are associated with prolonged exposures to hypoxia (Stray-Gundersen et al., 2001; Gore et al., 2006). Accordingly, aerobic capacity in the present study was not different in either the hypoxic or normoxic group following the interval training intervention period, which is in agreement with several previous studies (Roels et al., 2007; De Smet et al., 2016; Hamlin et al., 2017).
Interestingly, there was an increase in peak power output during a graded exercise test in the hypoxic but not normoxic group after the 4-week interval training period. However, the moderate increase in peak power output in the present study could not be attributed to changes in gross efficiency. The adaptive response to IHT could be additive to traditional endurance training through enhanced work capacity above lactate threshold. Indeed, it's clear that the latter stages of an incremental exercise test rely increasingly on anaerobic energy supply (Bertuzzi et al., 2013). It is plausible that small changes in anaerobic capacity or muscle buffering capacity (Faiss et al., 2013a) in response to IHT may be difficult to detect but contribute to improved peak power output in the final stages of a graded exercise test.
Conclusion
This study comprehensively shows that interval training in hypoxia does not appear to enhance anaerobic capacity in endurance cyclists. However, steady-state, set duration intervals completed above peak power output in hypoxia appears to have a small beneficial effect on work capacity during supramaximal and high intensity activity, as determined by effect size analysis. These adaptations may be important to athletic performance regardless of the mechanism responsible.
Footnotes
Authorship Confirmation Statement
D.A. conceived the study, conducted experimental testing, drafted the article, and approved the final version. V.G.C. conceived the study, assisted with experimental testing, edited the article, and approved the final version. N.M.B. conceived the study, edited the article, and approved the final version. T.M.D. assisted with experimental testing, edited the article, and approved the final version. All authors have read and approved the final version of the article.
Author Disclosure Statement
No competing financial interests exist.
Funding Information
This work was supported by the Department of Education and Training, Australia (DA).
References
Supplementary Material
Please find the following supplemental material available below.
For Open Access articles published under a Creative Commons License, all supplemental material carries the same license as the article it is associated with.
For non-Open Access articles published, all supplemental material carries a non-exclusive license, and permission requests for re-use of supplemental material or any part of supplemental material shall be sent directly to the copyright owner as specified in the copyright notice associated with the article.