
Abstract
Ivonina, Natalya I., Andrey A. Fokin, and Irina M. Roshchevskaya. Body surface potential mapping during heart ventricular repolarization in male swimmers and untrained persons under hypoxic and hypercapnic hypoxia. High Alt Med Biol. 22:308–316, 2021.
Background:
In swimmers, as a result of prolonged breath-holding during swimming, first hypoxic hypoxia (HH) and then hypercapnic hypoxia (HCH) occurs, which may influence the electrical activity of the heart (EAH). What type of normobaric hypoxia more strongly affects the EAH—normocapnic HH or HCH?
Methods:
The electrical activity of swimmers' hearts (n = 7) and untrained persons (n = 10) was studied by using electrocardiography (ECG) and body surface potential mapping (BSPM) during the period of ventricular repolarization at baseline, at normocapnic HH, at HCH, and in the recovery period.
Results:
HH led to more significant changes in the EAH in all participants in comparison with HCH. There was no change in the amplitude of T waveECG at hypoxic and HCH, but a change in the amplitude of the minimum was noted in BSPM. The minimum in athletes changed by the end of the exposure (from −0.40 ± 0.12 mV to −0.26 ± 0.11 mV, p = 0.001); in the control, it decreased earlier (after 8 minutes of exposure to HH, the amplitude of the minimum was −0.24 ± 0.08 mV, p = 0.026). With HH, the duration of the QT interval in athletes was shortened due to the shortening of the J-Tpeak (from 250 to 188 ms, p = 0.001) and the Tpeak-Tend (from 98 to 86 ms) intervals. In controls, the decrease in the QT interval was due to the J-Tpeak shortening only (from 280 to 200 ms, p = 0.026).
Conclusions:
In the study of the effect of hypoxia on the EAH during ventricular repolarization, the use of the BSPM has proven to be more informative than the use of traditional ECG. When using potential mapping, more significant changes in ventricular repolarization at HH than at HCH were revealed, whereas the parameters changed less in swimmers compared with the baseline than in controls during both exposures.
Introduction
When training, athletes swim the initial distance with held breath and then continue swimming with a minimum number of breaths. Prolonged holding of breath allows swimmers to swim more efficiently and faster, but this leads to the accumulation of carbon dioxide in the blood and the formation of hypercapnic hypoxia (HCH) (Kapus et al., 2003; Lavin et al., 2015).
Hypoxia changes the blood acid–base balance: A decrease in pO2, accumulation of H+, and an increase in pCO2 are observed, and these factors activate a complex of adaptive reactions of the organism. Arterial and respiratory mechanisms that are regulated by central and peripheral chemoreceptors are the first to change their activity. The triggers for chemoreceptor activity are pCO2 and acidosis (López-Barneo et al., 2008). Adaptation to exercise hypoxia decreases sensitivity to pCO2 in endurance athletes (especially in swimmers) (Viana et al., 2019). Then the question arises, at what type of hypoxia will the changes in the repolarization process of the heart of swimmers be more substantial—hypoxic hypoxia (HH) or HCH?
Under hypoxia, sympathetic activity is enhanced, resulting in increased heart rate (HR) and blood pressure to redistribute blood in the body and supply oxygen to the most energy-consuming organs—the brain and the heart (Hainsworth et al., 2007). If pO2 in the blood remains low, tissue hypoxia forms and it causes a change in the function of organs. Heart function changes as a result of the suppression of the synthesis of macroergic compounds in cardiomyocytes under conditions of oxygen deficiency (Nouette-Gaulain et al., 2005; Holloway et al., 2011). Thus, the electrical activity of the heart (EAH) changes during hypoxia. The process of repolarization of the ventricles of the heart is sensitive to different factors. During acute hypoxia, standard electrocardiography (ECG) showed a decrease in the duration of the QT interval, a shortening or slope in the ST segment, and a change in the morphology and amplitude of the T wave (Coustet et al., 2015). However, such ECG changes are not highly specific and can appear with other functional and morphological changes in the myocardium (Macfarlane and Lawrie, 2011). Registration and analysis of unipolar electrocardiograms from multiple leads on the surface of the chest (body surface potential mapping [BSPM] method) have high sensitivity and help to obtain detailed information about electrophysiological processes (Mirvis 1988; De Ambroggi and Corlan, 2011; Polyakova et al., 2015; Strutynsky et al., 2015; Wissner et al., 2017). The information obtained using this method includes the amplitude, temporal, and spatial components of the signal, and it is used to localize and evaluate the area of ischemic damage of the heart muscle, myocardial electrical inhomogeneity and its hypertrophic remodeling (Magomedova et al., 2016; Tsyganov et al., 2018) and to diagnose cardiac arrhythmias, cardiomyopathies, and myocardial hypertrophy (Bond et al., 2013; Treshkur et al., 2014; Srinivasan et al., 2019).
This research aimed at studying the EAH during the ventricular repolarization process in people with different adaptation to changes in oxygen and carbon dioxide concentrations in the blood (in swimmers and untrained people) under the influence of normobaric HH and HCH.
Methods
Subjects and study design
Subjects underwent tests at baseline, under the exposures to hypoxic normocapnic and HCH, and during the recovery period after hypoxia (breathing with atmospheric air). Adult swimmers were male with the sports qualifications of Candidates for Master of Sports of Russia (n = 7; age—18 ± 1 years, weight—69.4 ± 3.7 kg, height—175 ± 3 cm). The control group comprised healthy untrained adults (n = 10; age—22 ± 2 years, weight—70.1 ± 2.2 kg, height—178 ± 4 cm). The study was conducted in accordance with the ethical principles of the WMA Declaration of Helsinki (1964, ed. 2013) and approved by the Ethics Review Board of the Federal Research Centre “Komi Science Centre of the Ural Branch of the Russian Academy of Sciences.” Written informed consent was obtained from all participants.
Experimental protocol
Baseline
In each subject at the initial state, we measured the HR and hemoglobin saturation (SpO2) by using an oximeter (EnviteC, Germany). Subjects underwent study at rest when they were sitting.
The heart's electrical activity in young men was studied by the method of standard ECG with 12 leads (Poly-Spectrum-8, 12-channel Digital ECG System, Neurosoft, Russia) and the BSPM method during ventricular repolarization. During both tests, the leads from the limbs were positioned on the wrists and ankles. At baseline, ECG from 12 standard leads was recorded independently from BSPM. Initially, traditional ECG was registered; then, multichannel ECG was registered.
During HH and HCH, electrocardiograms in the leads V1–V6 were registered from the electrodes for mapping. The analysis of the electrocardiograms obtained by the method of standard ECG with 12 leads was conducted automatically with a software package (Poly-Spectrum.NET/Analysis software for ECG measurement). The researcher (the same person) double checked the obtained ECG-curves manually with a screen graticule. In lead II of the ECG, the QT, R-R, J-Tpeak, and Tpeak-Tend intervals were determined; the corrected QT interval (QTc) was calculated by using the Bazett formula. The QT interval was measured from the beginning of the QRS complex to the end of the T wave. We used the tangent method (Postema and Wilde, 2014)—a tangent drawn to the steepest last limb of the presumed T wave to define the end of the T wave as the intersection of this tangent with the baseline. The TP segment was used as an isoelectric baseline (Rautaharju et al., 2009). It was performed on-screen on digitized ECGs and the average QT of 3 or more beats.
BSPM with 64 unipolar leads covering the thorax was performed, referenced to a Wilson Central Terminal derived from leads I, II, and III. ECGII with time marker is shown below each map, R peak is correspondent to 0 ms. The BSPM electrodes located evenly on the ventral and dorsal surfaces of the torso with a distance of 3–5 cm were used. The electrodes were attached to 8 flexible strips, each containing eight electrodes. BSPM signal visualization quality was checked before measurement. BSPM was recorded at baseline, at the exposure to hypoxia, and in the recovery period and was analyzed by using instantaneous equipotential maps, which reflected the EAH at any given moment on a flat pattern of the body surface aligned to a rectangular plane, the left side of which corresponded to the ventral area, and the right side of which corresponded to the dorsal area of the body (Roshchevskaya 2008). We analyzed the amplitude characteristics of the positive and negative extrema of BSPM on the thoracic surface (the amplitudes of the maximum and the minimum, respectively) and the temporal characteristics—the time when the extrema reached the maximum amplitudes during ventricular repolarization (the maximum time [tmax] and the minimum time [tmin], respectively). Registration of the bipolar and unipolar cardiac signals (ECG and BSPM) was performed only in digital format.
After registration of the BSPM cardio-electric potentials at rest, the researchers put the face mask on the subject and carried out the hypoxic or HCH exposure.
Exposure to HH and HCH
Exposure to HH and HCH was performed on different days, with a one-day rest period.
Exposure to HH was done by breathing through a face mask connected by a tube to a plastic bag for the gas mixture. HH was simulated by using a concentrator model Tibet-4 (SibMedico, Russia), which produces a normobaric hypoxic mixture with a reduction in the O2-fraction—10% and maintaining the N2-fraction—88%, CO2-fraction—0.04%. An O2-sensor (model MySign, EnviteC) controlled the pO2 of the gas mixture. Each subject breathed the HH gas mixture for 15 minutes.
Exposure to HCH was made by using rebreathing with a hypoxic gas mixture with the medical diagnostic stimulator “Carbonic” (Carbonic, Russia). It created HCH in the alveolar air by automatically adjusting the volume of dead space (with a reduction in the O2-fraction—15% and maintaining the N2-fraction—78%, CO2-fraction—4–5%). Carbonic Software, v. 2.00, and the oxygen sensor (model MySign, EnviteC) monitored the concentration of O2 and CO2 in the exhaled air. The duration of the exposure to HCH for each subject was 20 minutes.
The parameters HR, SpO2, ECG, and BSPM cardio-electric potential were recorded each minute of the exposure to HH and HCH.
After that, the face mask was removed and the subject breathed the atmospheric air for 5 minutes (the recovery period after exposure), with HR, SpO2, and cardio-electric potential being recorded every minute.
Statistical analysis
Statistical analysis was performed by using the statistical software SPSS version 22.0. Data were expressed as mean ± standard deviation or mean ± standard error of the mean or median (interquartile range) according to statistical distribution (assumption of normality was assessed by using the Shapiro–Wilk test). For data with normal distribution, inter-group comparisons were performed by using Student's t-test. Differences of continuous variables departing from the normal distribution were tested by the Mann–Whitney U-test and Wilcoxon matched-pairs test. The probability value of p < 0.05 was considered statistically significant.
Results
Impact of HH and HCH on the HR, SpO2 measurements
Changes in HR and SpO2 in swimmers and untrained people under the impact of HH and HCH are shown in Figure 1. The HR in swimmers during HH showed a more substantial increase from 8 to 15 minutes of hypoxic exposure, compared with untrained people (Fig. 1).
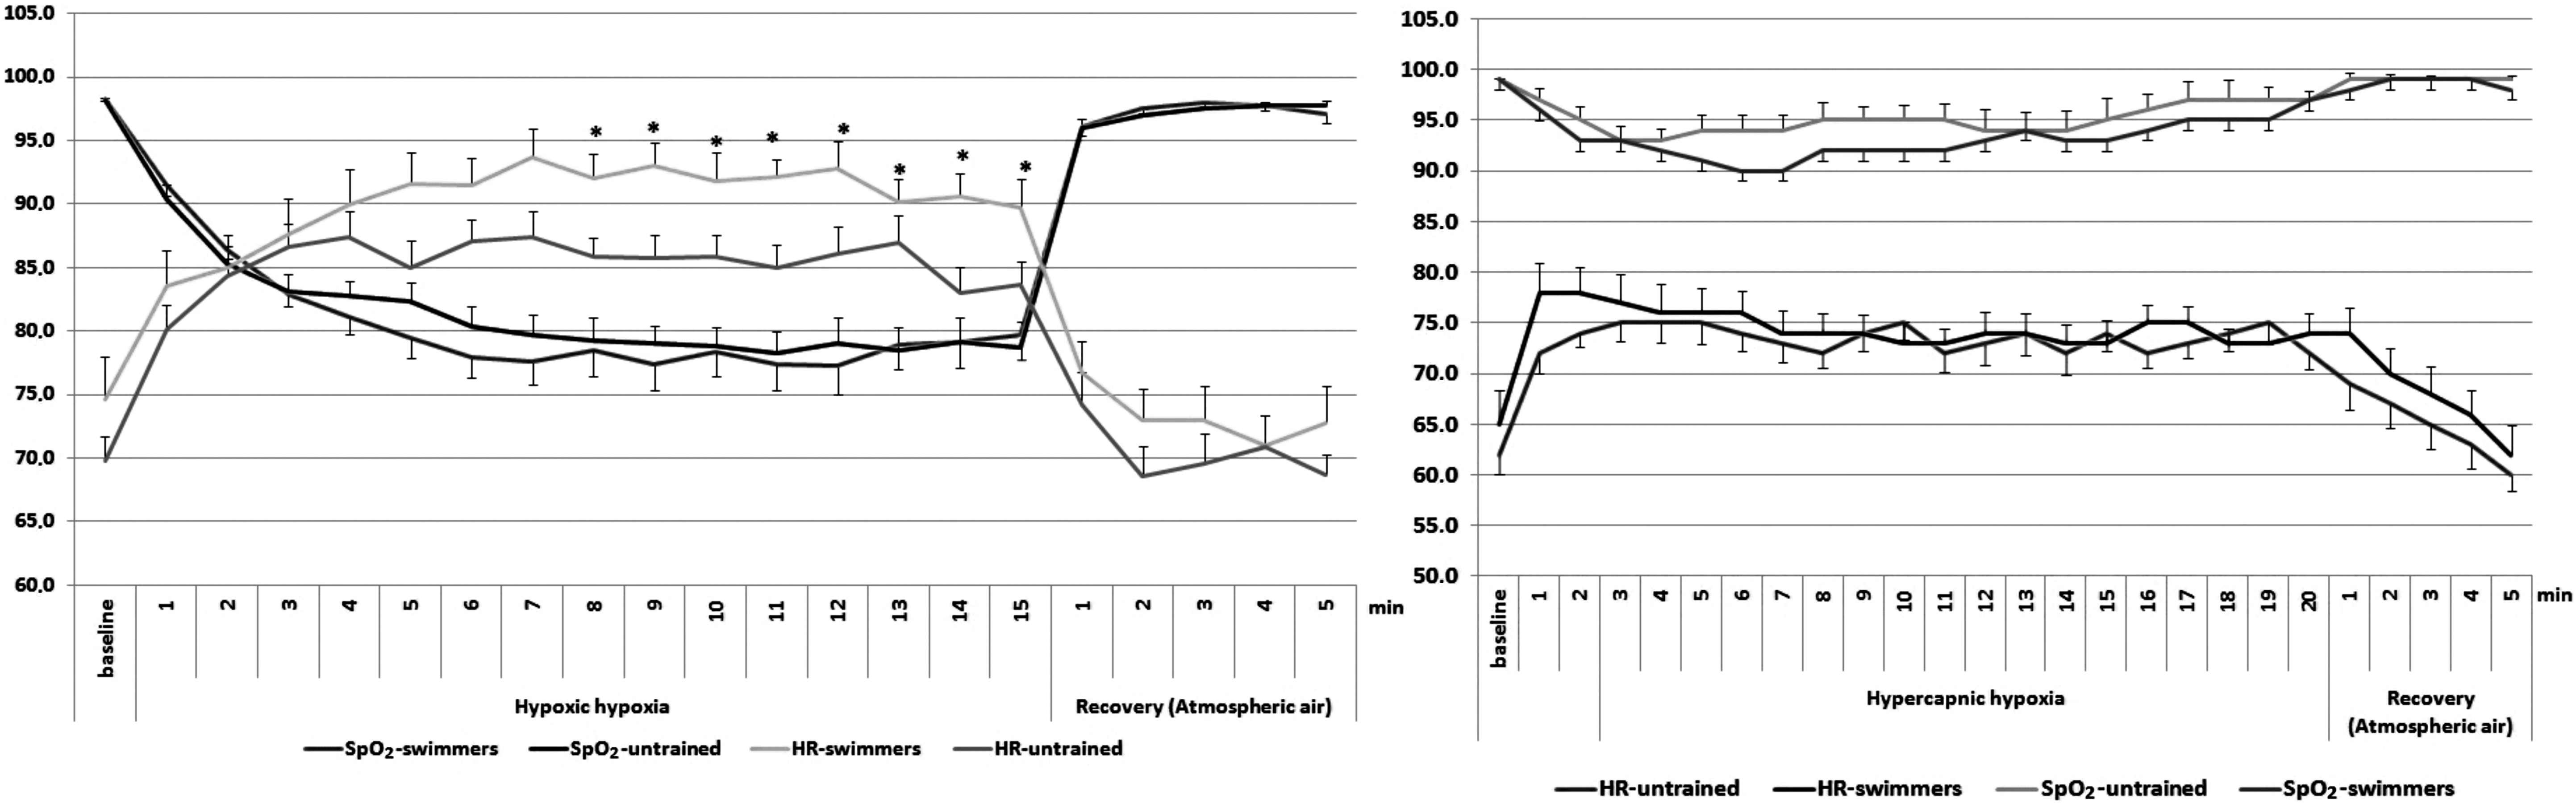
HR and SpO2 in swimmers and untrained people at baseline, under HH, under HCH and recovery period (M ± SEM). *In comparison between swimmers and untrained people (p < 0.05). HCH, hypercapnic hypoxia; HH, hypoxic hypoxia; HR, heart rate; M, mean; SEM, standard error of the mean.
Under HCH in swimmers, HR and SpO2 did not statistically differ in comparison with untrained people.
Spatial characteristics of BSPM at baseline
During the EHA test at HH and HCH, we did not reveal a significantly altered breathing pattern and respiratory artifacts. Thus, the visualization of cardioelectric signals was sufficiently clear for the interpretation of the results.
At rest, swimmers and controls demonstrated a similar formation of positive and negative zones of BSPM during the period of ventricular repolarization. During the STII segment, no precise position of the zones and extrema in all subjects was observed. At the beginning of the TII wave, the positive zone was located on the ventral or left-lateral parts, whereas the negative zone was located on the dorsal and right-lateral parts of the torso in all subjects. The maximum was localized on the left parasternal line or midclavicular line in the area of 5–7 intercostal space. The negative extremum was observed on the back in the area of the right shoulder. At the peak of the TII wave in all subjects, the zone of electropositivity was displaced left-laterally; the zone of electronegativity took the right-lateral and right half of the dorsal and ventral sides of the torso. The maximum was located on the left parasternal or midsternal line. The minimum was localized in the upper part of the back, or it moved to the area of the right clavicle on the ventral side. At the end of the TII wave, the zone and the maximum of positive potentials were located on the ventral side of the thorax, the minimum and the zone of negative potentials—on the dorsal and right-lateral sides (Fig. 2).

The instantaneous equipotential maps during period of the ventricular repolarization in untrained subject U.D. at baseline, under HH, and under HCH (
During HH and HCH, the formation and localization of the zones of the electronegativity and electropositivity were not changed, but at the moment corresponding to the beginning, apex, and the end of the T wave, the changes in the amplitudes and time of reaching the maximum values of positive and negative extrema were observed.
Amplitude characteristics of standard ECG and BSPM in swimmers and untrained people at baseline, under the exposure to HH and HCH
Using the standard ECG method, there were no statistically significant differences in the amplitude of the T wave in the initial state between athletes and untrained people (Table 1).
Amplitude of the T Wave in Swimmers and Untrained People at Baseline on Standard Electrocardiography [Me (Q1; Q3)]
aVF, the augmented unipolar left leg lead; aVL, the augmented unipolar left arm lead; aVR, the augmented unipolar right arm lead.
Under the influence of HH and HCH, the amplitude of the T wave did not significantly change in athletes or untrained people. However, under HH, a slight decrease in the amplitude of the T wave V4–V6 in people of both groups was observed.
In the initial state, the amplitudes of the extrema of BSPM in swimmers were as follows: maximum 0.63 ± 0.09 mV (236.9 ± 26.0 ms after the peak RII), minimum −0.40 ± 0.12 mV (201.65 ± 59.15 ms). In untrained people, the corresponding amplitudes were as follows: maximum 0.70 ± 0.19 mV (222.10 ± 15.3 ms), minimum −0.30 ± 0.11 mV (238.0 ± 18.3 ms) (p < 0.05 in comparison with swimmers).
During HH, the amplitude of the maximum in all subjects did not change significantly. The amplitude of the minimum decreased in the following way: In untrained people, it significantly (p = 0.026) reduced in the 8th minute of HH exposure to −0.24 ± 0.08 mV and did not increase until the end of the exposure (in the 15th minute −0.22 ± 0.05 mV). In swimmers, the amplitude of the minimum decreased gradually with a significant (p = 0.001) decrease being observed only in the 15th minute of exposure to −0.26 ± 0.11 mV.
During HCH, there were no significant changes in the amplitude of positive and negative extrema in athletes or untrained people.
Temporal characteristics of standard ECG and BSPM in swimmers and untrained people under exposure to HH and HCH
During HH and HCH, a significant decrease in the duration of the QTII interval and the J-TpeakII interval in comparison with the initial stage was observed in all participants. At HH, the shortening of the intervals was significant in the athletes and the controls during the first half of the exposure period, with HCH being significant in the second half of the exposure (p < 0.05).
The Tpeak-TendII interval became insignificantly shorter compared with the initial state in all participants. During HCH, no changes in the duration of the Tpeak-TendII interval were observed.
During HH (until the 3rd minute of exposure) and HCH (until the 1st minute of exposure), a significant decrease in the duration of the QTcII interval in comparison with the untrained persons was observed in swimmers (Fig. 3).

The durations of the QTII, QTcII, J-TpeakII, and Tpeak-TendII intervals in swimmers and untrained people at baseline, under HH, under HCH and recovery period (M ± SD). *In comparison between swimmers and untrained people (p < 0.05). SD, standard deviation.
The extrema reached their maximum values during repolarization under the influence of HH at every minute of exposure significantly earlier compared with the baseline in all participants. The tmin from the first to the 7th minute of HH was longer in athletes than in the controls (p = 0.026), but from the 10th minute, it decreased even greater than in untrained people (p = 0.040). The tmax for swimmers was longer with each minute of HH exposure; during the recovery period, it returned to its initial value for 2 minutes of recovery; and the control group did not recover within the first and second minutes after HH (p = 0.027) (Fig. 4).
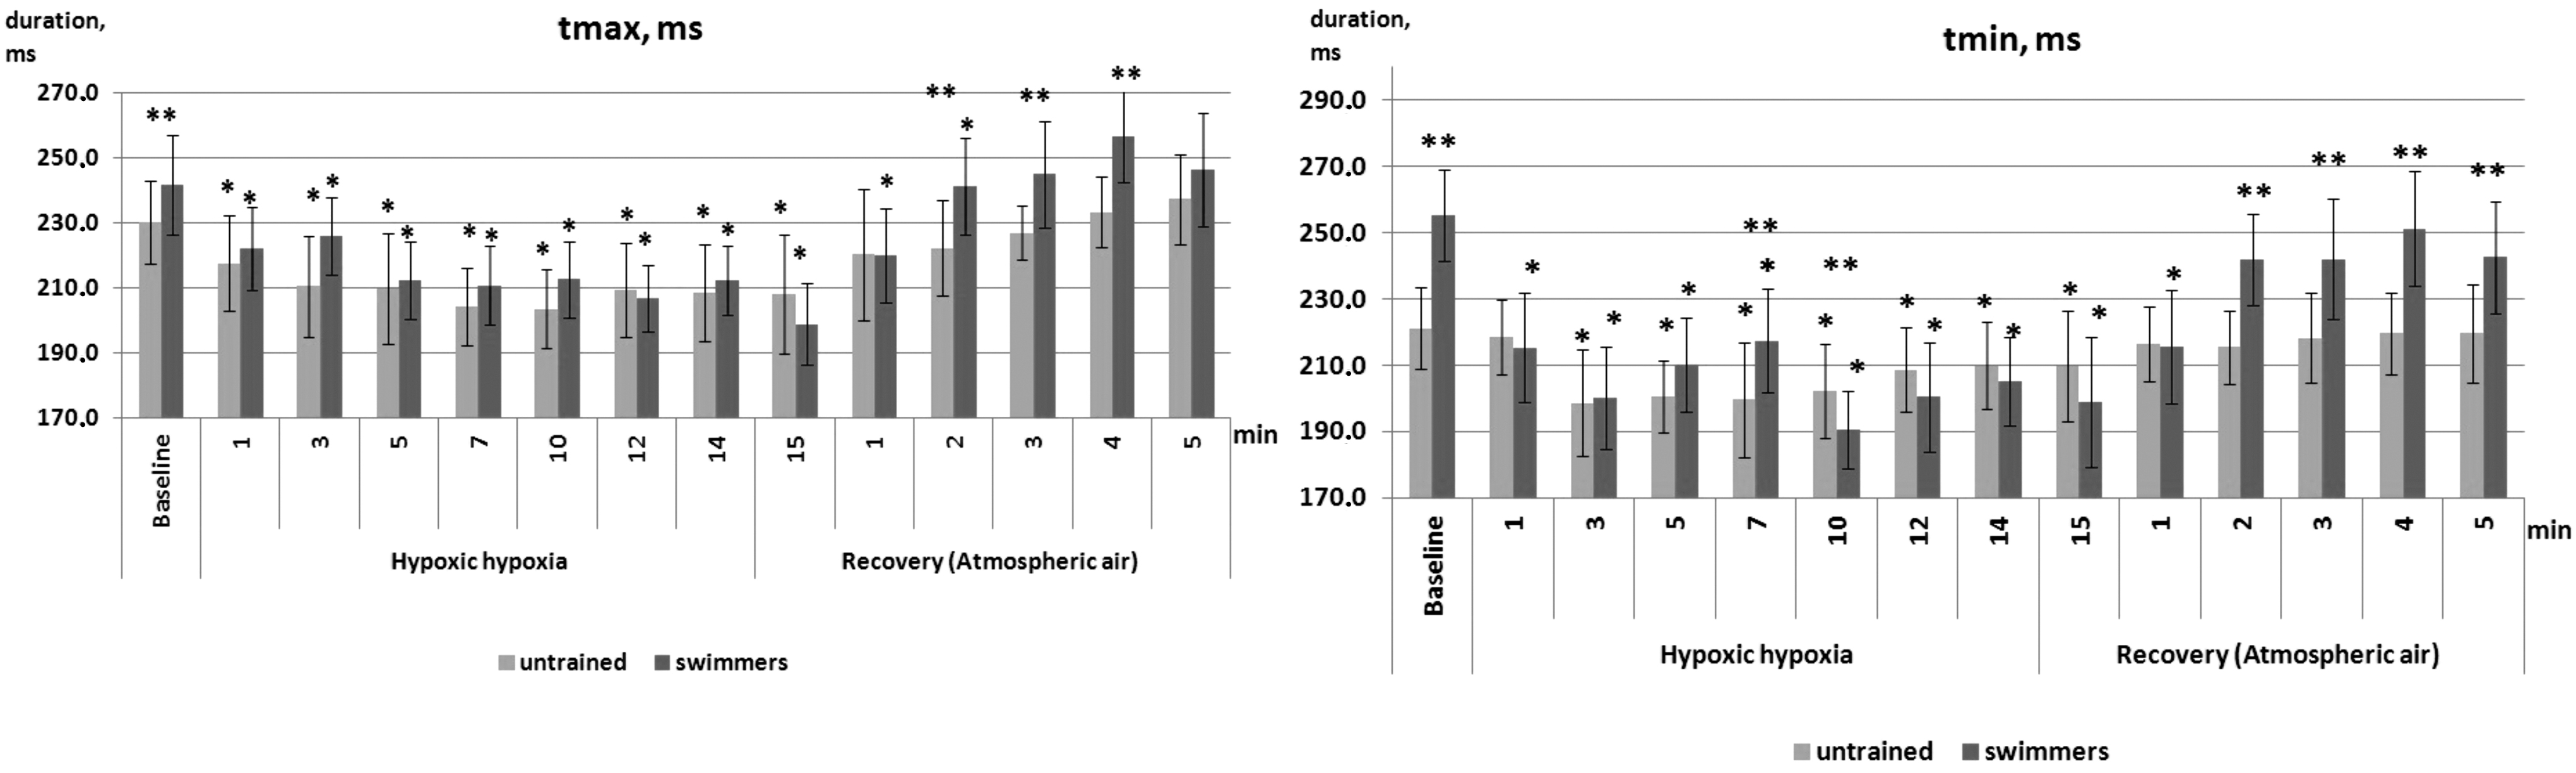
The temporal characteristics of the BSPM extrema during ventricular repolarization in subjects at baseline, under HH and recovery period (M ± SD). p < 0.05 in comparison to: *baseline, **between swimmers and untrained people. BSPM, body surface potential mapping.
Under the influence of HCH, the tmax and tmin decreased evenly. In the swimmers, tmax was slightly larger and tmin was less than in the controls. Statistically significant differences between tmax and tmin in all participants were noted at the baseline, at the beginning of HCH, and during recovery (Fig. 5).
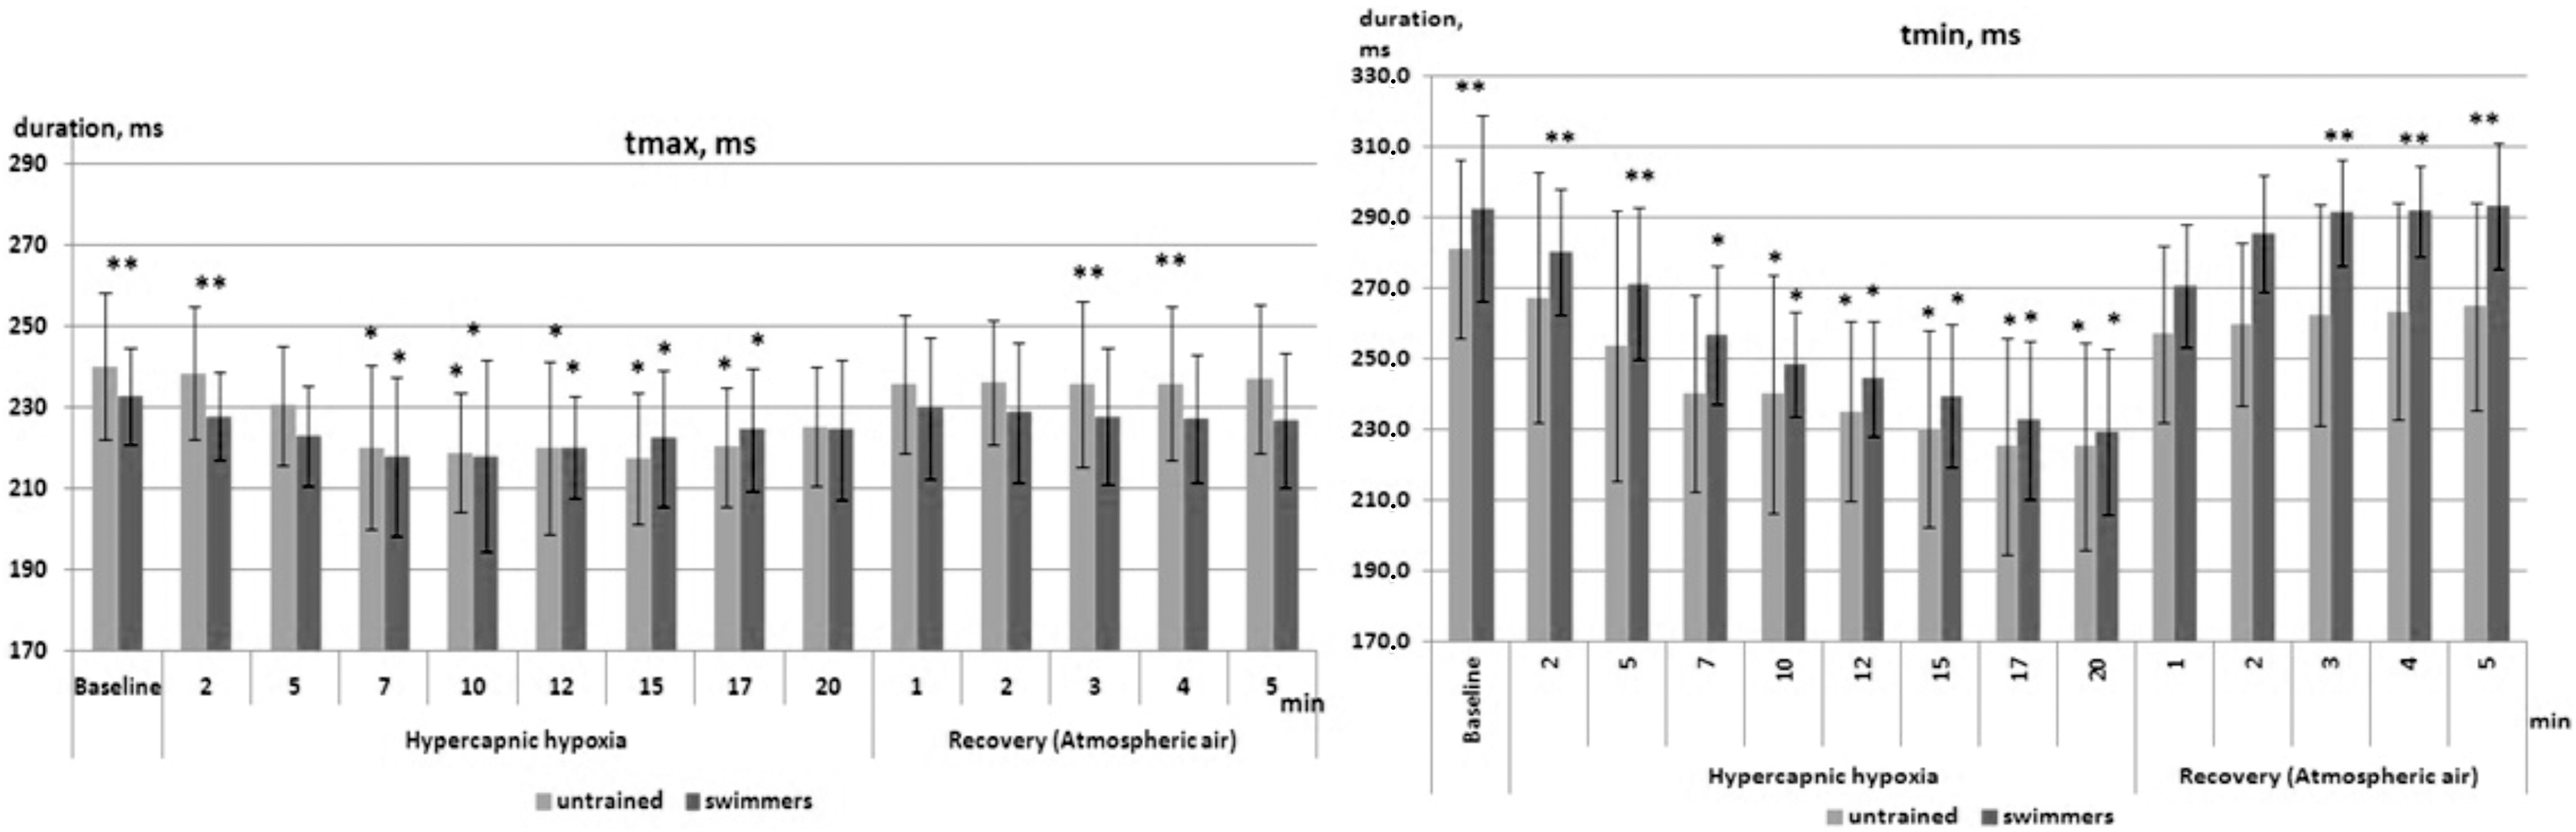
The temporal characteristics of the BSPM extrema during ventricular repolarization in subjects at baseline, under HCH and recovery period (M ± SD). p < 0.05 in comparison to: *baseline, **between swimmers and untrained people.
Thus, it was found that the main changes in the EAH in athletes and untrained people under the influence of HH and HCH were manifested in changes in the temporal characteristics of standard ECG and BSPM: the duration of the QTII, J-TpeakII, and Tpeak-TendII intervals, tmax and tmin.
Discussion
Reactivity to hypoxia from hemodynamic parameters in swimmers is higher than in untrained persons as a result of long-term adaptation to hypoxia. During swimming, swimmers have the PaO2 and PaCO2 in the blood equal to 10.7 kPa and 5.5 ± 0.8 kPa, respectively (Kapus et al., 2003).
In comparison with untrained persons, in swimmers, HR and SpO2 changes occurred earlier and more substantially, and the recovery was also faster (Krivoschekov et al., 2013). The results obtained in athletes and controls during HH and HCH agreed with these data.
Different reasons can lead to a change in the electrical activity of the myocardium on the thorax surface of humans during changes in the concentration of gases in the blood.
The first compensatory reactions at hypoxia lead to the improvement of blood supply to the heart, the increase in pulse and systemic blood pressure occurs (Hainsworth et al., 2007), the diameter of small vessels increases due to the relaxation of smooth muscles (Marshall, 1994), and these changes affect the venous return to the heart.
Factors that influence the signal transfer from the heart to the thorax surface are called extracardiac factors (Nelson and Geselowitz, 1976). For example, an increase in the blood volume in the cavities of the heart can change the amplitude characteristics of the cardiopotential as a result of the Brody effect (Amoore, 1985).
However, for the Brody effect, an increase in blood volume in the heart should be more than 30%, but such an increase is not observed at short-term hypoxia (Stembridge et al., 2015). The distance from the heart to the recording electrodes on the thorax surface also affects the amplitudes of the cardiopotential (Saltykova et al., 2003). The authors' previous studies showed that in healthy volunteers at acute normobaric hypoxia over 15 minutes there was no significant change in the breath pattern (Zamenina et al., 2019). It was shown that at acute hypoxia, the cardiac function was activated, whereas during hypercapnia, the carotid bodies additionally stimulated respiration (Honda, 1992; Brown et al., 2014). We did not observe changes in the respiratory rate and depth in all subjects; therefore, the pattern of respiration could not lead to changes in the EAH.
Secondary adaptive reactions during changes in blood gases occur at the level of organs and tissues and lead to metabolic disorders. Factors that change surface cardiopotential due to morpho-functional changes in the heart are called intracardiac factors (Nelson and Geselowitz, 1976). Hypoxia inhibits mitochondrial activity and ATP production, which affects the ion channels in cardiomyocytes and reduces the activity of energy-dependent pumps and the calcium transport system (Shimoda and Polak, 2011). As a result, ion current changes occur, which determine the action potential of cardiomyocytes: Na+ (Ju et al., 1996), Ca2+ (Movafagh and Morad, 2010), and K+ (Hool, 2004). Changes in the EAH cells lead to changes in the ECG. Under hypoxia, changes occur in the morphology and amplitude of the T wave, in the position of the ST segment, without significant changes in the duration of QTECG (Coustet et al., 2015). In addition, the repolarization process is evaluated by the duration of the J-Tpeak and Tpeak-Tend intervals (Antzelevitch and Fish, 2001; Shimizu et al., 2002; Haarmark et al., 2009).
The present study showed that in swimmers, the QTII and J-TpeakII intervals decreased to a less extent than in controls, with the decrease in these intervals being more substantial under HH than under HCH in all participants. During HH and HCH, the changes in the QT interval in most of the participants occurred due to the change in the J-Tpeak; therefore, the significantly longer QTc interval in untrained persons was due to the change in the RR interval, that is, HR.
The Tpeak-TendII interval did not change significantly. On animal models, it was shown that the period from the beginning to the T-wave peak corresponded to the repolarization of the subepicardium, and the period from the T-wave peak to the end of it corresponded to the end of myocardial repolarization (Yan et al., 2003). In the present study, the authors showed the change in the duration of the J-TpeakII period from the first minutes of HH, which may indicate that heart adaptation is reflected in the shortening of the period of early repolarization.
Using BSPM during the period of ventricular repolarization in healthy adults, variants of the distribution of zones and extrema of cardiopotentials on the torso surface were described (Roshchevskaya, 2008; De Ambroggi and Corlan, 2011). Therefore, in the initial state and under HH and HCH, the location of the zones and extrema of cardiopotential in swimmers and untrained people corresponded to those in healthy subjects.
No high correlation was observed between the temporal characteristics of extrema and the duration of the action potential of cardiomyocytes in different regions and layers of the heart. This fact implies that if the total duration of the repolarization process is not modified, a change in the period when the extrema reach their maximum values may indicate a change in the internal structure of repolarization (Mirvis, 1988). During ventricular repolarization, the positive extremum reaches its maximum values at the ascending phase of the T wave (Nelson and Geselowitz, 1976; De Ambroggi and Corlan, 2011), which is in the J-TpeakII. Under HH, the J-Tpeak interval differed significantly between swimmers and controls from the 1st up to the 10th minute of exposure, and at HCH, the difference occurred only in the first and last minutes of exposure. Tmax did not differ significantly during exposure between the swimmers and controls. The negative extremum in humans reached its maximum in the descending phase of the T wave (Mirvis, 1988), which corresponded to the Tpeak-Tend interval. The authors showed shortening in tmin at each minute under HH and HCH compared with the baseline, but under HH, the difference between swimmers and controls reached its peak in the middle of the exposure period. Consequently, in comparison with HCH, exposure to HH led to more significant functional changes in both swimmers and controls.
Conclusion
Using standard ECG and equipotential BSPM maps, the analysis of the cardio-electric potential on the torso revealed more significant changes in the repolarization of the heart under HH than HCH, with changes in swimmers being less significant than in untrained people during both exposures. In the structure of the ventricular repolarization process, the temporal characteristics of the cardiopotential and the duration of the QTII and J-TpeakII intervals changed, and no significant changes were observed in the amplitude parameters.
Limitation of the Study
The present article describes the results of the influence of HH and hypercarpnic hypoxia. However, because of the method of rebreathing, the authors dealt with hypoxia of different levels additionally influenced by hypercarpnia. Thus, the observed results can be discussed without their separation into hypercarpnia and hypoxia (HCH exposure).
Footnotes
Authors' Contributions
A.A.F. participated in the design of the study, contributed to data collection and data reduction/analysis; N.I.I., A.A.F. participated in the design of the study and contributed to data collection; N.I.I. contributed to data reduction/analysis; and N.I.I., I.M.R. contributed to data analysis and interpretation of results. All authors contributed to the article writing. All authors have read and approved the final version of the article, and they agree with the order of presentation of the authors.
Author Disclosure Statement
No competing financial interests exist.
Funding Information
This work was supported by the scientific research work of the Department of the Comparative Cardiology (AAAA-A18-118012390260-9).