
Abstract
Çolak, Rıdvan, Eda Ağaşcıoğlu, and Ufuk Çakatay. “Live high train low” hypoxic training enhances exercise performance with efficient redox homeostasis in rats' soleus muscle. High Alt Med Biol. 22:77–86, 2021.
Background:
Different types of hypoxic training have been performed to improve exercise performance. Although both “live high train high” and “live high train low” techniques are commonly performed, it is still obscure as to which one is more beneficial.
Materials and Methods:
Eight-week-old male Sprague-Dawley rats were randomly divided into aforementioned experimental groups. After a familiarization exercise (4-week, ∼15–30 minutes/day) at normoxia, all rats exercised (4-week, ∼35 minutes/day) at hypoxia with their pre-evaluated maximal aerobic velocity test. The soleus was extracted after the test following 2 days of resting.
Results:
The live high trained low group displayed better performance than the live high trained high (p = 0.031) and the live low trained low (p = 0.017) groups. Redox status biomarkers were higher in the live high trained high group except for thiols, which were illustrated with no difference among the groups. Further, contrary to total and protein thiols (r = 0.57, p = 0.037; r = 0.55, p = 0.042 respectively), other redox status biomarkers were observed to be negatively correlated to exercise performance.
Conclusions:
The live high trained low group could consume more oxygen during exercise, which might lead to having a better chance to ensure cellular redox homeostasis. Therefore, this group could ensure an optimum exercise performance and anabolic metabolism.
Introduction
Hypoxia is defined as insufficient oxygen supply to the whole body, tissues, organs, or cells (Höpfl et al., 2003). In a hypoxic state, some of the metabolic and physiological adaptive responses take place in the body (Chaudhary et al., 2012). One of the adaptive responses is the formation of reactive oxygen species (ROS) (Mohanraj et al., 1998; Askew, 2002; Magalhães et al., 2005; Murray, 2009). ROS formation is also a necessary factor for both exercise (Dutta et al., 2008; Goldstein and Mcnally, 2010; Reid and Moylan, 2011; Lewis et al., 2015; León-López et al., 2018) and hypoxic adaptation (Magalhães et al., 2005, 2014; Agrawal et al., 2017). Cellular signal transduction, vascular tone, and sensing oxygen tension are regulated by ROS (Dröge, 2002; Xu et al., 2008). According to the hormesis stress theory, ROS formation may occur in muscle during endurance training as an adaptive response (Radak et al., 2005; Ji et al., 2006). It needs to be regulated with redox homeostasis in muscular cells and protects them from ROS-induced oxidative damage. Therefore, various training models at hypoxia have been previously examined to improve the performance of endurance athletes (Bailey et al., 2001; Wilber et al., 2004; Devi et al., 2007; Pialoux et al., 2009, 2010; Rodríguez et al., 2015; León-López et al., 2018). For a long time, the classical altitude training approach is “live high train high,” which has been applied by endurance athletes to improve their performance at low altitudes, that is, sea level (Dick, 1992; Suslov, 1994). However, the improving effects of a “live high train high” training approach on a low altitude exercise performance have been previously questioned (Bailey and Davies, 1997; Böning, 1997; Xu et al., 2012; Debevec et al., 2014). Afterward, the new approach of training high altitude “live high train low’’ has recently become popular (Levine and Stray-Gundersen, 1997; Stray-Gundersen et al., 2001; Brugniaux et al., 2006; Pialoux et al., 2009, 2010; Li and Zhang, 2011; Li and Wang, 2013).
According to the current literature, both of these hypoxic training approaches exhibit better results regarding exercise performance and optimum levels of redox homeostasis than training at normoxia. However, studies including both training approaches showed that the “live high train low” approach is more effective in improving athletic performance than the classical “live high train high” approach (Miyazaki and Sakai, 2000; Stray-Gundersen et al., 2001; Rusko et al., 2004; Wehrlin and Marti, 2006). In the “live high train high” approach, rats exercised at an altitude of 4,300 m for 4 weeks (5 days/week and 15–60 minutes/day), and then they exhibited improved exercise performance at a normoxic condition (Xu et al., 2012). Further, the rats' performance at sea level in a “live high train low” exercise environment was also reported to have increased (Miyazaki and Sakai, 2000).
Human hypoxic exercise studies also presented similar results: An enhanced normoxic exercise performance was reported after bicycle training for 4 weeks at intermittent hypoxia (16% of O2, ∼3,000 m), (Bailey et al., 2001). Athletes, who lived at an altitude of 1,800 m attained a higher performance during an acute severe exercise with 21% of O2 supply (Wilber et al., 2004). In most of the studies related to training at hypoxia, the blood samples were collected from the resting participants (Levine and Stray-Gundersen, 1997; Stray-Gundersen et al., 2001; Brugniaux et al., 2006; Pialoux et al., 2009, 2010). However, only a limited number of studies have investigated the effects of hypoxic training on skeletal muscles (Miyazaki and Sakai, 2000; Li and Zhang, 2011).
In our study, a slow-twitch soleus muscle was chosen to assess redox homeostasis. Although gastrocnemius includes both fast- and slow-twitch fibers (type I and II), soleus consists of mainly slow-twitch fibers (Gollnick et al., 1974; Edgerton et al., 1975). The mitochondria-rich soleus exhibits a higher rate of mitochondrial oxidative metabolism (Yanar et al., 2019). The oxygen concentration sensitive soleus is one of the most affected muscle types during endurance and hypoxic training. An excessive ROS formation rate may occur as an adaptive response during endurance training (Radak et al., 2005; Ji et al., 2006) and hypoxia (Ağaşcıoğlu et al., 2019). It was reported that the soleus is more prone to ROS-mediated oxidative damage than the gastrocnemius (Yanar et al., 2019).
It was reported that the lipid hydroperoxides (LHPs) were found to be higher in the cardiac muscle (Devi et al., 2007; Ağaşcıoğlu et al., 2019) and systemic circulation after hypoxic exposure (Devi et al., 2007). In the human-related hypoxic exercise studies, similar results were also observed (Bailey et al., 2001; Wilber et al., 2004). After intermittent hypoxic exercise, the plasma level of the lipid peroxidation rate was found to be even lower than it was at sea level (Bailey et al., 2001). No difference in plasma levels of GSH and lipid peroxidation products were found in athletes who performed the live high train low approach (Wilber et al., 2004). Only one study focused on the skeletal muscle of the lipid peroxidation rate in the live high train low group, which was lower than the live high train high group (Li and Zhang, 2011).
Thiol (-SH) groups of proteins may serve as a part of the nonenzymatic antioxidant systems and are also known as redox status biomarkers. The total thiol (T-SH) fraction consists of both protein thiol groups (P-SH) and nonprotein thiol groups (Np-SH) (Cebe et al., 2014). A reduced form of glutathione (GSH) is presented in the high percentage of the Np-SH fraction (Çakatay et al., 2003; Cebe et al., 2014). It was previously demonstrated that the concentration of the T-SH fraction decreases (Dalle-Donne et al., 2003), and GSH transforms into its oxidized form by an ROS attack at hypoxia (Mansfield et al., 2004).
Advanced oxidation protein products (AOPP) include a group of nonenzymatic oxidative products such as dityrosine, pentosidine, and protein carbonyl groups (Capeillère-Blandin et al., 2004). The soleus muscle is reported to be prone to oxidative protein damage (Yanar et al., 2019), and therefore, we thought that assessing the AOPP formation rate in the soleus muscle at hypoxic training period is worth investigating. Besides, to the best of our knowledge, this study is the first performed research assessing the AOPP formation rate in the soleus muscle at a hypoxic training.
A limited number of studies report a negative correlation between exercise performance and the levels of redox status biomarkers in human subjects (Bailey et al., 2011; Knez et al., 2014; Tsuzuki et al., 2019). A strong negative correlation between the lipid peroxidation rate and exercise performance was also previously reported (Knez et al., 2014). A negative relationship was found between the running performance in the first part of the simulated duathlon race and oxidant potentials (Tsuzuki et al., 2019). On the other hand, a strong positive correlation between exercise performance and plasma thiol groups were also reported by Bailey et al. (2011). Aforementioned, the correlations may be explained with the presence of the thiol fraction as a part of the nonenzymatic antioxidant defense system.
The ROS formation rate has a significant effect on hypoxic exercise performance. The compensation of muscular oxygen requirements during exercise is also important for performance (Kenney et al., 2014). Exercise performance at hypoxia also depends on the protein concentration of skeletal muscle. Myofibrillar proteins form a higher percentage of skeletal muscle proteins (Naito et al., 2000; Chaudhary et al., 2012). Hypoxic exposure leads to atrophy (Chaudhary et al., 2012). Skeletal muscle atrophy named sarcopenia leads to poor exercise performance (Kenney et al., 2014).
The current findings of experimental studies show that the live high train low approach seems to be more effective in advanced exercise performance, though it is still obscure how this approach improves performance. Besides, the importance of the soleus muscle redox status biomarkers in hypoxic exercises is currently not known. Most of the assayed samples were obtained from the blood of human subjects and experimental animals for the studies related to the live high train low approach. Redox status biomarkers in gastrocnemius at the live high train low approach were investigated in only one study (Li and Zhang, 2011). However, clarifying variations in redox homeostasis biomarkers in the mitochondria-rich slow-twitch soleus muscle would be more valuable. Even though the lipid peroxidation rate was assessed in human blood samples and only one of the experimental animal studies at hypoxic exercises, both the lipid peroxidation and the AOPP formation rate of the soleus muscle are currently investigated at hypoxic exercise in our study. Further, the determination of the hemoglobin (Hb) concentration, red blood cell (RBC) count, oxidative and native protein concentrations in live high train high, live high train low and live low train low groups could supports our understanding of hypoxic exercise effects on performance. Therefore, the assessment of redox status biomarkers in the soleus muscle at hypoxic exercises is required to fill the knowledge gap in the literature and could help us to get a better understanding of the possible mechanism of hypoxic exercises with respect to redox homeostasis. As a result, the purpose of this study is to clarify the effect of different types of altitude training on rats' exercise performance and to evaluate its relation to the redox status biomarkers in the soleus.
Materials and Methods
Chemicals
All reagents used were of analytical grade. Deionized water was used for the preparation of the reagents. The assay reagents were stored at +4°C and equilibrated at ambient temperature for 30 minutes before analysis.
Apparatus
All the centrifugation procedures were performed with a Z 323 K cooled centrifuge (Hermle, Germany). The absorbance values of redox status biomarkers such as T-SH, Np-SH, AOPP, and LHP were determined with the PowerWave XS, (BioTek.) spectrophotometer. The RBC and Hb concentrations were determined by using a hematology autoanalyzer (Cell-Dyn 3700). Normobaric hypoxia was established by an oxygen generator device (8850 SUBMİT 3 in 1; Altitude Tech. Co., Canada). The indoor air of the hypoxic tent was monitored continuously by O2detectors (IBRID MX6; Industrial Scientific Co.). The CO2, temperature and humidity inside the tent were regularly checked by a device (Testo 435; Testo AG, Germany). A CO2 cleaner device (Altitude Tech. Co.) was used to keep the environmental CO2 at an optimum level. The rats were exercised with a motorized treadmill (MAY-TME 9805; Commat, Turkey). The soleus muscle samples were homogenized by using a X250D homogenizator (CAD, Germany).
Experimental animals and procedures
Animal subjects
Adult male Sprague-Dawley rats (8-week-old) were supplied from the Experimental Animal Production and Research Center, of Pamukkale University at Denizli, Turkey. The rats were preselected by their ability to run on a motorized treadmill (MAY-TME 9805; Commat, Turkey) at 0.3 km/h up to 0.5 km/h, 0% grade, 10 minutes/day, for 4–5 days (Lambertucci et al., 2007). The preselected animals were further randomly divided into three experimental groups: live high train low (n = 7), live high train high (n = 6), and live low train low (n = 6) (Fig. 1). The body weights of the rats in all the groups were the same before starting familiarization (Table 1). They were fed with a standard laboratory chow diet (20% protein, 55% carbohydrate, 3% fat). Animals were housed in conventional wire-mesh cages, two rats per cage, in a temperature-regulated room at 21°C–23°C, humidity at 45%–55% and 12-hours light–dark cycles. Rats were allowed to freely access the standard laboratory chow diet and tap water throughout the housing period and during the course of the experiments. All the procedures performed in the studies involving experimental animals were in accordance with the ethical standards of the Pamukkale University Ethics Committee of Animal Care and Usage (PAUHDEK-2009/014).

Experimental design of the study. LLTL, live low train low; LHTH, live high train high; LHTL, live high train low; MAV, maximum aerobic velocity test.
Body Weight and Hematological Parameters of Studied Training Groups
Values are represented as (±SEM).
p < 0.05.
LLTL versus LHTH.
LLTL versus LHTL.
LHTH versus LHTL.
Hb, hemoglobin; LHTH, live high train high; LHTL, live high train low; LLTL, live low train low; RBC, red blood cells; SEM, standard error of mean; TP, total protein concentration.
Experimental procedures
Exercise protocol
All experimental animals in the established training groups of live high train low, live high train high, and live low train low were given a familiarization exercise for 4 weeks, 4 days a week (2 + 2), and 15–30 minutes/day at the laboratory conditions, which exists at an altitude of about 350 m above the sea level (Denizli/Turkey), to ensure all the rats are trained at the same altitude. At the end of the first training period, all the groups of rats were exercised for 30 minutes to be able to run at a speed of 1.5 km/h. To supervise the training intensities for the following 4 weeks with precision, a maximal aerobic velocity test was evaluated for all the training groups, after a resting period of 2 days. The test obtained at both normoxia and hypoxia was estimated by using a treadmill during a continuous and progressive maximal exercise test. At normobaric hypoxia (∼3,000 m, 15% O2, live high train high group), the treadmill was set at a speed of 0.3 km/h at a grade of 0%. Then, the speed was increased by 0.3 km/h every 3 minutes until the maximal intensity was attained for each rat, till the animal could not maintain its running position. The test at normoxia (∼350 m, 20.9% O2, live low train low, live high train low) was evaluated by using the same protocol, but with a starting speed of 0.6 km/h (Goret et al., 2005; Lambertucci et al., 2007). The exercise sessions were conducted for 4 days in the first week 5 days in a week in the following weeks. The running speed was equal to 60% of the test for 20 minutes in the first week, 65% of the test for 25 minutes in the second week, 70% of the test for 30 minutes in the third week, and 70% of the test for 35 minutes in the fourth week. All exercises were performed on successive days (2 + 2 and 2 + 3 days of exercise and a day rest in between) of the familiarization and hypoxic training's period in the morning, at 06:00–09:00 a.m. During the exercise protocol, the second test was evaluated for the training groups after a resting period of 2 days. An outline of the study's design is given in Figure 1.
A normobaric hypoxia condition (15% O2, altitudes of about 3,000 m) was created by using a hypoxic tent and an oxygen generator. The current system was previously established to create a normobaric hypoxia condition (Erken et al., 2013). The indoor air (O2 and CO2) of the hypoxic tent was continuously monitored throughout the experiment, and a CO2 cleaner was also run inside. The ambient CO2 level was constantly monitored and kept under 0.03% during the experimental period. A temperature condition of 21°C–23°C and 50%–55% of humidity were constantly monitored and ensured as well. A normoxic environmental condition was created with room air (20.9% O2) at a ∼350 m altitude above the sea level, at which the research laboratory was located. The live high train high group was exposed to a hypoxia condition for 24 hours, the live high train low group was exposed to a 12 hour hypoxia/normoxia period per day, and the live low train low group was exposed to a normoxia condition for 24 hours for 4 weeks.
After the second test, the rats were put to sleep by normoxia with an intraperitoneal injection of ketamine hydrochloride (Ketasol 10%; Richter-Pharma, Wels, Austria) and xylasine (Alfazyne 2%; Alfasan, Woerden, The Netherlands). After anesthesia, blood samples were drawn from the abdominal aorta of all the rats and anticoagulated with heparin (15 IU/ml). Then, whole blood samples were used within 3 hours for the determination of hematological parameters.
Preparation of tissue samples
The soleus muscles of both legs were immediately extracted from the attachments of the tendons and immersed in ice-cold saline. The excessive connective and fat tissues were trimmed away. Then, muscle tissues were directly frozen in liquid nitrogen and were kept in −80°C until the day of biochemical analysis. The soleus muscle samples were diluted to a 1:20 (w/v) ratio with an ice-cold homogenizing buffer (KH2PO4-K2HPO4, 100 mM, pH 7.4) and homogenized. Homogenate suspension was centrifuged at +4°C 2,800 g for 10 minutes with a Z 323 K cooled centrifuge. The supernatant fraction was assayed for biochemical analysis.
Analytical methods
Assessment of LHPs
LHP oxidized ferrous ions (Fe2+) in acidic pH. Xylenol orange binds ferric ions (Fe3+) and forms a blue-purple chromogen complex. Ferrous oxidation with Xylenol orange, version 2 reagent (FOX2) was pipetted into the tubes containing plasma samples. After a 30 minute incubation time in the dark at room temperature, the final test samples were centrifuged at 3,000 g for 10 minutes and the resulting absorbance values of supernatant fractions were recorded at a 560 nm wavelength (Wolff, 1994).
Assessment of thiol fractions
The concentration of T-SH was analyzed by using Ellman's chromogenic reagent (5,5’-dithiobis (2-nitrobenzoic acid) [DTNB]). Ellman's reagent is stoichiometrically reduced by free thiol groups and forms mixed disulfide and 5-thio-2-nitrobenzoic acid (TNB). The absorbance value of the resulting chromophoric TNB was recorded at the 412 nm wavelength against a reagent blank. The Np-SH samples were assayed in the following way: Aliquots of 20 μl of the supernatants were mixed in 400 μl of 50% trichloroacetic acid. The tubes were shaken intermittently for 10 minutes and centrifuged at 3,000 g for 15 minutes. The final samples were assayed for T-SH groups. The absorbance values were read at 412 nm against a reagent blank with no sample. The molar extinction coefficient for thiol groups is e = 13,100 l mol−1 cm−1 at a wavelength of 412 nm. The P-SH groups were calculated by subtracting the Np-SH from T-SH (Sedlak and Lindsay, 1968).
Assessment of advanced protein oxidation products
Assay samples and chloramine standards (0 to 100 μM) are mixed with citric acid (20 mM) and potassium iodide (1.16 M) reagents, respectively. Spectrophotometric readings were run in duplicate to increase precision and performed within 2 minutes after potassium iodide addition. The absorbance value of the final reaction mixture was recorded at a 340 nm wavelength against a reagent blank. The AOPP concentration was expressed as micromoles per liter of chloramine-T equivalents (Hanasand et al., 2012).
Hematological parameters
The RBC count and Hb concentration were determined by using a hematology autoanalyzer.
Determination of protein concentrations
The total protein concentrations (TP) in muscle samples were assessed according to the colorimetric method of Bradford (Bradford, 1976).
Statistical analysis
Descriptive statistics were given as mean and standard error of mean. The test result of Kolmogorov Smirnov revealed that all data were normally distributed, and the homogeneity of variances was tested by the Levene test. The differences between groups were compared by using the one-way analysis of variance and post hoc least significant difference tests. The correlations between exercise performance and Hb, RBC, TP, and redox state biomarkers (P-SH, T-SH, AOPP, LHPs) were analyzed with Pearson correlation. All data were processed by using SPSS V.22 (IBM, Chicago, IL). When not specified, p < 0.05 was considered significant.
Results
All groups of experimental animals survived during the experimental protocol, and we did not lose any rats before euthanizing them. The food consumption of the training groups throughout the familiarization exercise and hypoxic training sessions were not found to be different (Table 1).
The exercise performance or “running distance” of all the training groups is given in Figure 2. Even though the young experimental rats have a higher metabolic rate, and exercised with similar intensity and duration at different altitudes, only the live high train low group ran the longest distance. The live high train low group exhibited significantly different scores than both the live low train low (p = 0.017) and live high train high groups (p = 0.031) (Fig. 2).
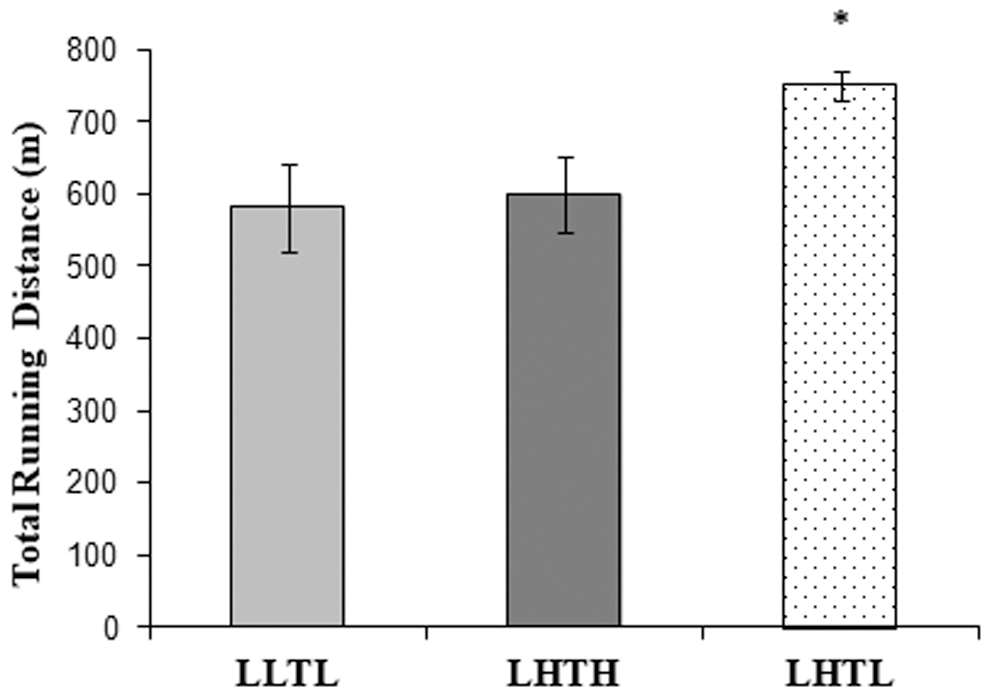
The exercise performance of experimental groups was given as running distance in meters. *p < 0.05.
The hematological parameters of the rats are given in Table 1. The body weight of the experimental rats was similar among the training groups both before and after the experimental periods of familiarization and training (Table 1). The live high train low group had a higher RBC (p = 0.012) and Hb (p = 0.010) than the live low train low group. Similarly, the live high train high group had a higher RBC (p = 0.007) and Hb (p = 0.003) than the live low train low group. However, the RBC and Hb illustrated no significant difference between the live high train high and the live high train low approaches. Protein concentrations were lower in the live high train high group than the live high train low (p = 0.017) and live low train low (p = 0.006) groups (Table 1).
There were no significant differences in T-SH, Np-SH, and P-SH parameters of rats' soleus muscles that were found in all training groups. However, the live high train high group had a higher AOPP and LHPs than the live low train low group (p = 0.028 and p = 0.011 respectively) and live high train low group (p = 0.018 and p = 0.031 respectively) (Table 2). It was also observed that there was a significant positive relationship between exercise performance and studied parameters, except for the AOPP and LHP, which correlated negatively to the exercise performance (Table 3).
Redox Status Biomarkers of the Soleus Muscle in Training Groups
Values are represented as (±SEM).
p < 0.05.
LLTL versus LHTH.
LHTH versus LHTL.
AOPP, advanced oxidation protein products; LHP, lipid hydroperoxide; Np-SH, nonprotein thiol groups; pr., protein; P-SH, protein thiol groups; T-SH, total thiol groups.
Correlation Analysis Results of the Studied Parameters in Training Groups
p < 0.05.
p < 0.0001.
pr., protein; P-SH, protein thiol groups; T-SH, total thiol groups.
A correlation analysis between the P-SH and AOPP is given in Figure 3. A correlation analysis of the studied parameters in the training groups is given in Table 3. Further, a strong negative correlation was observed between the P-SH and AOPP (r = 0.686, p = 0.001) (Fig. 3).
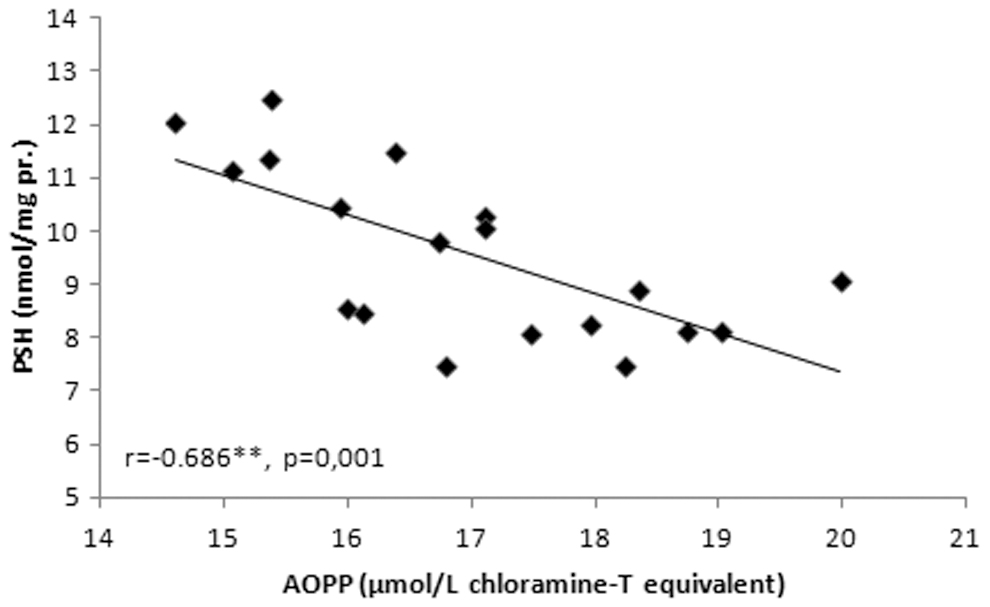
A correlation analysis between P-SH and AOPP in exercise groups. AOPP, advanced oxidation protein products; P-SH, protein thiol groups.
Discussion
After a 4-week normobaric hypoxic training period, the rats in each group were tested in an exhausting exercise at low altitude. The highest protein oxidation and lipid peroxidation rate were found in the live high train high group with the lowest muscular protein concentration. Further, we found a positive correlation among exercise performance, the levels of both the hematological parameters and thiol fractions; however, a negative relationship between exercise performance and the rate of protein oxidation and lipid peroxidation was also seen in the soleus muscle. Moreover, P-SH groups were negatively correlated to the rate of protein oxidation overall. It was observed that the live high train low group exhibited the best exercise performance.
This study revealed that the live high train low approach seems to be better than the live high train high and live low train low approach, which is partially in line with the literature. Similar experimental findings were also reported in human subjects with a higher exercise performance observed in the live high train low group, but not in the live high train high group (Levine and Stray-Gundersen, 1997; Stray-Gundersen et al., 2001). However, experimental animal studies related to this relatively new live high train low approach, which emerged in the early 1990s, included restricted knowledge and yielded confusing outcomes. No significant differences in exercise performance among the live high train high, live high train low, and live low train low groups were reported by Li and Wang (2013). In this study, the experimental rats were exercised for 5 weeks at hypobaric hypoxia (∼3,500 m altitude), and then they were tested with an exhausting exercise at normoxia (1,500 m altitude). On the other hand, after 6 weeks, in the live high train low approach (live at 2,500 m altitude and train at 610 m altitude), the rats demonstrated a better performance than the live low train low group at a low altitude (Miyazaki and Sakai, 2000). Moreover, it was also reported that after 4 weeks of normobaric hypoxic training (∼4,300 m altitude), the live high train high rats reached exhaustion later than the live low train low rats during a normoxic fast running (30 m/min) test (Xu et al., 2012). The results of the aforementioned studies are in concordance with our research findings, in which the rats were exposed to the altitude of 3,000 m, and an exhausting exercise test was applied at a 340 m altitude. However, Li and Wang (2013) applied the exhausting exercise tests at a 1,500 m altitude, which might be a reason for contradictory outcomes to the findings of this study.
The duration of exercise performance depends on the requirement of tissues' oxygen compensation, which is related to the ratio of the maximum oxygen consumption (Kenney et al., 2014). The RBC count and Hb concentration have an important role in the oxygen consumption ratio of skeletal muscle. In this study, the live high train low and live high train high groups had a higher RBC count and Hb concentration than the live low train low group. In the overall analysis, the RBC count and Hb concentration illustrated a high positive correlation to exercise performance, but only the live high train low group had a better exercise performance. Similarly, Levine and Stray-Gundersen (1997) reported that there was an increase in the count of RBC, Hb concentration and the ratio of the maximum oxygen consumption in endurance athletes after the live high train low and live high train high approaches. However, only the live high train low group showed an improvement in a 5,000 m running performance. Brugniaux et al. (2006) informed that after an 18 day live high train low approach, 9.2% of RBC, 10.1% of Hb, and 7.1% maximum oxygen consumption increased in elite middle distance runners.
The determination of muscular protein content would be a crucial factor in relation to exercise performance. In this study, the total protein content of soleus muscle in the hypoxic trained groups was assessed. Skeletal muscle mainly consisted of the myofibrillar proteins (Naito et al., 2000; Chaudhary et al., 2012). A 22% decrease in the content of muscle proteins of rat gastrocnemius and a 30% decrease in myofibrillar proteins at the end of 14 days of chronic hypobaric hypoxia (7,600 m altitude) were demonstrated (Chaudhary et al., 2012). Skeletal muscle atrophy, that is, sarcopenia leads to poor strength and diminished exercise performance (Kenney et al., 2014). On the other hand, the body weight of the young rats in this study was found to be similar for all experimental groups both before and after 4 weeks (total of 8 weeks) of familiarization exercise and high-intensity exercise periods. Besides, Andreollo et al. (2012), who compared the possible relationship between the chronological age of rats and human subjects, in our study depicted that the exercised rats are at their young age period before their training sessions start, and the rats grow up to their early adulthood by the time the training session has completed.
Reaching healthy maturity for young rats during the hypoxic/normoxic exercise periods was proven by the presence of a positive correlation between exercise performance and body weight. The protein concentration of live high train high group was found to be lowest. The live high train high group had a higher RBC count and Hb levels then the live low train low group, similar to the live high train low group, but they ran a shorter distance than the live high train low group. A diminished protein content of the soleus in the live high train high group could be considered as one of the reasons for poor exercise performance.
In experimental animal studies, the hypoxic training models (live high train high; live high train low; live low train low) at about 3,500 and 1,500 m altitudes were applied for 5 weeks by Li and Zhang (2011). Then, the rats were tested with an exhausting exercise at normoxia (1,500 m altitude), and they reported that the higher rate of lipid peroxidation was higher in the quadriceps muscles of the live high train high group, despite the fact that they had higher antioxidant enzyme activities. However, these parameters were reported to be lower in the quadriceps muscles of the live high train low and live low train low groups. Other experimental animal studies also support these outcomes. Augmented levels of lipid peroxidation products were found in the gastrocnemius muscles of rats after 6,000 m altitude training (6 days/week). In this study, they informed that contraction function of the gastrocnemius muscle had worsened in relation to an increased lipid peroxidation rate (Dutta et al., 2008).
As opposed to the soleus, mainly having type I (slow-twitch) fibers, gastrocnemius and quadriceps consist of type II (fast-twitch) and type I fibers (Gollnick et al., 1974; Edgerton et al., 1975). Type I fibers are rich in mitochondria. Impaired mitochondrial functions at hypoxia lead to an excessive ROS formation (Solaini and Harris, 2005). Moreover, ROS diffuses into the muscular tissue, which might interfere with the contraction of the muscles. Yanar et al. (2019) recently reported the effect of impaired redox status on soleus and gastrocnemius in rats. In our study, the highest lipid peroxidation rate was determined in the soleus muscle of the live high train high group. However, the LHPs formation rate was found to be similar in the soleus of both the live low train low and live high train low groups. Besides, the exercise performance of rats in our study negatively correlates to the rate of LHPs formation. From all the hypoxic exercise models mentioned earlier, including the current study, the peroxidation rate of muscular lipids was found to be higher in the live high train high group; however, it was lower in the live high train low approach. As it is known, the lipid peroxidation process affects the structural integrity of cellular membranes, which would lead to mitochondrial malfunctions, that is, poor respiratory function for impaired ATP generation during hypoxic exercise. This might be one of the fundamental reasons for weaker exercise performance in our live high train high group.
Thiol (-SH) groups are found in cysteine side chains of muscular proteins. Thiol groups are very prone to catch unpaired electrons of free radicals (McLeay et al., 2017). P-SH, T-SH, and Np-SH fractions of cellular thiol pool are considered to be an important part of nonenzymatic antioxidant defense systems. The ROS are primarily buffered by cellular thiol fractions (Levine and Stadtman, 2001). Therefore, the determination of the levels of thiol fractions provides very valuable information about hypoxic training effects on muscular proteins. Both exercise and hypoxia may lead to a decrease in the levels of thiol fractions. Besides, an exposure to acute hypobaric hypoxia caused a decrease in T-SH (Magalhães et al., 2005; Agrawal et al., 2017) and P-SH (Agrawal et al., 2017; Ağascioğlu et al., 2019) levels in heart, skeletal muscle tissues. All these experimental results naturally emphasize a further decrease in cellular thiol fractions after hypoxic training. Unchanged mitochondrial T-SH levels were also reported in the myocardial tissue of rats, after the hypoxic exercise at a 6,000 m altitude (for 5 weeks, 5 days/week) (Magalhães et al., 2014). Experimental findings give an idea that there might be tissue-specific selectivity since heart mitochondria should always provide energy to keep working optimally. On the other hand, fatigue in skeletal muscles was observed after a decreased P-SH (Ferreira and Reid, 2008). Moreover, there are other studies implying the importance of cellular thiol groups in exercise performance. Bailey et al. (2011) found high degree positive correlation between the time to exhaustion and T-SH. It means that if the levels of muscle thiol groups were kept high, the time for exhaustion takes longer. It was also reported that endurance athletes' performance was improved after they were administered an N-acetyl cysteine “thiol group donor” at submaximal type of training (Medved et al., 2004).
In this study, no significant differences were observed between the soleus thiol fractions in the live high train high, live high train low, and live low train low groups, which is in line with the study of Magalhães et al. (2014). However, our experimental findings indicate the strong relationship between exercise performance and the rate of soleus thiol fractions. Our current results concur with the findings of Bailey et al. (2011). The current literature and our research outcomes point out the relationship between exercise performance and the rate of thiol fractions. Advanced age might be a possible reason for the depletion of thiol groups due to the higher rate of ROS formation. Ağaşçıoğlu et al. (2019) reported that young rats exhibit a higher rate of ROS-induced oxidative damage than the elderly rats after acute hypobaric hypoxia; however, the elderly rats have an enhanced muscular thiol group depletion rate. Antioxidant enzymes may have a higher activity and thiol groups may recycle rapidly due to higher metabolic rates in young animals.
The ROS-induced oxidative modifications in muscle proteins may cause thiol group depletion, protein carbonyl groups, and AOPP formation during increased muscular activity. The AOPP is considered to be a late-phase oxidative damage biomarker and includes different types of nonenzymatic oxidative products such as dityrosine, pentosidine, and protein carbonyl groups (Capeillère-Blandin et al., 2004). Mitochondria-rich soleus muscle is highly susceptible to oxidative protein damage (Yanar et al., 2019). No available data for muscular AOPP formation during a hypoxic training approach were found in the literature. However, the findings of human-based studies related to AOPP are partially similar to the results of our study. A higher plasma AOPP formation rate was seen in the live high train low group, but it was not reported to exist in the live low train low group (Pialoux et al., 2009, 2010). In our study, the AOPP level was found to be higher in the soleus muscle of the live high train high group, but not in the live low train low or live high train low groups.
The poor exercise performance that was seen in the live high train high group might be explained with an impaired redox homeostasis of soleus. Skeletal muscle tissue may function improperly due to excessive formation of ROS and/or the ineffective removal of oxidation products (Dutta et al., 2008; Yanar et al., 2019). Oxidation products may also interfere with exercise performance (Goldstein and Mcnally, 2010; Reid and Moylan, 2011; León-López et al., 2018). However, a normal cellular redox metabolism depends on an optimum rate of ROS formation. The ROS-related cellular functions, such as signal transduction, vascular tone, and sensing oxygen tension at normoxia (Dröge, 2002), hypoxia (Clanton, 2007), or exercise (Radak et al., 2005), widely attract scientific attention. Experimental animals or volunteers in the live high train low approach may require more oxygen volumes during normoxic training periods. A higher production rate of mitochondrial ATP causes increased ROS formation due to an intensive electron leak. An optimum rate of electron leak may ensure muscular physiological processes. Future studies need to be required to support our current experimental findings and aforementioned issues.
Despite the levels of thiol fractions such as T-SH, Np-SH, and P-SH being found to be similar in the live high train high, live high train low, and live low train low groups, AOPP and P-SH exhibit a high negative correlation in our study (Fig. 3). Our current results emphasize the importance of the analysis of thiol fractions in hypoxic exercise models for assessing muscular redox homeostasis. Two of the aforementioned studies also support our proposal. One of the studies reports that an N-acetyl cysteine “thiol group donor” improves exercise performances in endurance athletes (Medved et al., 2004). A highly significant positive correlation was also reported between exercise exhaustion time and the level of T-SH (Bailey et al., 2011). In the same way, positive correlations were observed between thiol fractions (T-SH, P-SH) and exercise performance, whereas a negative relationship was found between AOPP, LHPs, and exercise performance in this study.
Conclusion
The normoxic/hypoxic exercises were started in all the training groups at their young age and completed in their early adulthood period. Although all the rats were exercised for the same duration and similar intensity at various simulated altitudes, hypoxic trained rats exhibited poor exercise performance. In this training group, the soleus muscle rich in mitochondria may be prone to impair thiol group redox status and muscular function, due to its higher magnitude of oxidative damage and insufficient oxygen to compensate its metabolic requirements. Moreover, living at hypoxia may lead to metabolic adaptation to hypoxia due to enhanced cellular metabolism of soleus in the live high train low group. Excessively formed ROS could be efficiently buffered with various thiol fractions and replenished rapidly in relation to its higher oxygenation rate during exercise sessions at normoxia. To the best of our knowledge, no other paper related to the redox status of thiol fractions and different types of hypoxic exercise models were studied in the same work. Hopefully, upcoming studies could clarify the possible regulatory role of different thiol groups containing biomolecules such as lipoic acid, GSH, cysteine-containing peptides, and thiamine in hypoxic exercise models. In brief, the live high train low approach ensures optimum exercise performance in young rats with efficient redox homeostasis in soleus and this type of exercise could be advised to improve exercise performance at a low altitude.
Authorship Confirmation Statement
As a corresponding author (Rıdvan Çolak, PhD), I bear the full responsibility for the ethical issues of the experimental animals, biochemical assays and statistical analysis, and data interpretation. My coauthor, Eda Ağaşcıoğlu (PhD) bears the responsibility of experimental data interpretation and preparation of the article. Our senior author, Ufuk Çakatay directed us in the biochemical assays and statistical analysis, and also shared the responsibility of data interpretation and article preparation. I have assured myself that all authors have reviewed and approved of the article before the submission to your esteemed journal.
Footnotes
Acknowledgments
The authors would like to thank Prof. Dr. Ahmet Çevik Tufan for his technical advice and support from the Medical School of Yıldırım Beyazıt, Department of Histology and Embryology, Yıldırım Beyazıt University. For editing this article, the authors would also like to thank Rudolf Peter Jelen from Çankaya University's English Preparatory School.
Author Disclosure Statement
No competing financial interests exist.
Funding Information
This study was partially supported by Pamukkale University research grants (2009-BSP-021).