
Abstract

I
The most populous Brazilian cities (>300,000 inhabitants) were determined using Brazilian Institute of Geography and Statistics (IGBE) demographic data. COVID-19 infection and death rates for the 91 identified cities were obtained from Brazil's Ministry of Health coronavirus panel. Altitude (median [M]: 376 m, interquartile range [IQR]: 746), average monthly wind speed (M: 8.63 km/h, IQR: 4.2), and length of daylight (M: 11.64 hours/day, IQR: 0.28) were collected from IGBE, World Weather Online, and the Brazil National Institute of Meteorology. Population density data (M: 1215.69 persons/km2, IQR: 2765.17) from IGBE was included in the study due to faster COVID-19 spread in denser environments (Fig. 1). Data set medians were used as cutoffs and the analysis was conducted through a multivariate logistic regression model in R (Version 4.0.1).
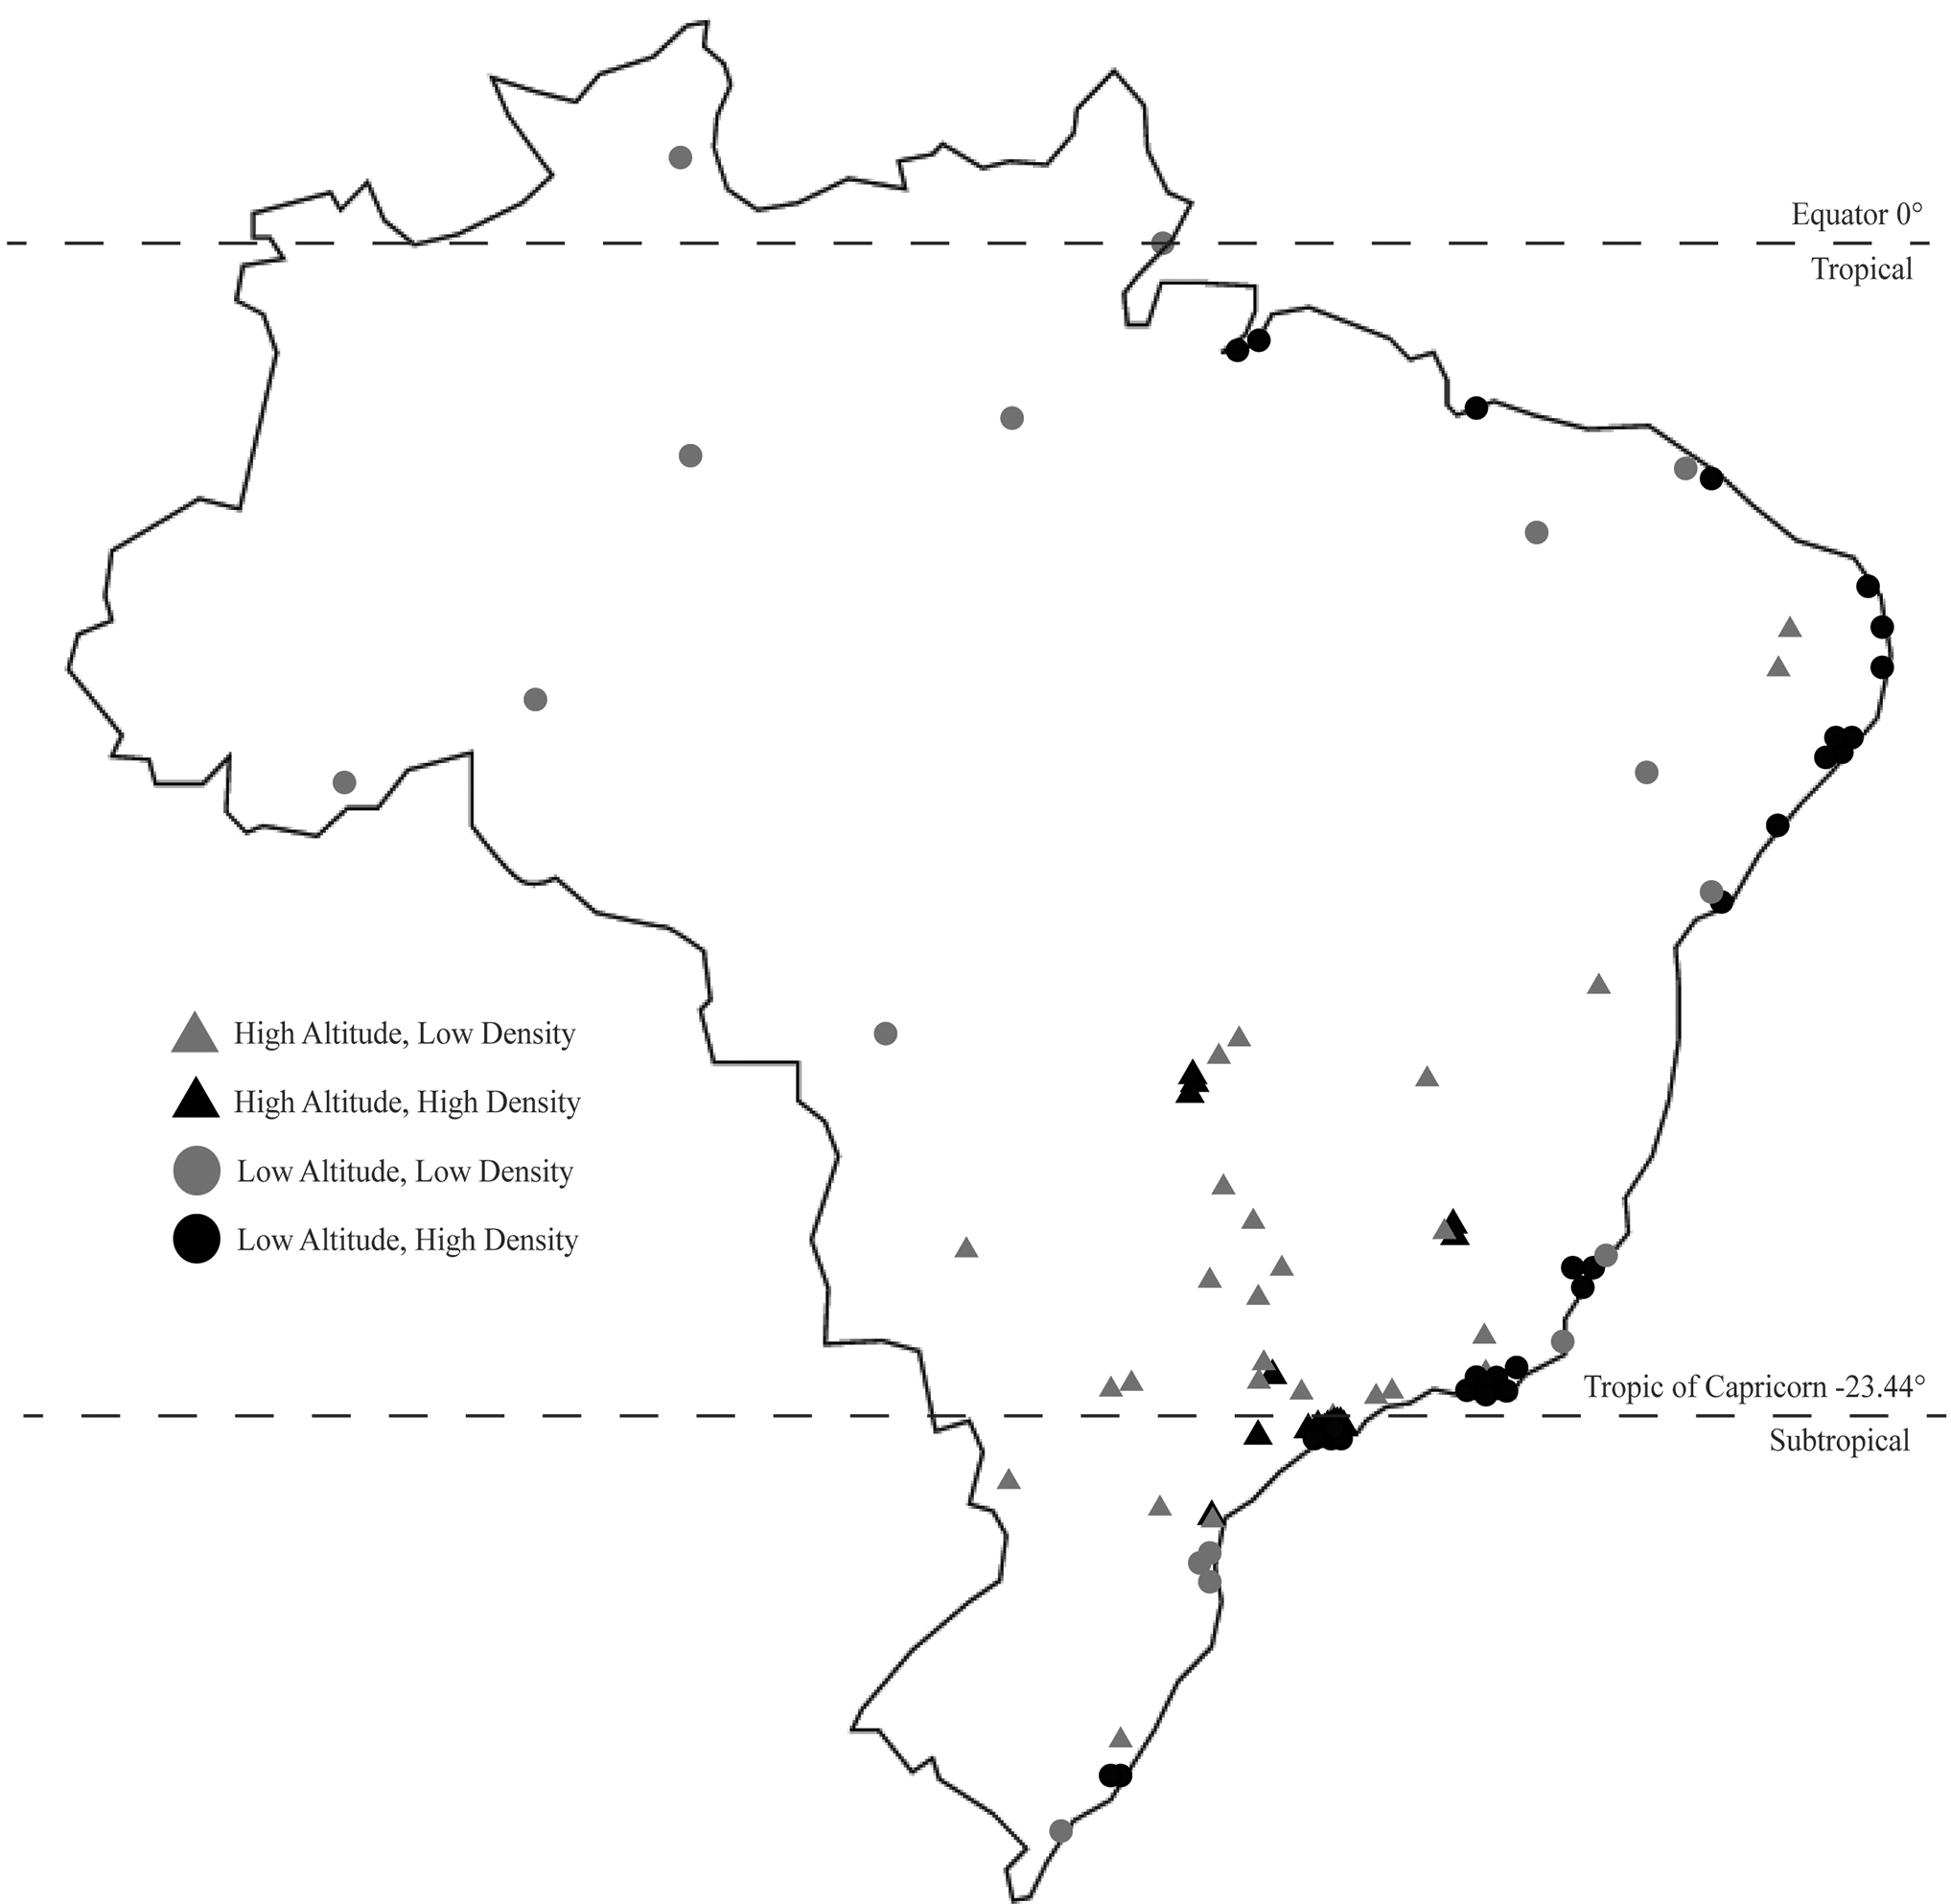
Map of 91 cities included in the study. Cities: Ananindeua, Anápolis, Aparecida de Goiânia, Aracaju, Bauru, Belém, Belford Roxo, Belo Horizonte, Betim, Blumenau, Boa Vista, Brasília, Campina Grande, Campinas, Campo Grande, Campos dos Goytacazes, Canoas, Carapicuíba, Cariacica, Caruaru, Cascavel, Caucaia, Caxias do Sul, Contagem, Cuiabá, Curitiba, Diadema, Duque de Caxias, Feira de Santana, Florianópolis, Fortaleza, Franca, Goiânia, Guarujá, Guarulhos, Itaquaquecetuba, Jaboataão dos Guararapes, João Pessoa, Joinville, Juiz de Fora, Jundiaí, Limeira, Londrina, Macapá, Maceió, Manaus, Maringá, Mauá, Mogi das Cruzes, Montes Claros, Natal, Niterói, Nova Iguaçu, Olinda, Osasco, Paulista, Pelotas, Petrolina, Petrópolis, Piracicaba, Ponta Grossa, Porto Alegre, Porto Velho, Praia Grande, Recife, Ribeirão das Neves, Ribeirão Preto, Rio Branco, Rio de Janeiro, Salvador, Santarém, Santo André, Santos, São Bernardo do Campo, São Gonçalo, São João de Meriti, São José do Rio Preto, São José dos Campos, São José dos Pinhais, São Luís, São Paulo, São Vicente, Serra, Sorocaba, Taubaté, Teresina, Uberaba, Uberlândia, Vila Velha, Vitória, and Vitória da Conquista.
Infections per 1000 inhabitants ranged from 0 to 10.07, whereas deaths per 1000 inhabitants ranged from 0 to 0.88. Altitude and density were the most highly associated factors with infections and deaths, respectively; low altitude (<375 m) had an odds ratio (OR) of 6.16 (95% confidence interval [CI]: 2.28–17.97; p < 0.001) for infections and an OR of 8.17 (95% CI: 2.75–27.96; p < 0.001) for deaths; high density (>1200 persons/km2) had an OR of 4.80 (95% CI: 1.71–14.73; p = 0.004) for infections and an OR of 9.09 (95% CI: 3.18–29.29; p < 0.001) for deaths; high wind speed (>8.5 km/h) had an OR of 2.38 (95% CI: 0.86–6.97; p = 0.10) for infections and an OR of 1.12 (95% CI: 0.37–3.30; p = 0.84) for deaths; and low daylight (<11.63 hours/day) had an OR of 0.43 (95% CI: 0.14–1.24; p = 0.13) for infections and an OR of 1.33 (95% CI: 0.43–4.34; p = 0.63) for deaths.
Previous studies have found that environmental characteristics play a significant role in influenza epidemic seasonality in Brazil, even more so than other nonenvironmental factors such as travel and population density (Alonso et al., 2007). The findings in this study suggest that environmental conditions may have a similar effect on COVID-19 disease burden in Brazil. In particular, what we observed is that high population density and low altitude were strongly associated with COVID-19 deaths. These findings support previous studies that suggested high altitude may be an independent protective factor (Arias-Reyes et al., 2020). Daylight did not seem to significantly affect COVID-19 outcomes, probably due to minimal variation in daylight during the period analyzed. Pun et al. (2020) have highlighted that other environmental features, including seasonal weather patterns and temperature, at different latitudes may be important in viral transmission, which can explain why these results differ from those in Woolcott and Bergman's study on United States and Mexico outcomes. As the COVID-19 pandemic continues to engulf the world, it would be informative to continue studying associations between environmental conditions and COVID-19 disease burden.
Footnotes
Authors' Contributions
Concept, acquisition and analysis of data, statistical analysis, and article creation were by all authors. All coauthors have reviewed and approved of the article before submission.
Author Disclosure Statement
No competing financial interests exist.
Funding Information
No funding was received for this article.