
Abstract
Zengmei, Sun, Suyuan Wang, Hua He, Chenghui Zhang, Mingxia Li, Yan Ye, Huiqin Zhang, Xuanyu Yao, Shuyao Sun, Yuanze Du, Yang Zhong, and Yunhong Wu. Influence of high-altitude residential history on optimal HbA1c cutoff for detecting abnormal glucose metabolism. High Alt Med Biol. 26:45–54, 2025.
Aims:
To explore the influence of recent high-altitude residential history on the optimal cutoff of glycosylated hemoglobin (HbA1c) for detecting abnormal glucose metabolism.
Methods:
The study included 505 self-reported healthy Han participants of age 18–65 years, recruited in Chengdu and categorized based on recent (within 3 months) high-altitude (>2,500 m) residential history. The 1999 WHO criteria was used as the gold standard for defining prediabetes and diabetes. HbA1c test performance was assessed using receiver operating characteristic curve, with the optimal cutoff determined by Maximum Youden index. Propensity score matching with 0.02 calipers and nearest neighbor method was used to balance confounding factors between groups.
Results:
Of the participants, 238 (47.13%) were populations with recent high-altitude residential history (HA group), and 267 (52.87%) were low-altitude dwellers (LA group). The HA group had slightly higher HbA1c levels (p > 0.05) and higher erythrocyte and hemoglobin levels (p < 0.05), compared to the LA group. Weak correlations between prediabetes and HbA1c levels were observed in the HA group (rs = 0.21, p < 0.05) and the LA group (rs = 0.07, p = 0.25). The optimal cutoff for the detection of diabetes was 6.5% (area under the curve [AUC] 0.94) in the HA group and 5.9% (AUC 0.97) in the LA group, which remained unchanged after adjustment for confounders.
Conclusions:
The optimal cutoff of HbA1c for the detection of diabetes in populations with recent history of living at high altitude was higher than that in general populations living at low altitude, and the diagnostic value of HbA1c for prediabetes was also inadequate.
Introduction
Abnormal glucose metabolism (AGM) is a common clinical metabolic disease that includes impaired glucose tolerance (IGT), impaired fasting glucose (IFG), and diabetes. According to a nationally representative cross-sectional study conducted in mainland China (WANG et al., 2021), the estimated prevalence of diabetes and prediabetes was 12.4% and 38.1%, respectively. In addition, the population with prediabetes represents a substantial group at risk of developing diabetes (ECHOUFFO-TCHEUGUI et al., 2023). The increasing prevalence of diabetes, combined with high rates of overweight and obesity, indicated a high health burden associated with diabetes in China (MA, 2018). Therefore, screening and detection of AGM have become an important issue in the prevention, control, and management of diabetes.
Currently, the most prevalent methods for detecting diabetes in China are fasting plasma glucose (FPG) and blood sugar levels 2 hours after ingesting 75 g of anhydrous glucose (2-hour oral glucose tolerance test [OGTT-2h]) (Chinese Diabetes Society; Care N O F P D, 2022). Additionally, glycosylated hemoglobin (HbA1c) has been utilized for blood sugar control in patients with diabetes since 1976 (Saudek et al., 2006). Regular measurement of HbA1c levels can help with diabetes management and improve metabolism (Larsen et al., 1990). A reduction in HbA1c levels has been demonstrated to significantly reduce the risk of diabetes-related complications (Nathan et al., 1993; UK Prospective Diabetes Study (UKPDS) Group, 1998), as well as the risk of myocardial infarction and all-cause death (Holman et al., 2008). HbA1c, as an indicator of long-term blood glucose control over the past 3 months (BAO and GU, 2021), is more reproducible than FPG and simpler than OGTT-2h, which has led to numerous studies focusing on the performance of HbA1c in screening for diabetes and prediabetes. In 2009, the American Diabetes Association, European Association for the Study of Diabetes, and International Diabetes Federation recommended the use of HbA1c for the detection of diabetes and established 6.5% (48 mmol/mol) as the cutoff value (Gillett, 2009). Nevertheless, there is considerable debate surrounding the optimal HbA1c cutoff points. An increasing number of published reports have highlighted the influence of age, race, genetic makeup, erythrocyte lifespan, and the extent of glycation differences on HbA1c levels across individuals (Herman and Cohen, 2012; Herman, 2016). Furthermore, previous studies (Lixin et al., 2012; Xuemei et al., 2013) have demonstrated that the HbA1c levels in high-altitude populations are significantly higher than those in low-altitude dwellers and that the optimal cutoff differs accordingly.
The Tibet Autonomous Region, situated in south-west of the Qinghai–Tibet Plateau, has an average altitude of 4,000 m. The population residing in the Tibetan region may experience an increase in red blood cell count and hemoglobin as a result of exposure to high-altitude environments, which could potentially impact HbA1c measurement accuracy. At the same time, Sichuan Province ranks second in the nation in terms of Tibetan population. The city of Chengdu offers a superior standard of medical care, comfortable living conditions, and greater development opportunities, which have attracted many Tibetans to seek medical treatment and settle down. The Hospital of Chengdu Office of People’s Government of Tibetan Autonomous Region serves as a rear hospital, meeting the medical and rehabilitation needs of cadres and the general population from various ethnic groups in Tibet. Each year, tens of thousands of Tibetans descend from the high altitude to seek medical treatment at the low altitude. Upon arrival, they undergo a period of adaptation, during which indicators such as red blood cells and hemoglobin levels may undergo a series of changes. It remains unclear whether the criteria for HbA1c in the general population at low altitude can be applied to detect AGM in population with recent high-altitude (>2,500 m) residential history. This is a matter that requires further attention and resolution. Meanwhile, the patient pool at the Hospital of the Tibet Autonomous Region People’s Government Office in Chengdu provides an ideal condition for this study.
A cross-sectional survey was therefore conducted to explore the influence of recent high-altitude (>2,500 m) residential history on the optimal cutoff values of HbA1c and to assess its applicability in detecting glucose metabolism abnormalities in populations with recent high-altitude residential history. In order to ensure the robustness of the outcomes, we employed the propensity scores method (PSM) (Zhao et al., 2021) to balance potential confounding factors (such as gender, age, family history, etc.) (Nitin, 2010; Sarnowski and Hivert, 2018).
Materials and Methods
Subjects
A convenience sampling was conducted between 2017 and 2018. A total of 505 self-reported healthy Han participants, aged 18–65, were recruited from the Hospital Chengdu office of People’s Government of Tibet Autonomous Region. The participants were divided into two groups based on their recent (within 3 months) history of high-altitude (>2,500 m) residential experience (HA group). One group consisted of individuals with recent history of residing at high altitude, while the other group included those who lived at low altitude (approximately 500 m) (LA group). The subjects included in the study met the following criteria: (1) age between 18 and 65 years and (2) no self-reported diabetes, thyroid disease, blood system disease, autoimmune diseases, serious heart, liver, and kidney diseases, tumors, infections, surgery, or other stressful conditions. Subjects with following diseases or conditions were excluded: (1) populations with recent history of high-altitude exposure for less than 6 months or a prolonged stay at low altitudes for more than 3 months; (2) low-altitude dwellers with recent history of high-altitude exposure within the past 3 months; (3) alanine aminotransferase (ALT) >100 u/l; (4) anemia: men with hemoglobin levels <120 g/l, women with hemoglobin levels <110 g/l; (5) pregnant and menstruating women; and (6) ethnicity mismatch between parents, that is, Tibetan–Han intermarriage. This study was approved by the ethics committee of the Hospital of Chengdu Office of the People’s Government of the Tibetan Autonomous Region (Reference ID for ethics approval: 2017-36). Included participants voluntarily signed a written consent and permission to conduct the study.
Data measurement
A questionnaire survey, physical examination, and laboratory examination were conducted by trained workers at the hospital of the People’s Government of Tibet Autonomous Region in Chengdu. Face-to-face surveys utilized self-designed questionnaires derived from existing literature and preliminary studies, focusing on sociodemographic factors (sex, age, family history, etc.), smoking and drinking habits, and family medical history including cardiovascular issues, hypertension, and diabetes. Blood glucose levels were measured using the glucose oxidase method for both FPG and OGTT-2h. A total of 2 ml of fasting venous blood was collected from patients using EDTA anticoagulation tubes, and HbA1c was measured by high-performance liquid chromatography affinity chromatography (HB9210 and Ultra2 from Primus, USA). Reagents, quality control products, and calibrators were provided by Primus. To ensure the accuracy of the test results, quality control was performed before each test and the results were within the quality control range. Triglycerides, total cholesterol, high-density lipoprotein cholesterol, and low-density lipoprotein cholesterol were quantified using the enzyme chemical method.
Sample size calculation
The mean HbA1c levels for the HA and LA groups were 6.2% (44 mmol/mol) and 5.9% (41 mmol/mol), respectively, with standard deviations (SDs) of 0.7% (8 mmol/mol) and 0.7% (8 mmol/mol), based on the literature and preliminary experiments (Sun et al., 2019). The sample size was calculated using the two-sample t-test (α = 0.05, β = 0.09). Based on the assumption of a 10% dropout rate, at least 128 cases per group were required, resulting in a total of at least 256 cases.
Classification of glucose tolerance status
The WHO guidance in 1999, was utilized to classify the glucose tolerance status of participants (Alberti and Zimmet, 1998): (1) normal glucose tolerance (FPG <6.1 mmol/l and OGTT-2h <7.8 mmol/l); (2) prediabetes included IFG (6.1 mmol/l ≤FPG <7.0 mmol/l and OGTT-2h <7.8 mmol/l) and IGT (FPG <7.0 mmol/l and 7.8 mmol/l <OGTT-2h <11.1 mmol/l); and (3) diabetes (FPG ≥7.0 mmol/l and/or OGTT-2h ≥11.1 mmol/l).
Statistical analysis
Continuous variables were described using mean ± SD or median (lower quartile, upper quartile), and comparisons were made using the t-test, Mann–Whitney test, or Kruskal–Wallis test. Categorical variables were presented as counts (and percentages) and compared using the chi-square test or Fisher’s exact test. Spearman analysis was used to explore the correlation between AGM and HbA1c.
The optimal HbA1c cutoff was estimated using receiver operating characteristic curve analysis with the Youden criterion (AKOBENG, 2007, López-Ratón et al., 2014). Subsequently, the performance of HbA1c in detecting AGM was evaluated by computing the following indicators: sensitivity, specificity, positive predictive value, negative predictive value, positive test likelihood ratio (LR+), and negative test LR (LR−). Furthermore, the performance of HbA1c was evaluated according to the International Expert Committee (Gillett, 2009) definition of AGM. Prediabetes was defined as 6.0% (42 mmol/mol) ≤ HbA1c < 6.5% (48 mmol/mol), while diabetes was defined as HbA1c ≥ 6.5% (48 mmol/mol).
To ascertain the optimal cutoff for HbA1c between groups, while controlling for potential confounding factors, 1:1 PSM, with a caliper of 0.02 and the nearest method, was employed to balance the populations’ characteristics (age, sex, smoking, drinking, and family history). A significance level of p < 0.05 was used to identify statistically significant results. The data were analyzed using the R statistical software (version 4.1.3).
Results
General characteristics of the participants
The sample included 505 participants, with 238 (47.13%) being populations with recent high-altitude residential history (HA group) and 267 (52.87%) being low-altitude dwellers (LA group). The median age of the HA group and the LA group was 44 (34.25, 50.00) years and 47 (31.00, 54.00) years, respectively (p = 0.011). The proportion of males in the HA group was 63.87%, compared to 50.56% in the LA group (p = 0.003). The proportion of individuals who smoke and drink alcohol was 32.77% and 43.70%, respectively, in the HA group, which was higher than that in the LA group (23.22% and 33.33%). The proportion of individuals with a family history of hypertension in the HA group was 37.82% and that in the LA group was 28.09% (p = 0.020). The median BMI was 23.42 (20.80, 25.53) kg/m2 in the HA group and 24.43 (21.44, 27.62) kg/m2 in the LA group (p = 0.003). The general characteristics and differences between the two groups are listed in Table 1. The distribution of glucose tolerance status in the HA group was as follows: 9.66% for newly detected diabetes, 14.29% for prediabetes, and 76.05% for normal tolerance. In the LA group, the distribution of glucose tolerance status was as follows: 11.61% for newly detected diabetes, 21.72% for prediabetes, and 66.67% for normal tolerance.
General Characteristics of the Participants
Data are expressed as median (lower quartile, upper quartile), n (%). Mann–Whitney test was used for comparison between groups. HA: populations with recent high-altitude residential history; LA: low-altitude dwellers.
The systolic blood pressure and diastolic blood pressure in the HA group were observed to be lower than those in the LA group (p < 0.05), and this pattern remained consistent across different glucose tolerance statuses. Conversely, the red blood cell count and hemoglobin levels in the HA group were observed to be higher than in the LA group (p < 0.05). Furthermore, the FPG and OGTT-2h levels were found to be lower in the HA group compared to the LA group overall (p < 0.05). However, the values were slightly higher in the subgroup with AGM in the HA group (Fig. 1). The HbA1c levels in the HA group were found to be slightly higher than those in the LA group, yet this disparity between the groups did not achieve statistical significance (Fig. 2).
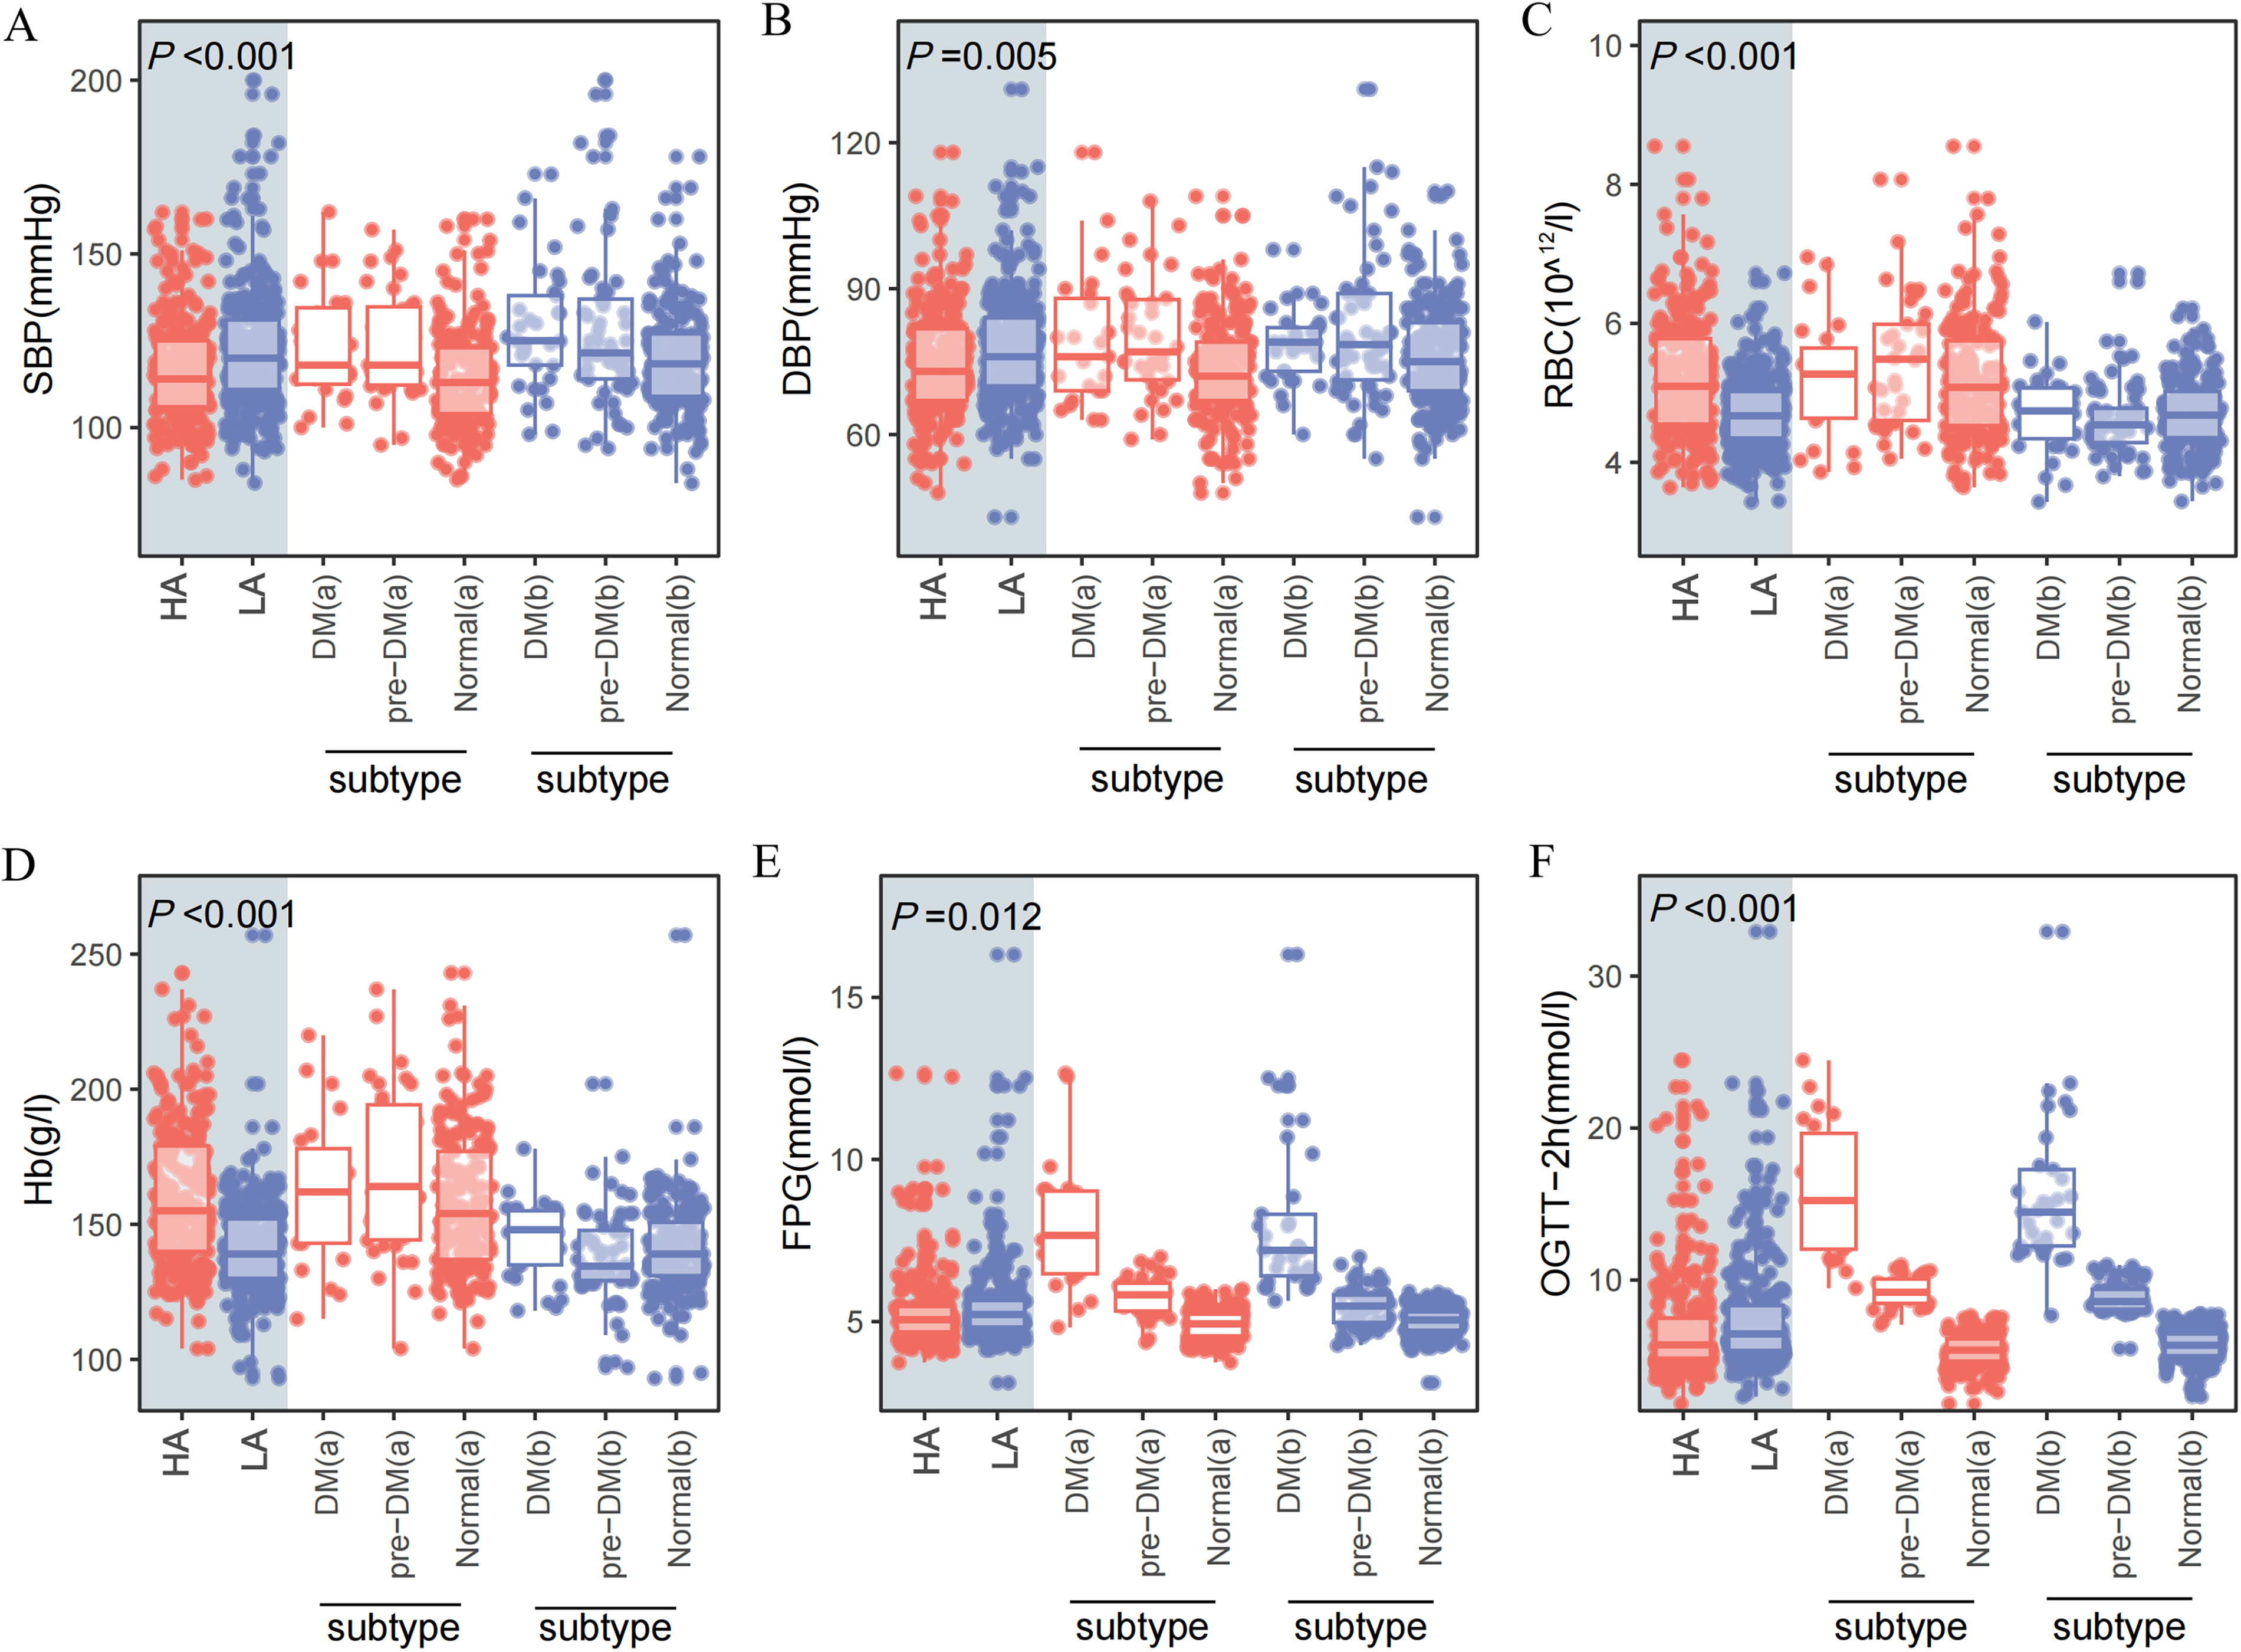
Baseline indices of participants compared between and within groups (different glucose tolerance status). HA, populations with recent high-altitude residential history; LA, low-altitude dwellers. Mann–Whitney test was used for comparison between groups.

HbA1c of participants compared between and within groups (different glucose tolerance status). HA, populations with recent high-altitude residential history; LA, low-altitude dwellers. Mann–Whitney test was used for comparison between groups. HbA1c, glycosylated hemoglobin.
For the changes in red blood cell and hemoglobin levels in the HA group across different altitudes of residence and various durations of stay at low altitude, please refer to Supplementary Table SA1 and Supplementary Table SA2. The results indicated that red blood cell and hemoglobin levels increased with elevation (p < 0.001). With a prolonged duration of residence at low altitude, both red blood cell and hemoglobin levels exhibited a gradual decline (p < 0.001). There was no statistically significant difference between the HA group and the LA group at 60 ∼< 90 days. The levels of FPG and HbA1c at different low-altitude stay times in the HA group were presented in Supplementary Table SA3. Within a span of 3 months, there were no significant changes observed in FPG and HbA1c levels with increasing duration of stay at low altitude.
Correlations between abnormal glucose metabolism and basic indices
For the HA group, the Spearman correlation coefficients between diabetes and OGTT-2h, FPG, and HbA1c were 0.51 (p < 0.05), 0.46 (p < 0.05), and 0.45 (p < 0.05), respectively. The Spearman correlation coefficients between prediabetes and OGTT-2h, FPG, and HbA1c were 0.47 (p < 0.05), 0.34 (p < 0.05), and 0.21 (p < 0.05), respectively. For the LA group, the Spearman correlation coefficients between diabetes and OGTT-2h, FPG, and HbA1c were 0.55 (p < 0.05), 0.55 (p < 0.05), and 0.53 (p < 0.05), respectively. The Spearman correlation coefficients between prediabetes and OGTT-2h, FPG, and HbA1c were 0.50 (p < 0.05), 0.16 (p < 0.05), and 0.07 (p = 0.25), respectively (Fig. 3).
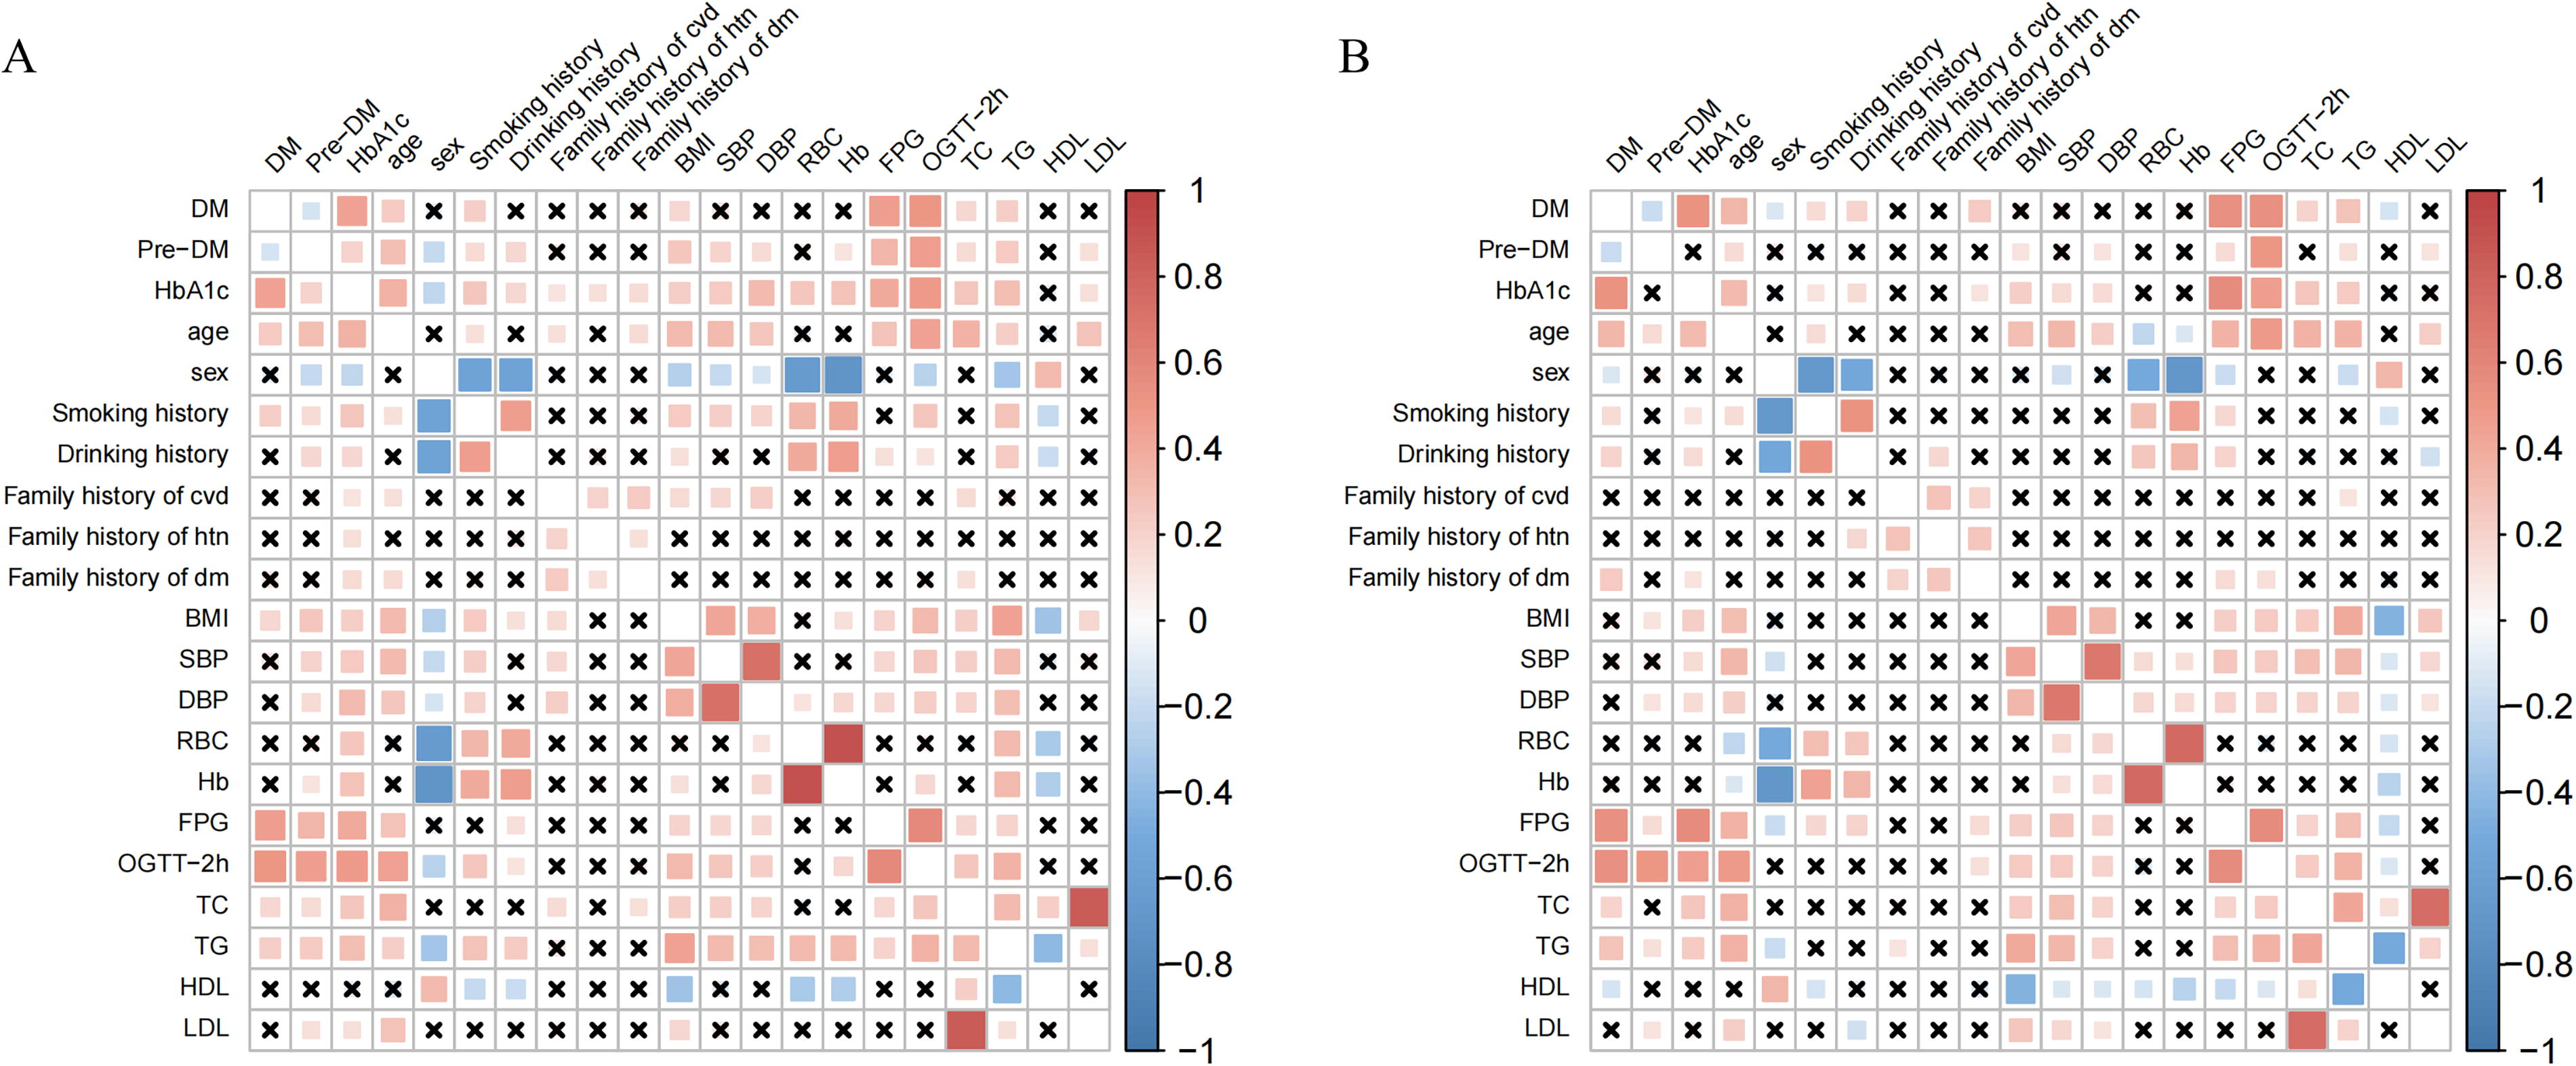
Correlations between diabetes, prediabetes, and basic indices.
Prevalence of abnormal glucose metabolism under different standards
In general, the inclusion of HbA1c as a criterion for AGM resulted in an increase in prevalence in both the HA and LA groups. The rate of change was higher in the HA group than in the LA group. For the HA group, the prevalence rate of diabetes increased from 9.66% to 14.29%, representing a change rate of 47.83%. Moreover, the prevalence rate of prediabetes in this group rose from 14.29% to 21.42%, indicating a change rate of 50.00%. In contrast, the prevalence rate of diabetes in the LA group increased from 11.61% to 13.11%, reflecting a change rate of 12.90%. Furthermore, the prevalence rate of prediabetes within this group increased from 21.56% to 28.10%, with a change rate of 29.31% (Table 2). The distribution of the gold standard and HbA1c cutoff values for detecting diabetes and prediabetes in the HA group and the LA group was illustrated in Figure 4.

Different standards for the detection of diabetes and prediabetes. HA, populations with recent high-altitude residential history; LA, low-altitude dwellers.
Prevalence of AGM under Different Standards
Standard 1: FPG or OGTT-2h; Standard 2: FPG or OGTT-2h or HbA1c (Diabetes: HbA1c ≥ 6.5%; Prediabetes: 6.0% ≤ HbA1c < 6.5%). FPG, fasting plasma glucose; OTGG-2h, 2-hour oral glucose tolerance test; HA: populations with recent high-altitude residential history; LA: low-altitude dwellers.
Optimal HbA1c cutoff and detection performance
The optimal HbA1c cutoff for detecting diabetes was 6.5% (48 mmol/mol) in the HA group and 5.9% (41 mmol/mol) in the LA group, as determined by the maximum Youden’s index (Fig. 5). The optimal HbA1c cutoff for detecting prediabetes was 5.8% (40 mmol/mol) in the HA group, which was lower than that in the LA group (5.9%, 41 mmol/mol).
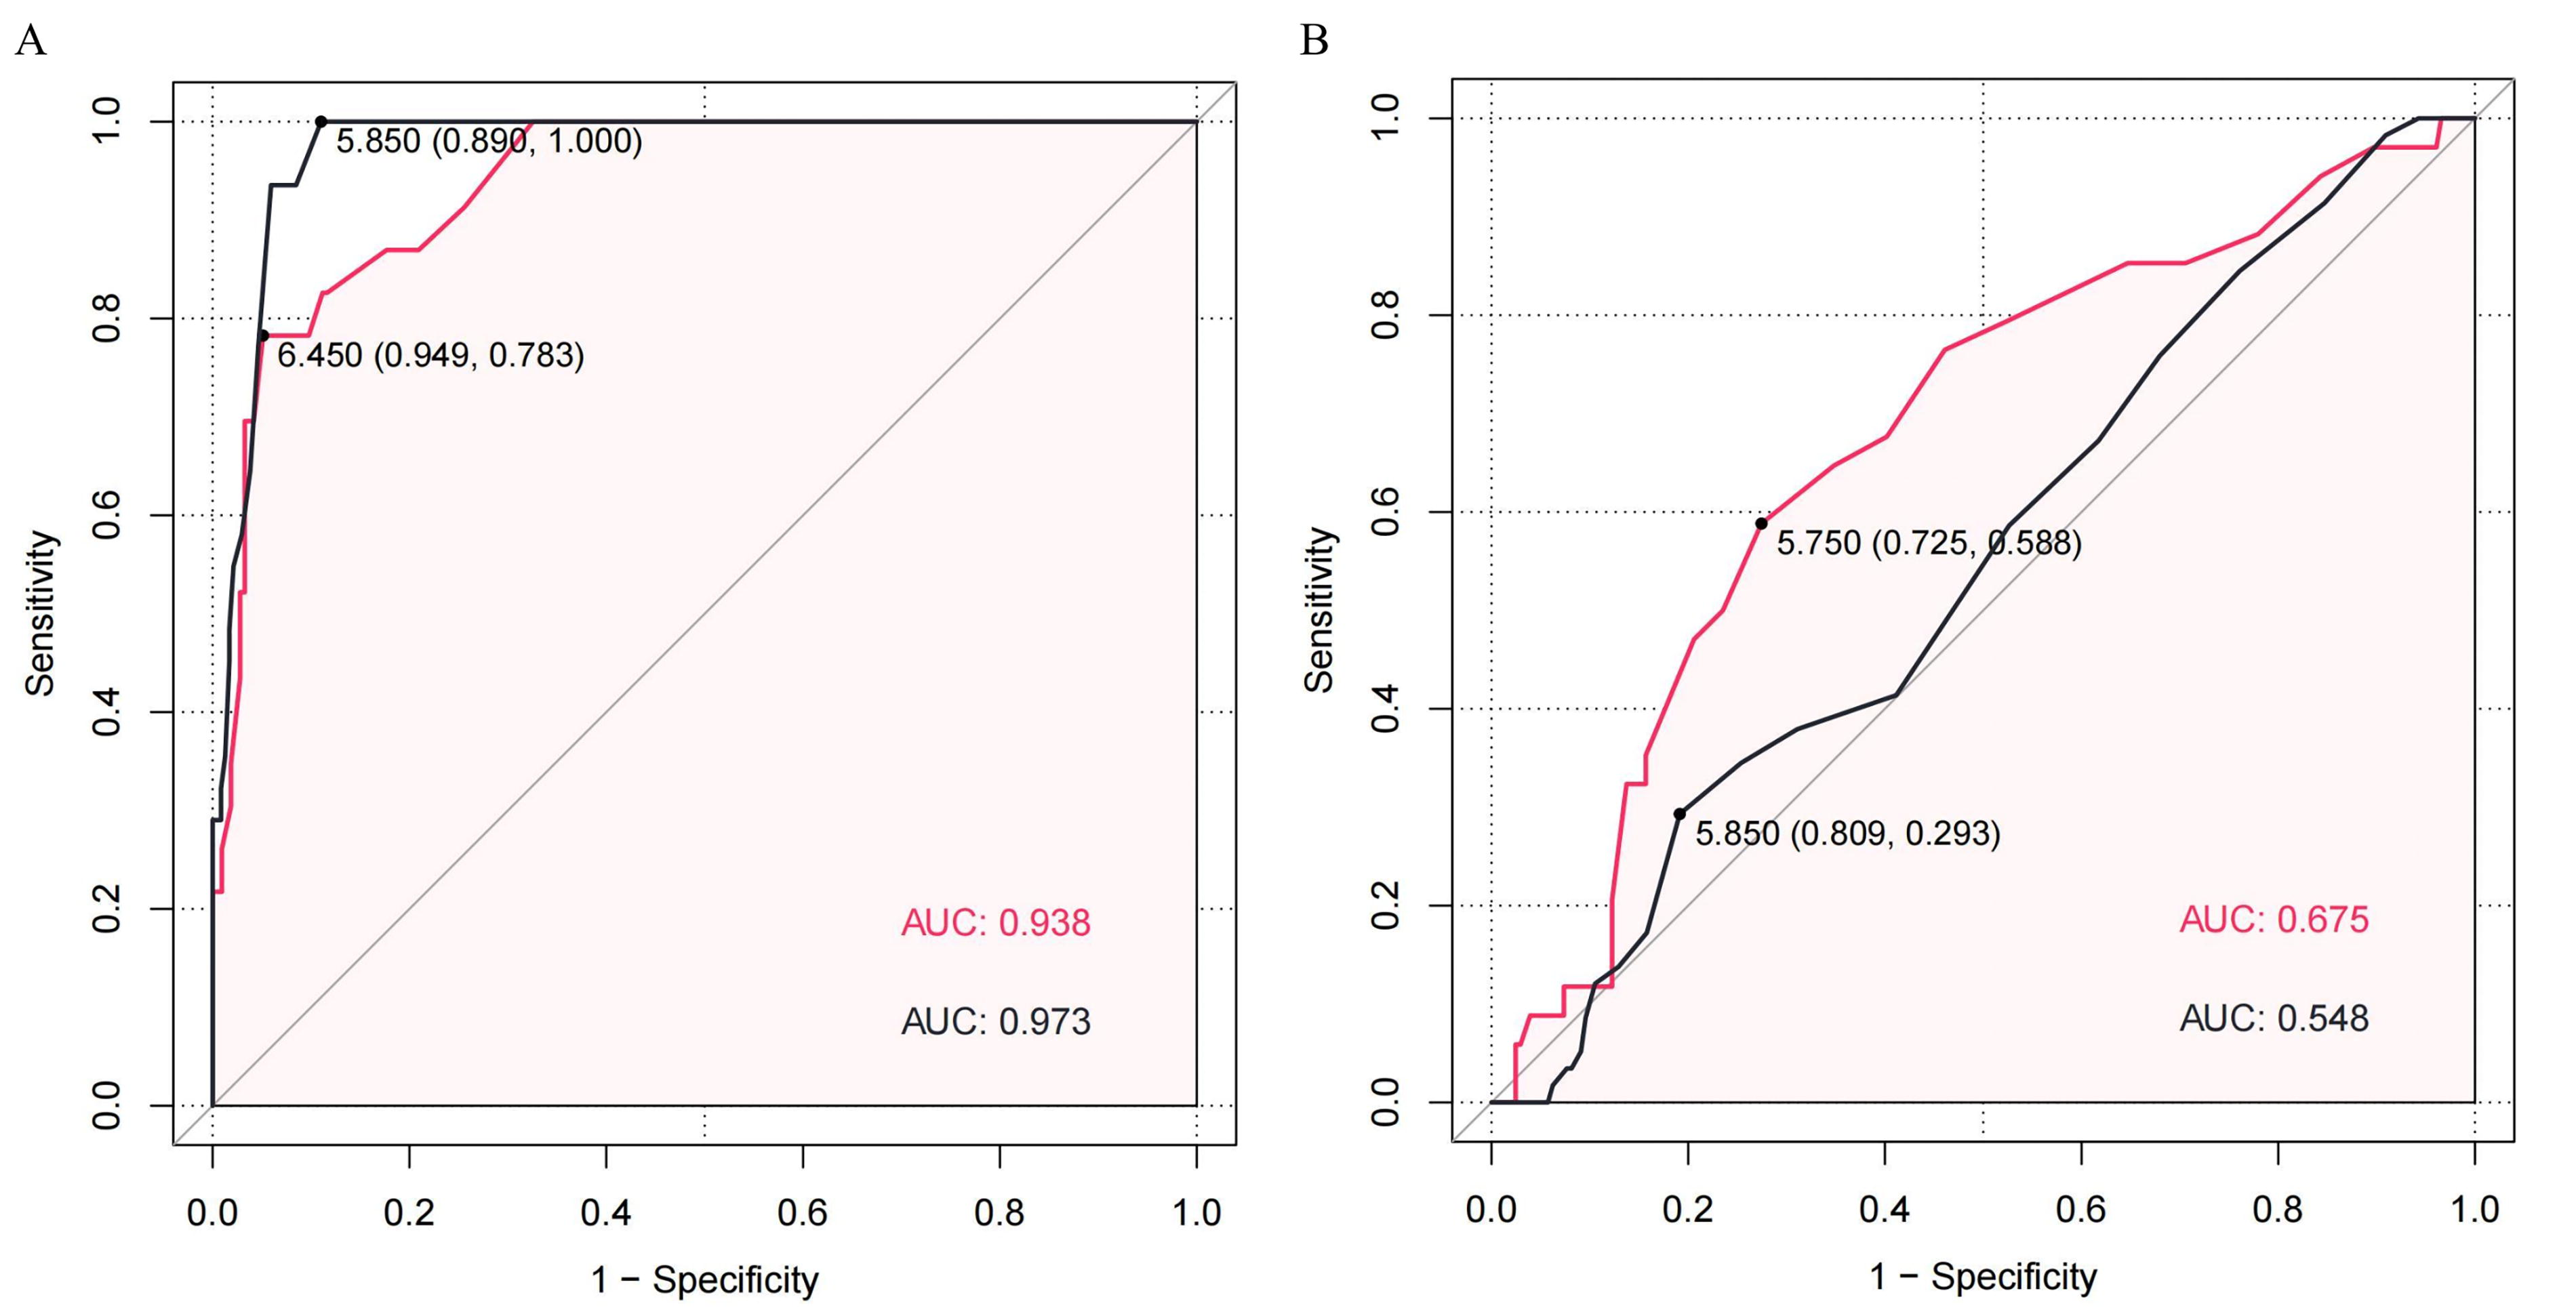
ROC curve of HbA1c for the detection of diabetes and prediabetes. The point value was expressed as optimal cutoff (specificity, sensitivity).
With regard to the detection performance (Table 3), the HA group exhibited lower area under the curve (AUC) values than the LA group for the optimal HbA1c threshold for detecting diabetes (0.94 vs. 0.97), yet it exhibited higher specificity (0.95 vs. 0.89). The AUC values for HbA1c in the detection of prediabetes were relatively low, particularly in the LA group, with an AUC of 0.55 and a sensitivity of 0.29.
Optimal Cutoff of HbA1c and the Test Performance
HA: populations with recent high-altitude residential history; LA: low-altitude dwellers; Se: sensitivity; Sp: specificity; LR+: positive likelihood ratio; LR-: negative likelihood ratio; PPV: positive predictive value; NPV: negative predictive value; AUC: area under the curve
Sensitivity analysis
After propensity score was employed to balance potential confounders (age, sex, smoking and drinking history, family history of cardiovascular and cerebrovascular disease, family history of hypertension, family history of diabetes, and BMI), 156 participants were retained in each group. The two groups exhibited comparable distributions of PS and characteristics (SMD <0.11, Supplementary Table SA4, Supplementary Fig. SA1).
After accounting for potential confounding factors, the optimal HbA1c cutoff for detecting diabetes remained consistent in both groups, at 6.5% (48 mmol/mol) and 5.9% (41 mmol/mol), respectively. This result was consistent with the prematching values. In parallel, the optimal cutoff for detecting prediabetes was observed to decrease from 5.8% (40 mmol/mol) to 5.6% (38 mmol/mol) in the HA group and from 5.9% (41 mmol/mol) to 4.8% (29 mmol/mol) in the LA group (Supplementary Table SA5, Supplementary Fig. SA2). The AUC values and changes in optimal cutoff values indicated that the use of HbA1c to detect prediabetes is deficient and susceptible to confounding factors.
Discussion
Our findings revealed a disparity in the optimal threshold levels of HbA1c between populations with recent high-altitude residential history and low-altitude dwellers. For populations with recent high-altitude residency, despite a gradual decrease in red blood cell and hemoglobin levels over 3 months, HbA1c levels exhibited a pseudo-elevation. The HbA1c detection criteria commonly used for the general population were not suitable for this special population. Furthermore, regardless of whether the population had a history of high-altitude residency or not, HbA1c was not a suitable method for the detection of prediabetes in them.
The study had several notable strengths. First, it encompassed participants who had recently transitioned from high to low elevations. Given the typical challenges in collecting comprehensive data for this population by other institutions and the limited research focus on this specific group, our study stood out for its novelty and importance. Furthermore, 89% of individuals with a history of residing at high altitude in this study resided at altitudes between 2,500 and 4,000 m above sea level, which aligns with the distribution of highland populations observed in previous epidemiological surveys (Wu and Kayser, 2006). Additionally, their residences spanned seven administrative regions in Tibet, indicating regional representativeness. Third, the study accounted for potential confounding factors, such as age and gender, thus demonstrating the sensitivity of the optimal cutoff value to these variables.
The high altitude presents a distinctive environment with lower pressure and oxygen levels. In comparison to populations residing at low altitude, individuals living at high altitude frequently exhibit compensatory increases in red blood cell count and hemoglobin levels (Basu et al., 2007; Zhou et al., 2017). Previous research (REN et al., 2020) has demonstrated that RBC count independently contributes to elevated HbA1c levels (β = 0.140, p < 0.001). While the mechanism remained unclear, this underscores the need for caution when interpreting HbA1c results in populations with elevated indicators such as RBC and HbA1c levels. For populations with recent high-altitude residential history transitioning from high-altitude to low-altitude regions, temporal fluctuations in indicators such as red blood cell and hemoglobin levels, as shown in the data presented in Supplementary Table SA2, may theoretically influence HbA1c levels. However, our study data revealed that within a relatively short period (approximately 3 months) of transitioning from high altitude to low altitude, both in individuals with or without AGM, HbA1c, and fasting blood glucose levels remained relatively stable across different duration stages of stay (Supplementary Table SA3). These findings indicated that during the initial 3 months of transitioning from high altitude to low altitude, despite changes in red blood cell and hemoglobin levels, HbA1c remained relatively stable. Additionally, the study found that fasting blood glucose levels were lower in populations with recent high-altitude residential history compared to low-altitude dwellers. This phenomenon may be attributed to the low-oxygen environment at high altitude, which impairs aerobic glucose metabolism and stimulates anaerobic metabolism, resulting in elevated glycolysis and a decline in fasting blood glucose. Epidemiological studies (WEE and CLIMSTEIN, 2015; Flaherty et al., 2016) have also documented a reduced prevalence of type 2 diabetes mellitus at high altitude (1,500 m–3,500 m) in comparison to low altitudes (<500 m).
Although HbA1c offered convenience and stability in detection, and was closely linked to increased diabetes-related complications, it was vulnerable to factors like red blood cells in high-altitude environments. This research found that HbA1c performs poorly in detecting prediabetes, with sensitivity analysis reflecting its susceptibility to confounding factors, similar to prior studies (Ren et al., 2020; Huang et al., 2023). In the context of diabetes detection, our findings indicated that the optimal threshold for HbA1c in populations with recent high-altitude residential history was 6.5% (with a sensitivity of 78% and specificity of 95%), which was higher than the threshold observed in low-altitude dwellers (5.9%). This result was consistent with those reported in previous studies (Wu et al., 2013; Ren et al., 2020) conducted in high-altitude populations. Studies conducted in Tibet (REN et al., 2020) and Xinjiang (Wu et al., 2013) had identified an optimal cutoff for detecting diabetes with HbA1c of 6.4% (46 mmol/mol). In studies (Rohlfing et al., 2000; Buell et al., 2007; Bao et al., 2010; Lim et al., 2018; Zhou et al., 2018) conducted in low-altitude areas, the optimal cutoff for HbA1c in detecting diabetes ranged from 5.6% (38 mmol/mol) to 6.3% (45 mmol/mol). In summary, the cutoff values for detecting diabetes with HbA1c in both populations with recent high-altitude residential history and low-altitude dwellers in our study were within the range of those reported in previous research. The discrepancies observed in the aforementioned studies could be attributed to a number of factors, including gender, age groups, ethnicity, and the source of participants (population-based or hospital-based). Consequently, the primary challenge in utilizing HbA1c for blood glucose monitoring in individuals with a history of residing at high altitude was the pseudo-elevation phenomenon, which may persist for approximately 3 months following a descent to low altitudes. In light of previous research (KONG et al., 2023) and clinical experience, we propose the use of continuous glucose monitoring as a means of accurately reflecting blood glucose fluctuations in this population, a topic that forms the focus of our other research endeavor.
There were some limitations in our study. Primarily, as a cross-sectional study, data were not collected at multiple time points during individuals’ stay at low altitude, limiting our ability to capture dynamic changes in indicators such as red blood cells, hemoglobin, and HbA1c. However, this warrants further investigation. Additionally, voluntary participation and convenient sampling from hospital attendees might have introduced potential selection bias (Lu et al., 2022). Finally, the sample size of this study was relatively small and the findings could be further validated through larger-scale population surveys or prospective clinical studies in the future.
Conclusions
In summary, the study revealed that recent high-altitude residency among populations transitioning from high altitude to low altitude influenced the optimal cutoff value for detecting diabetes using HbA1c. Specifically, the optimal cutoff value for detecting diabetes using HbA1c in populations with recent high-altitude residential history (6.5%) exceeded that for plain-dwellers without recent high-altitude residential history (5.9%). The standard criteria for HbA1c in the general population at low altitude may not be applicable to populations with recent high-altitude residency. To validate these thresholds accurately, further large-scale prospective studies are required in the future. The diagnostic value of HbA1c for prediabetes was also inadequate.
Footnotes
Authors’ Contributions
Z.M.S. consulted the literature, analyzed the data, wrote the programs, and was a major contributor in writing the article. S.Y.W. wrote part of the article. M.X.L., Y.Y., H.Q.Z., Y.X.Y., and S.Y.S. collected the data. H.H., C.H.Z., and Y.Z.D. made comments on the content of the article. Y.H.W. and Y.Z. contributed significantly to analysis and article preparation.
Data Availability
The datasets generated and analyzed during the current study are available from the corresponding author on reasonable request.
Author Disclosure Statement
The authors declare that there is no conflict of interest regarding the publication of this article.
Funding Information
This work was supported by
References
Supplementary Material
Please find the following supplemental material available below.
For Open Access articles published under a Creative Commons License, all supplemental material carries the same license as the article it is associated with.
For non-Open Access articles published, all supplemental material carries a non-exclusive license, and permission requests for re-use of supplemental material or any part of supplemental material shall be sent directly to the copyright owner as specified in the copyright notice associated with the article.