




Abstract
Reid, Ly-Anh, Jordan L. Rees, Miranda Kimber, Marina James, Graeme M. Purdy, Megan Smorschok, Lauren E. Maier, Normand G. Boulé, Trevor A. Day, Margie H. Davenport, and Craig D. Steinback. Blood glucose during high altitude trekking in young healthy adults. High Alt Med Biol. 26:30–36, 2025.
Introduction:
High altitude trekking is becoming more popular and accessible to an increased number of people. Simultaneously, there is a worldwide rise in the prevalence of metabolic diseases. The purpose of this study was to examine the impact of a gradual trekking ascent to high altitude on continuous glucose monitoring outcomes including fasting, mean 24-hour, postprandial, and post-75 g modified oral glucose tolerance test. This study also investigated the relationship between physical activity intensity, high altitude, and glucose concentrations.
Methods:
Individuals (n = 9) from Alberta, Canada participated in a 2-week trek in the Khumbu Valley in Nepal, ascending by foot from 2,860 m to 5,300 m (∼65 km) over 10 days. A standardized 75 g oral glucose load was given to participants at four different altitudes (1,130 m, 3,440 m, 3,820 m, 5,160 m). Physical activity (Actigraph accelerometry) and interstitial glucose (iPro2, Medtronic) were measured continuously during the trek.
Results:
Fasting and mean 24-hour glucose concentrations were not different between altitudes. However, 2-hour post dinner glucose and 2-hour post lunch glucose, AUC concentrations were different between altitudes. The relationship between physical activity intensity and glucose was not influenced by increasing altitudes.
Conclusion:
Our findings suggest that glucose regulation is largely preserved at high altitude; however, inconsistency in our postprandial glucose concentrations at altitude warrants further investigation.
Introduction
Lowlander exposure to high altitudes has increased in recent years, with more than 100 million people traveling to high altitude destinations yearly (Cornwell et al., 2021). It is well established that excursions to high altitudes (>2,500 m) are associated with a myriad of physiological responses, including a marked increase in muscle sympathetic nerve activity and resting ventilation (Berthelsen et al., 2020; Hansen and Sander, 2003; Lundby et al., 2018; Simpson et al., 2019; Zouboules et al., 2018). Although it is believed that hypobaric hypoxia alters glucose metabolism, the findings are inconsistent, demonstrating both increases and decreases in fasting glucose (Braun et al., 2000; Hill et al., 2018; Louis and Punjabi, 2009; Mackenzie et al., 2011). The adaptations of glucose homeostasis in healthy lowlanders traveling to higher altitudes (moderate altitude: 2,000–3,000 m, high altitude: 3,000–5,500 m, extreme altitude: >5,500 m) are dependent on the rate of ascent and sustained duration at altitude (Bärtsch and Saltin, 2008). In general, fasting plasma glucose appears to increase for the first 2–3 days of exposure to high altitude, stabilizing throughout the first week, and then declining to pre-exposure levels (Sawhney et al., 1991; Sawhney et al., 1986; Stock et al., 1978). The initial, transient rise in blood glucose concentrations is thought to be partially caused by increased activation of the sympathetic nervous system and the increased release of stress hormones such as epinephrine, norepinephrine, and glucocorticoids (Rostrup, 1998; Woods et al., 2011; Woolcott et al., 2015). These hormones cause an increase in gluconeogenesis, hepatic glycogenolysis, skeletal muscle insulin resistance, and suppress insulin secretion (McCowen et al., 2001). Reduced glucose clearance in hypoxic conditions has been observed among healthy populations following an intravenous glucose tolerance test (Louis and Punjabi, 2009; Oltmanns et al., 2004) and chronic obstructive pulmonary disease populations following an oral glucose tolerance test (OGTT) (Hjalmarsen et al., 1996). However, improvements in glucose tolerance were observed among a small sample of males with type 2 diabetes following 60-minute exposure to hypoxic conditions both at rest and during exercise (Mackenzie et al., 2011). Thus, the impact of incremental hypobaric hypoxia on glucose metabolism remains unclear and warrants further investigation.
It is well known that physical activity improves blood glucose regulation and that reduced physical activity is correlated with decline in insulin sensitivity and poor glucose control (Roberts et al., 2013). Few studies have investigated glucose responses to acute or repeated bouts of physical activity during high altitude exposure. Braun et al., (2000) observed that, in healthy populations, glucose, cortisol, and norepinephrine concentrations increased during acute exercise at 4,300 m, whereas blood glucose was reduced with a lower rise in cortisol and norepinephrine during exercise at sea level. More recently, Hill et al. (2018) monitored changes in nocturnal glucose concentrations of 25 healthy adults on a gradual ascent from 1,110 m to 5,120 m of elevation. Mean nocturnal glucose was reported to minimize the influence of meals and physical activity. Glucose increased significantly from baseline (1,100 m, 4.61 ± 0.25 mmol/l) to high altitude (5,120 m, 4.78 ± 0.24 mmol/l).
Thus, the current study aims to compare the impact of a 52 km trek from 2,860 m to 5,160 m over 10 days with low altitude (1,130 m) on daily glucose control (i.e., fasting, mean 24-hour, postprandial glucose, and glucose in response to a 75 g oral glucose bolus). We hypothesized that (1) fasting glucose would rise during a gradual ascent from 1,130 m to 5,160 m, (2) fasting, mean 24-hour, and 1- and 2-hour postprandial glucose would increase and glucose bolus tolerance would decrease on rest days at progressively increasing altitudes, and (3) increasing physical activity intensity would result in a greater reduction in blood glucose as altitude increases from 2,860 m to 5,160 m on trek days.
Materials and Methods
Ethical approval
This project was approved in advance by the University of Alberta Health Research Ethics Board (Pro 00064195) and Mount Royal University Human Research Ethics Board (Protocols 100012 and 101012), harmonized with the Nepal Health Research Council (Protocol 109–2017), which registers research expeditions in Nepal. All participants provided informed written consent before participating in the study.
Design and participants
A prospective experimental design was used to monitor and record participants’ continuous glucose monitor (CGM) glucose and physical activity levels during a 2-week trek in the Khumbu Valley region of the Himalayan mountains in Nepal. Participants were recruited from a group of researchers who were participating in a research expedition in the Himalayas. The group consisted of individuals from Mount Royal University and the University of Alberta. Participants were excluded if they had underlying health conditions that would influence their glucose metabolism or had been diagnosed with diabetes or prediabetes.
Baseline anthropometric, demographic, and health data were recorded in Calgary, Alberta (1,130 m) 2 days before flying to Nepal. The research group spent 1 day in Kathmandu (1,400 m) before flying to Lukla (2,860 m), where they completed 5 1-day treks to reach each of Namche (3,440 m, one rest day), Deboche (3,820 m, one rest day), Pheriche (4,300 m, one rest day), Lobuche (4,910 m), Gorakshep (5,160 m), and a 1-day round trip from Gorakshep to Everest basecamp (5,300 m) and back to Gorakshep. There was 1 day of acclimatization at Namche, Deboche, and Pheriche during ascent for a total trekking duration of 10 days over 52 km (Fig. 1). The group then descended from Gorakshep to Pheriche, Pheriche to Deboche, and Deboche to Lukla. On trekking days, trekking lasted between 4 and 7 hours at each person’s preferred trekking pace.
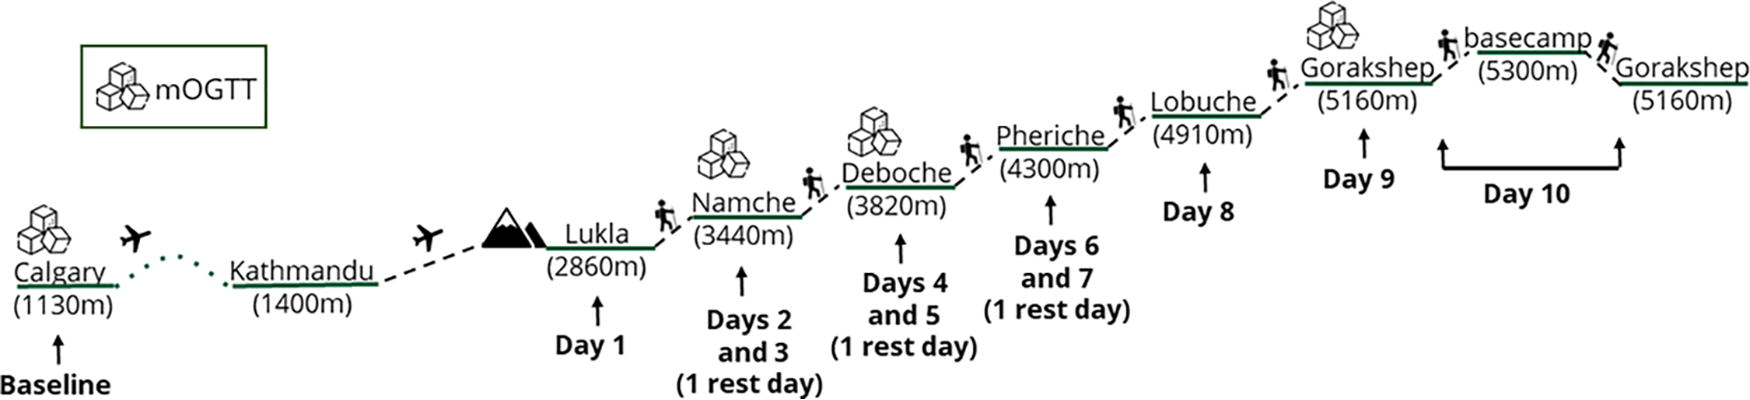
Ascent profile of research group from baseline (Calgary) to high altitudes. mOGTT, modified oral glucose tolerance test.
Instrumentation
To monitor glucose, a blinded CGM (iPro2, Medtronic, Dublin, Ireland), which measures interstitial fluid glucose, was used. The first CGM sensor was applied to the participants’ abdomen in Calgary on the same day their baseline measurements were recorded. The CGM sensors lasted 6 days and were replaced in Lukla and Lobuche (i.e., 3 sensors were worn for 6 days each, for a total of 18 days). Participants were instructed to take four capillary glucose measures each day to calibrate the iPro2 CGMs (OneTouch Ultra 2, LifeScan, Milpitas, USA).
To monitor waking-time physical activity duration and intensity, participants wore an accelerometer on their wrist (Actigraph wGT3X-BT Monitor, Actigraph LLC, Pensacola, USA) for the duration of their time in the Khumbu Valley in Nepal. Participants were asked to fill in a log during this time indicating their sleep and wake times. Upon return to Alberta, activity data was downloaded onto ActiLife 6 software (Actigraph LLC) and analyzed for activity levels.
At four elevations in the study period (Calgary 1,130 m, Namche 3,440 m, Deboche 3,820 m, Gorakshep 5,160 m), participants were asked to undergo a modified oral glucose tolerance test (mOGTT), orally ingesting a liquid drink containing a 75 g glucose bolus, no sooner than 2 hours following their dinner. mOGTT was conducted in the evenings as it was more convenient than before trekking or research activities in the mornings. Participants recorded the time of their glucose bolus in a food log, where they also recorded their food intake and mealtimes during the study period. Participants consumed meals as a group and the meals were generally standard between all participants but may have varied in portion size, as seen in the food logs.
Outcome measures
All glucose measurements were taken from CGM values. The iPro2 CGM reports glucose concentrations as an average every 5 minutes (Zaharieva et al., 2019). To determine fasting glucose concentrations, 3 values from 15 minutes before awakening were averaged on the 10 days of the trek. Daily mean glucose values were determined by averaging 24-hour data from midnight to midnight, excluding days when a glucose bolus was ingested, in which case the values from the start to 2 hours postbolus were excluded from the calculation. One- and 2-hour postprandial and postbolus area under the curve (AUC) and peak glucose values were determined following the start of food or glucose bolus intake. Glucose AUC is a commonly used index of the entire glucose excursion following a glucose load (e.g., mOGTT) and can provide a more complete understanding of glucose tolerance (Sakaguchi et al., 2016).
Physical activity data were measured and recorded by accelerometers worn by participants throughout the study period. Calculation of metabolic equivalent of task (MET) was generated by the software using triaxial acceleration data, and anthropometric data specific to each participant (age, height, pretrekking weight).
Statistical methods
Descriptive statistics were used to report participant anthropometric data and demographics. Data are presented as mean ± S.D. One- and 2-hour postprandial and postbolus AUC were calculated using the trapezoidal method, with the baseline value at the start of food or bolus intake (Allison et al., 1995). Differences in fasting, mean 24-hour, 1- and 2-hour postprandial and postbolus glucose concentrations, and AUC values at each altitude were assessed using one-way repeated measures analysis of variance (ANOVA), or a mixed-model ANOVA in the case of missing values. If a significant effect was found, the Holm-Sidak post-hoc analysis test was run to investigate individual comparisons. The slope of the relationship of METs to glucose concentrations was determined by pairing 5-minute averages of METs with simultaneous CGM data on ascending trek days. Differences in slopes between altitudes were compared using one-way repeated measures ANOVA. Statistical significance was set at p < 0.05. All statistical analyses were completed using GraphPad Prism.
Results
Participant demographics
In total, nine individuals (eight females) were recruited and participated in the present study. The mean age was 23.0 ± 3.5 years, mean height was 1.67 ± 0.10 m, mean body mass was 64.8 ± 7.0 kg, and mean BMI was 23.3 ± 1.7 kg/m2. No participants had a history of diabetes mellitus or were on blood glucose lowering medication. No adverse events were reported in relation to the CGM or physical activity with ascent.
Glucose concentrations
Mean fasting glucose concentrations were not different between locations of varying altitudes (p = 0.335; Fig. 2).

Mean fasting glucose concentration over a 2-week trek at high altitude. Mean ± SD represented with individual data points (circles). No main effect of altitude on fasting glucose concentration (p = 0.335) evaluated with a one-way repeated measures mixed model ANOVA. Data from 2,860 m and from 4,910 m to 5,160 m were not collected/insufficient to be included in analysis.
There were no significant differences in mean 24-h glucose concentrations between altitudes on rest days (p = 0.142) (see Fig. 3). One-hour post breakfast and dinner glucose concentrations were not different between altitudes (p = 0.374, p = 0.197, respectively). However, there was a main effect of altitude on 1-hour post lunch glucose concentrations (p = 0.002), where glucose was lower at low altitude (1,130 m, 4.98 ± 0.29 mmol/l) compared with 3,820 m (6.69 ± 0.79 mmol/l, p = 0.015) and 4300 m (6.16 ± 0.50 mmol/l, p = 0.039). There was no difference in 2-hour post lunch glucose between locations (p = 0.110; Fig. 4A). In contrast, there was a main effect of altitude on 2-hour post dinner glucose concentration (p = 0.032; Fig. 4B), but post-hoc analysis did not identify any individual differences. Two-hour post lunch glucose AUC was different between altitudes (p = 0.015; Fig. 4C); specifically, the AUC was greater at 3,820 m compared with 1,130 m (p = 0.019). Two-hour post dinner glucose AUC was not different between altitudes (p = 0.166; Fig. 4D), however was following the trends of 2-hour post lunch AUC and post dinner glucose concentrations (i.e., higher at altitude). The 2-hour post breakfast values and AUC were not significantly different between altitudes (p = 0.434, p = 0.388, respectively).
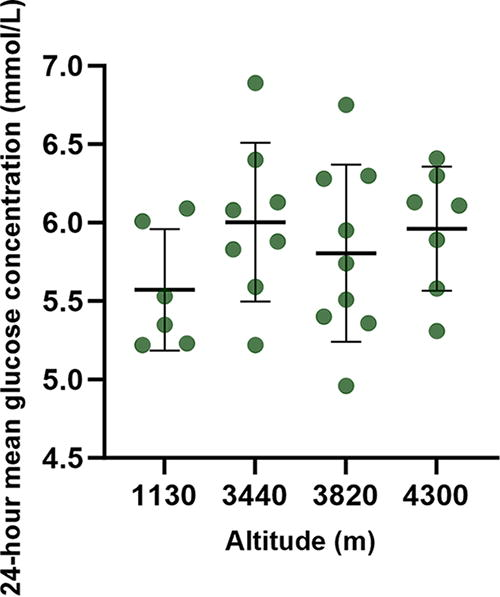
Mean 24-hour blood glucose values on rest days at varying altitudes. Plot shows mean ± SD with individual data points (circles). No significant difference in 24-hour mean glucose concentrations was found (p = 0.142) using a one-way repeated measures mixed model ANOVA.
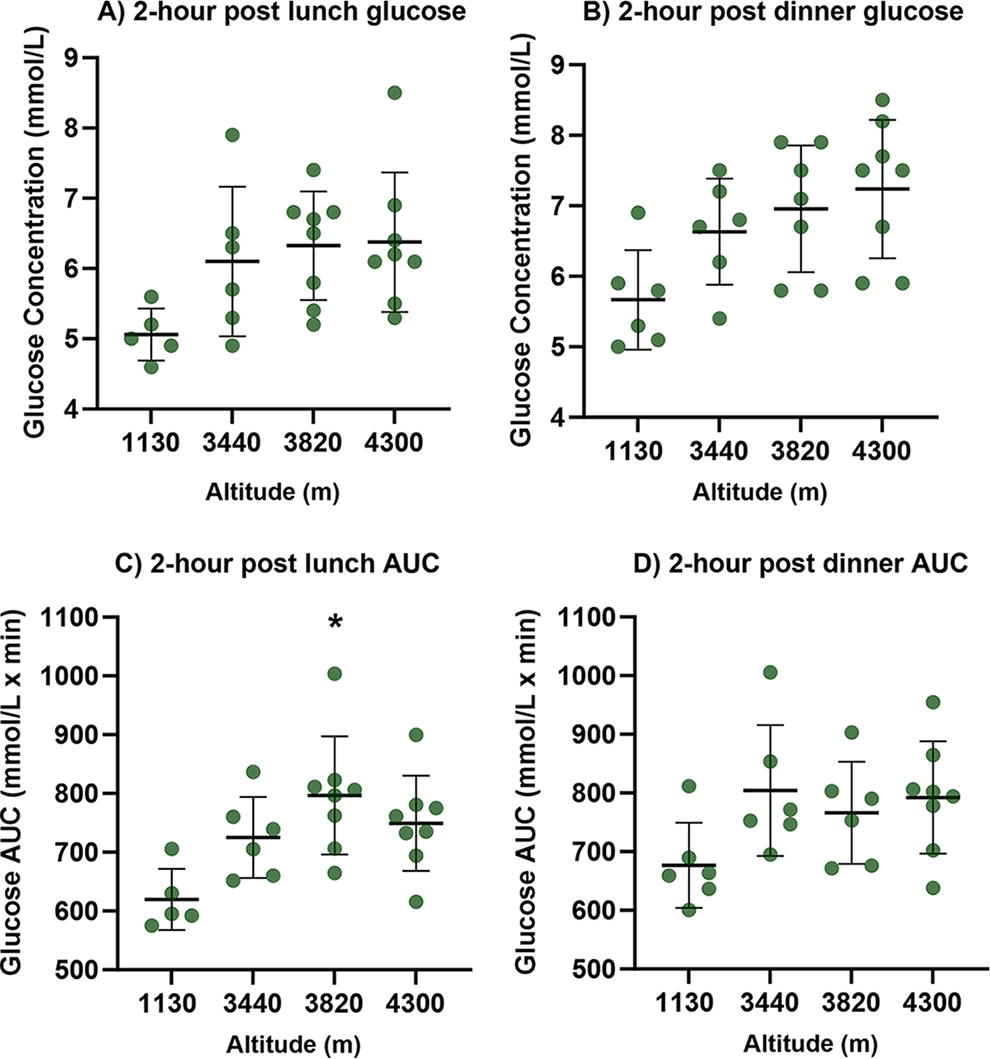
Two-hour postlunch and dinner glucose and area under the curve (AUC) values. Plot shows mean ± SD with individual data points (circles).
There were no significant differences between altitudes in 1-hour and 2-hour postbolus glucose concentrations (p = 0.275, p = 0.882, respectively). There was a main effect of altitude on 1-hour (p = 0.034) and 2-hour (p = 0.020) postbolus AUC values with individual differences between low altitude (1,130 m) and the first day at altitude in which a glucose bolus was administered (3,440 m) (1-hour, p = 0.025; 2-hour, p = 0.027).
Physical activity intensity and blood glucose values
There were no significant differences observed in the relationship between METs and glucose concentrations between locations, including low altitude and the gradual ascent from 2,860 m to 5,160 m (p = 0.880; Fig. 5).

The relationship between physical activity intensity (METs) and blood glucose levels at different altitudes. Plot shows mean ± SD with individual data points (circles). No significant difference in the slope of the relationship between physical activity intensity and glucose values between altitudes was found (p = 0.880) using a one-way repeated measures mixed model ANOVA. METs, metabolic equivalent of tasks.
Discussion
The present study investigated the influence of trekking to high altitude on fasting, mean 24-hour, and postprandial glucose concentrations, as measured by CGM. This study is the first of its kind to investigate the influence of physical activity intensity on CGM glucose at high altitude in young, healthy individuals. We observed no change in fasting or mean 24-hour glucose upon abrupt exposure to high altitudes. Postprandial glucose values were inconsistent; glucose concentrations after dinner but not lunch were higher at altitude, whereas postprandial glucose AUC values were higher following lunch but not dinner at altitude. Nevertheless, all the postprandial glucose concentrations and AUC values followed a similar trend of higher at high compared with low altitude. We also did not observe that the association between physical activity and glucose was altered by abrupt and increasing exposures to high altitude.
Glucose is a major source of fuel for synthesizing ATP, and as such, plays an important part in metabolism. In healthy humans, blood glucose values are tightly regulated by hormones such as glucagon and insulin (Jiang and Zhang, 2003). Under normal resting conditions, healthy individuals can manage tight control of blood glucose concentrations with levels between 3.9 and 5.6 mmol/l fasting plasma glucose or preprandial plasma glucose, and below 7.8 mmol/l following an OGTT (World Health Organization, 2024; Diabetes Canada Clinical Practice Guidelines Expert, 2018). We observed that fasting glucose was not altered across increasingly higher altitudes. Our findings are consistent with previous literature (Braun et al., 2000; Consolazio et al., 1972); however, it contrasts with recent work from Hill et al. (2018), who identified an increase in fasting glucose upon exposure to high altitude. Notable differences exist between the present study and Hill et al. (2018) which may have contributed to these discrepant results. Participants in the present study were flown from Kathmandu (1,400 m) to Lukla (2,860 m), whereas participants in Hill et al. (2018) completed shorter daily ascents of ∼500 m. As such, the participants in the present study experienced an abrupt exposure to high altitude meaning less time for metabolic adaptations to occur between altitudes. Further, participant characteristics vary greatly between Hill et al. (2018) and the present study. Hill et al. (2018) recruited predominantly male military members in their sample. Thus, there are significant sex and possible fitness level differences between the study populations. Braun et al. (2000) observed that blood glucose concentrations and carbohydrate oxidization at rest were lower among females after 10 days of exposure to 4,300 m of elevation. Although no association was found between estrogen and progesterone levels and blood glucose utilization across the period, they speculate a more prominent relationship between carbohydrate use and sex hormones may be observed in a less-trained population. Indeed, among the same group of participants, an earlier study observed glucose tolerance was significantly reduced at peak estrogen and progesterone levels across the menstrual cycle (Braun et al., 1998). Further, Basu et al. (2006) found postprandial glucose turnover to be higher in females than males. Therefore, discrepant results across the literature may be due, in part, to differences in sex hormones between study populations. Unfortunately, this data was not collected from our participants; thus, we are unable to comment on contraceptive use or menstrual cycle phase. It is important to note that our participants were predominately female (8 F/1 M). Although we did not identify the male participant as an outlier or find reasonable justification for their exclusion, we cannot rule out the influence this may have on our results.
Postprandial glucose was significantly different 2 hours following dinner between altitudes. These findings are consistent with previous literature which observed glucose intolerance in response to hypoxia (Hjalmarsen et al., 1996; Louis and Punjabi, 2009; Oltmanns et al., 2004). Progressively higher altitudes did not seem to affect postprandial glucose values. However, there was inconsistency in postprandial glucose following lunch or when assessed as AUC. It is unclear why these inconsistencies appeared, but they could be owing to a small sample size or missing data points (as is the nature of expedition research). Similarly, some evidence suggests inconsistencies with CGMs during hypobaric hypoxia (Adolfsson et al., 2012; de Mol et al., 2010), which could contribute to the variability in our data. Interestingly, the glucose response to a bolus ingestion was not different between low and high altitude; however, when assessed as AUC values, the bolus response was higher during initial altitude exposure compared with low altitude. These responses differ from the observed postprandial glucose responses; one possible reason could be differences in the caloric or carbohydrate composition of the meals before bolus ingestion.
The present study did not find that exposure to high altitude altered the relationship between glucose concentrations and physical activity intensity. Exercise-stimulated glucose uptake occurs through increased glucose delivery to the working muscle and GLUT-4 translocation to the sarcolemma and t-tubules promoted by muscle contraction (Sylow et al., 2017). Therefore, there is an increase in glucose uptake into the muscle cells; however, this is balanced by a rise in hepatic glucose production, thus maintaining blood glucose levels (Colberg et al., 2010). Under hypoxic conditions, reduced insulin sensitivity may occur owing to the heightened sympathetic response (Braun et al., 2001; Barnholt et al., 2006; Larsen et al., 1997), thus blunting the exercise-stimulated glucose uptake. Hill et al. (2018) observed a hyperglycemic response to increasing altitude with a simultaneous increase in insulin sensitivity. They speculated that the stress response to altitude, and therefore an increase in stress hormone release, dominated glycemic response to exercise and hyperglycemic response occurred despite the usually exercise-enhancing insulin sensitivity (Hill et al., 2018). Although exercise may be working to promote insulin sensitivity and glucose uptake into the muscular tissue, the effects of high altitude on adrenergic receptors may be equally as strong, having been stimulated by catecholamines released owing to exposure to high altitude, and stimulating release of glucose into the bloodstream. However, we did not see a similar hyperglycemic response to altitude. Hill et al. (2018) specifically observed increased glucose overnight, whereas we reported mean 24-hour glucose. It is possible altitude-induced hyperglycemia is more pronounced overnight and thus a difference is not observed in mean 24-hour concentrations.
Although in the present study fasted and mean 24-hour glucose were not impacted by exposure to increasingly higher altitudes, 2-hour postprandial glucose was different between locations. Thus, our findings contribute to the growing evidence demonstrating an impact of high-altitude exposure on glucose metabolism, however a clear understanding of the exact impacts is still missing. Meyer et al. (2006) suggest that impaired fasting glucose and impaired glucose tolerance are distinct conditions that have different pathophysiologies. Our results support that high altitude may impact glucose metabolism differently between fasting and postprandial glucose; hypoxia may have diverse effects on these disparate mechanisms. Considering the heightened prevalence of metabolic disease worldwide and the increasing number of people travelling to high altitude regions, it is important to understand the metabolic implications of physical activity at high altitude. Further research with greater sample sizes and sex difference analyses are required to help guide individuals with metabolic conditions to safely visit and be physically active at high altitude.
Limitations
The objective of the study was to examine the influence of high altitude on glucose control, measured using CGM, during a 2-week trek in young, healthy adults. Although the results provide an insight into this relationship, a more clinically relevant population would include individuals with metabolic disease and those at higher risk of having metabolic health issues, such as older adults. A recent study by El-Rifai et al. (2023) in a small subset of participants suggests CGM devices may be inaccurate at high altitude; therefore, our results may need to be interpreted with caution. A study investigating the accuracy of blood glucose monitors at altitude found a tendency for monitors to overestimate glucose levels in simulated altitude (i.e., hypobaric hypoxia) (de Mol et al., 2010). We did observe higher than expected fasting glucose levels in our healthy participants (Fig. 2). It is possible this was an effect of altitude on the CGM; however, there was no difference between low and high altitude so it is unlikely. Another limitation in this study is that the accelerometer was worn on the wrist rather than the waist, which provides less accurate physical activity data. However, this was necessary as the trekking backpacks may not have left room for appropriate waist wear of the device. Finally, although food logs to record timing of meals were collected, they were not detailed enough to perform a dietary analysis.
Strengths
This study is the first of its kind to compare the combined influence of high altitude hypobaric hypoxia and physical activity intensity on blood glucose regulation using continuous glucose monitoring. This study also investigated the influence of postglucose load tolerance using meals as well as a clinical measure of glucose tolerance (OGTT). This makes it easier to compare glucose tolerance across individuals and also across future studies, should they also use a 75-g OGTT.
Future directions
Future research should target a more clinically important population, such as those who have already been flagged for being at risk of developing metabolic disease, or those who have already been diagnosed with metabolic disease. Particularly, investigation of glucose metabolism at high altitude among older adults warrants attention as they are at higher risk for developing metabolic disease and are a prominent demographic of the individuals traveling to high altitude destinations.
Conclusions
Our findings demonstrate that fasting and mean 24-hour glucose concentrations do not change significantly upon exposure to increasingly high altitudes. Postprandial glucose concentrations were inconsistent; following dinner but not lunch, 2-hour postprandial glucose was different between altitudes. Albeit not all values being significant, all postprandial glucose concentrations appeared to follow a similar trend of being higher at high altitude. Further research is needed to clarify the postprandial glucose response to altitude. These findings come from young, healthy adults without a history of impaired glucose tolerance, and thus future research should investigate the relationship between hypobaric hypoxia at high altitude, physical activity, and blood glucose control in clinically relevant populations, such as older individuals or those with metabolic disease.
Footnotes
Acknowledgements
We would like to acknowledge and thank our local guides and porters for supporting this expedition.
Authors’ Contributions
M.H.D., C.D.S., N.G.B. T.D., and J.L.R.: Contributed to the conception and design of the study. C.D.S., T.D., G.P., J.L.R., and M.J.: Took part in expedition and data collection. M.S., M.J., L.R., and J.L.R.: Completed the analysis of the data, and L.R., M.L.K., and L.E.M.: Drafted the article. All authors took part in critically reviewing the article and gave final approval.
Data Availability Statement
Further data may be available from the authors on request.
Author Disclosure Statement
The authors have declared that no competing interests exist.
Funding Information
C.D.S. NSERC Discovery Grant RGPIN-2020–05385