
Abstract
Convection-enhanced delivery (CED) of recombinant adeno-associated virus (rAAV) vectors is a promising approach for delivery of therapeutic transgenes to the brain. In this study we have systematically examined vector dosing in vivo. Infusions of rAAV serotypes 2/1, 2/2, 2/rh8, 2/9, and 2/rh10 expressing an enhanced green fluorescent protein reporter gene were undertaken into the striatum of rats and pigs using CED. Vector distribution, as defined by the volume of distribution and number of transduced cells following each infusion, was determined using stereological methods. Immunohistochemistry was used to determine the transductional tropism of serotypes and to evaluate for the presence of immune cell infiltration into the brain. Vector distribution was highly variable between serotypes. Infusion rate had no significant effect on vector distribution or the occurrence of tissue damage. For serotypes 2/1, 2/2 and 2/rh10, as the vector concentration was increased beyond 1012 vg/ml, no increase in vector distribution was observed. In contrast, for serotypes 2/rh8 and 2/9, retrograde axonal transport was observed above this threshold concentration. Cell transduction was principally neuronal for all serotypes and was associated with a low-level immune response. In planning clinical trials it is critical that these observations are considered in order to achieve optimal vector dosing.
Introduction
A failure to appreciate the difficulties associated with achieving adequate drug distribution in a human brain has contributed to the failure of clinical trials of therapeutic agents administered directly into the brain, despite robust evidence of efficacy in animal models. For example, intraventricularly administered glial cell line-derived neurotrophic factor has been demonstrated to lead to significant symptomatic benefits in MPTP-lesioned monkeys (Gash et al., 1996; Zhang et al., 1997). When this approach was translated into a phase I clinical trial treating patients with Parkinson's disease, no benefit was observed (Nutt et al., 2003). Furthermore, postmortem examination of the brain of a patient from this study suggested that glial cell line-derived neurotrophic factor had only penetrated a short distance into the brain parenchyma (Kordower et al., 1999). However, when our group used convection-enhanced delivery (CED) to administer glial cell line-derived neurotrophic factor directly into the putamen of patients with Parkinson's disease, profound benefits were observed (Gill et al., 2003; Love et al., 2005).
CED depends on the use of appropriate cannulae and infusion flow rate to distribute therapeutic agents by bulk flow directly into the brain extracellular space (Bobo et al., 1994; Chen et al., 1999). Utilizing CED it is possible to achieve widespread and homogeneous distribution of therapeutic agents regardless of their molecular size or source concentration and is consequently an ideal technique for the delivery of gene therapy vectors to the brain (Chen et al., 2005). Both recombinant AAV (rAAV) 1 and rAAV2 have been shown to be efficiently distributed in the brain by CED in animal models (Cunningham et al., 2000, 2008; Chen et al., 2005; Hadaczek et al., 2009). In addition, AAV2 has also been used in a number of clinical trials for the treatment of Parkinson's disease. These trials have involved CED or intraparenchymal injection of these vectors into the putamen or subthalamic nucleus (Kaplitt et al., 2007; Eberling et al., 2008; Marks et al., 2008). However, to date no attempt has been made to identify the optimum infusion rates or viral titers necessary to achieve maximal vector distribution and cell transduction by CED.
Several preclinical studies have compared the transduction profiles of different serotypes of rAAV (Davidson et al., 2000; Burger et al., 2004; Cearley and Wolfe, 2006; Taymans et al., 2007). However, none of these studies has provided definitive data to guide clinicians on vector dosing for use in clinical trials. It is our intention to undertake a trial of rAAV-mediated gene therapy for the treatment of Tay–Sachs disease in the near future. However, if this trial is to be successful, it is essential to know the relationships among the rAAV serotype, the vector concentration, the infused volume, and the volume of distribution of cell transduction when CED is used. In this study, we have evaluated these relationships in detail for rAAV serotypes 2/1, 2/2, 2/rh8, 2/9, and 2/rh10 in both rat and pig brain using a catheter-based delivery system analogous to the system that we intend to use in our clinical trial.
Materials and Methods
Vectors
All AAV vectors (serotypes 2/1, 2/2, 2/rh8, 2/9, and 2/rh10) carry the same genome, AAV-CBA-GFP-W (Broekman et al., 2006); AAV vectors serotyped with AAV8 capsid are more efficient than AAV1 or -2 serotypes for widespread gene delivery to the neonatal mouse brain, where the hybrid promoter CBA controls green fluorescent protein (GFP) expression. This hybrid promoter is composed of the cytomegalovirus immediate early enhancer fused to the chicken β-actin promotor. The transcriptional cassette also carries the woodchuck hepatitis virus post-transcriptional regulatory element. All AAV vectors used in this study were produced by transient triple transfection of 293T cells followed by iodixanol gradient centrifugation and anion-exchange chromatography as described. Titers were determined by real-time polymerase chain reaction using a probe and primers specific for the bovine growth hormone polyadenylation element present in the AAV vector. Vector production, purification, and titration were as previously described (Broekman et al., 2006). Principally the vectors were used to evaluate the distribution of cell transduction rather than the location of infused capsids as this is clearly more relevant in achieving the safe and efficacious application of gene therapy in clinical practice.
Vector infusions
All procedures were carried out in accordance with UK Home Office animal welfare regulations and with appropriate Home Office licenses.
Rat infusion apparatus and procedures
Acute infusion cannulae were constructed from lengths of fused silica with an outer diameter of 220 μm and an inner diameter of 150 μm. These lengths of fused silica were connected to 10-μl Hamilton syringes via a connection device made in-house that served to create a seal between the chamber of the Hamilton syringe and the lumen of the fused silica and that guided the fused silica cannula from the Hamilton syringe through the dura and into the brain. The Hamilton syringe, with the cannula attached via this connector device, was then mounted in an infusion pump (World Precision Instruments Inc., Sarasota, FL) attached to a stereotactic frame (Stoelting Co., Wood Dale, IL) in which rats were immobilized. To insert a cannula, the entire pump/syringe/connector/cannula construct was lowered in the stereotactic frame until the target depth was reached.
Male Wistar rats (B & K Universal Ltd., Hull, UK) were group-housed and allowed to acclimatize prior to experimental procedures. Male rats weighed 225–275 g were anesthetized with an intraperitoneal dose of ketamine and xylazine and placed in the stereotactic frame. A linear incision was made between the glabella and the occiput, and the skull was exposed. Burr holes with a diameter of approximately 2 mm were placed 0.5 mm anterior and 2.75 mm lateral to the bregma and cannulae were inserted to a depth of 5 mm below the dura. All cannulae were preprimed with vector prior to insertion into the brain. Every attempt was made to ensure that no air bubbles were present in the infusion cannula. Infusions of 2.5 μl of vector were undertaken at infused viral concentrations of 1010 vg/ml, 1012 vg/ml, and 1013 vg/ml at rates of 1 μl/min, 2.5 μl/min, or 5 μl/min (as outlined in Table 1). Following infusion completion, the cannula was left in situ for 5 min before being withdrawn at a rate of 1 mm/min. The wound was then closed with 4/0 Vicryl, a dose of intramuscular buprenorphine was administered (30 μg/kg), and the anesthetic was reversed with a 0.1 mg/kg intraperitoneal dose of atipamezole hydrochloride (Antisedan; Pfizer, Sandwich, Kent, UK) (200 μg/kg). After 28 days, animals were perfusion-fixed with 100 ml of phosphate-buffered saline (PBS) followed by 100 ml of 4% paraformaldeyhde in PBS (pH 7.4). The brain was then removed from the skull, placed in 4% paraformaldeyhde (pH 7.4) for 48 hr, and then cryoprotected in 30% sucrose prior to sectioning.
Pig infusion apparatus and procedures
Animals were administered an intramuscular dose of ketamine (0.1 mg/kg of body weight). General anesthesia was then induced and maintained with isoflurane (2–5%), and the animals were intubated with a cuffed endotracheal tube. Intravenous access was obtained using a cannula placed in an ear vein, and normal saline was infused at a rate of 250 ml/hr.
Pig head fixation was achieved using a custom-built fixation device incorporating bilateral magnetic resonance (MR) imaging (MRI)-compatible zygomatic screws, a moldable palate tray, and a snout strap. All materials were fully MR-compatible to prevent imaging artifacts. Following robust pig head fixation, an arc of fiducials was placed over the animal's head. Flex-L coils were then attached to the lateral aspects of the head, and the animal was transferred to a 1.5-T MRI scanner (Intera, Philips, Guilford, UK). Stereotactic surgical planning and procedures were undertaken using a Pathfinder (Prosurgics, Bracknell, UK) stereotactic robotic arm and associated software. In brief, this stereotactic arm functioned as follows. The pig was imaged with an array of fiducial balls placed in a fixed location over the animal's head. In surgery, the fiducial balls were replaced with optical reflector balls placed into precisely the same locations. The locations of the reflector balls were visualized using a camera in the underside of the robotic arm. The optical reflector balls and MRI fiducials were co-recorded automatically by the planning software. The software only allowed visualization of MR images from a single plane. Consequently, as coronal images facilitated the best views of the planned cannula trajectory, they were used for all surgical planning. To conduct the surgical procedure, a range of end-effectors designed to accommodate the burr hole generation and cannula delivery tooling were placed onto the robotic arm.
Vector infusions were undertaken into male Large White Landrace pigs weighing 35–40 kg using a catheter delivery system developed in-house. Specifically, infusions of each rAAV serotype at 120 μl of 1011 vg/ml were each undertaken unilaterally into the putamen using a catheter system composed of a length of fused silica (outer diameter, 220 μm; inner diameter, 150 μm) bonded to a glass Hamilton syringe. This catheter system was inserted to target through a series of carbothane guide tubes. Infusions were performed using the following regimen: 0.5 μl/min for 5 min, 1 μl/min for 5 min, 2.5 μl/min for 5 min, and then 5 μl/min for 20 min. Following infusion completion, the cannula was left in place for 10 min prior to being withdrawn slowly by hand. Cerebrospinal fluid leakage from the burr hole and cannula track was sealed with Cerebond (Plastics One, Roanoke, VA) prior to wound closure. The animals were then transferred back to the MRI scanner, and T2-weighted imaging was performed to confirm that cannulae had been accurately inserted to target. Animals were allowed to recover for a period of 28 days, before being killed by perfusion fixation under terminal anesthesia, and the brains were harvested for histological analysis.
Histology
Rat brains were cut into 35-μm thick coronal sections using a cryostat (model CM1850, Leica Microsystems, Milton Keynes, UK). Pig brains were cut into 100-μm coronal sections using a Leica SM2500 microtome.
In brief, all solutions for immunohistochemistry were made in PBS. Free-floating paraformaldehyde-fixed sections were washed three times for 15 min in PBS. Sections were then blocked for 1 hr in blocking solution (10% normal goat or donkey serum) in Triton X-100 (0.1% for rat sections and 0.3% for pig sections) at room temperature. Sections were then transferred directly from blocking solution into primary antibody, appropriately diluted in blocking solution, and incubated overnight at 4°C. The following primary antibodies were used: mouse anti-NeuN (diluted 1:300; Millipore, Watford, UK), rabbit anti–glial fibrillary acidic protein (diluted 1:200; Millipore), mouse anti-ED1 (diluted 1:100; AbD Serotec, Oxford, UK), mouse anti-CD4 (Ox38) (diluted 1:300; AbD Serotec), and mouse-anti CD8 (Ox-8) (diluted 1:300; AbD Serotec). After three washes with PBS and Triton X-100 (0.1%/0.3%), sections were then incubated with secondary antibody for at least 2 hr at room temperature. For immunofluorescence, Cy3-conjugated species-specific secondary antibodies were used (diluted 1:200; Jackson Laboratories, Sacramento, CA). After PBS washes, sections were mounted in Vectashield (Vector Laboratories, Burlingame, CA) on gelatin-coated slides and coverslipped, prior to imaging.
For 3,3'-diaminobenzidine (DAB) immunocytochemistry, paraformaldehyde-fixed pig sections were washed three times in PBS for 5 min each and then blocked for 1 hr in blocking solution (10% normal rabbit serum) with Triton X-100 (0.3%) at room temperature. Sections were then placed in enhanced GFP (EGFP) primary antibody (diluted 1:1,000; Abcam, Cambridge, UK) and incubated overnight at 4°C. The following day, sections were washed three times in PBS with Triton X-100 (0.3%) for 5 min each. The sections were then incubated in a rabbit anti-chicken horseradish peroxidase–conjugated secondary antibody (diluted 1:300; Abcam) for 1 hr at room temperature. Following this, three PBS washes were carried out, and DAB reagent (Peroxidase Substrate Kit; Vector Laboratories) was applied to mounted sections for 2 min to allow DAB color to develop. The DAB reaction was stopped with two distilled water washes, and the sections were dehydrated through increasing concentrations of alcohol followed by immersion in xylene and coverslipped with Perspex mounting reagent (CellPath, Newtown, Powys, Wales, UK).
Imaging
Fluorescent imaging was undertaken using a Leica DM5500 microscope and digital camera (CX9000, Microbrightfield, Williston, VT). Stereological counts were undertaken on immunostained sections by fluorescent microscopy using Stereoinvestigator software (Microbrightfield). In brief, population estimates were undertaken on representative tissue sections to determine the counting frame size, counting frame number, and number and separation of tissue sections necessary to achieve an accurate cell count with a Gundersen (m = 1) coefficient of error of less than 0.1. Using these parameters, cell counts were then undertaken on serial sections of a uniform distance apart using the optical fractionator probe. The volume of distribution of transduced cells was calculated by tracing contours around the outer margins of the EGFP-expressing cells on each section. Transduced cells outside the striatum were excluded from these contours to ensure that only the intrastriatal volume of distribution of transduced cells was calculated. Infusions that were associated with obvious leakage of vector into the ventricular system were excluded from further analysis. Determination of the density of activated microglia and CD4- and CD8-positive T-lymphocytes in the volume of viral distribution for each infusion was performed on selected tissue sections close to the needle track using the optical fractionator probe. Determination of NeuN-positive cells for vector tropism of each serotype was performed on multiple sections, with the first being closest to the needle track and the others with a distance of 210 μm between each other (every sixth section). Within the transduced striatum, randomly chosen fields of view were assessed for co-localization of EGFP with NeuN using the optical fractionator probe. The results were expressed as a percentage of the total number of EGFP-positive cells.
Statistical analysis
Evaluation of statistical significance was achieved by application of paired two-sample t tests assuming equal variance.
Results
Effect of infusion flow rate on rAAV-mediated cell transduction in rat striatum
Infusions of rAAV (serotypes 2/1, 2/2, 2/rh8, 2/9, and 2/rh10) were performed at infusion flow rates of 1 μl/min, 2.5 μl/min, and 5 μl/min. Infusions were performed at each rate at a viral concentration of 1010 vg/ml and 1012 vg/ml. In general, efficient cell transduction was observed at all infusion rates. There was no obvious relationship between the infusion flow rate and the volume of distribution of EGFP-positive cells (Fig. 1a) or the total number of EGFP-positive cells in the striatum (Fig. 1b) at either titer. Reflux, as defined by the presence of EGFP-positive cells along the cannula track in the cortex, was observed for a small number of infusions, although there was no correlation between the infusion rate and the occurrence of reflux.
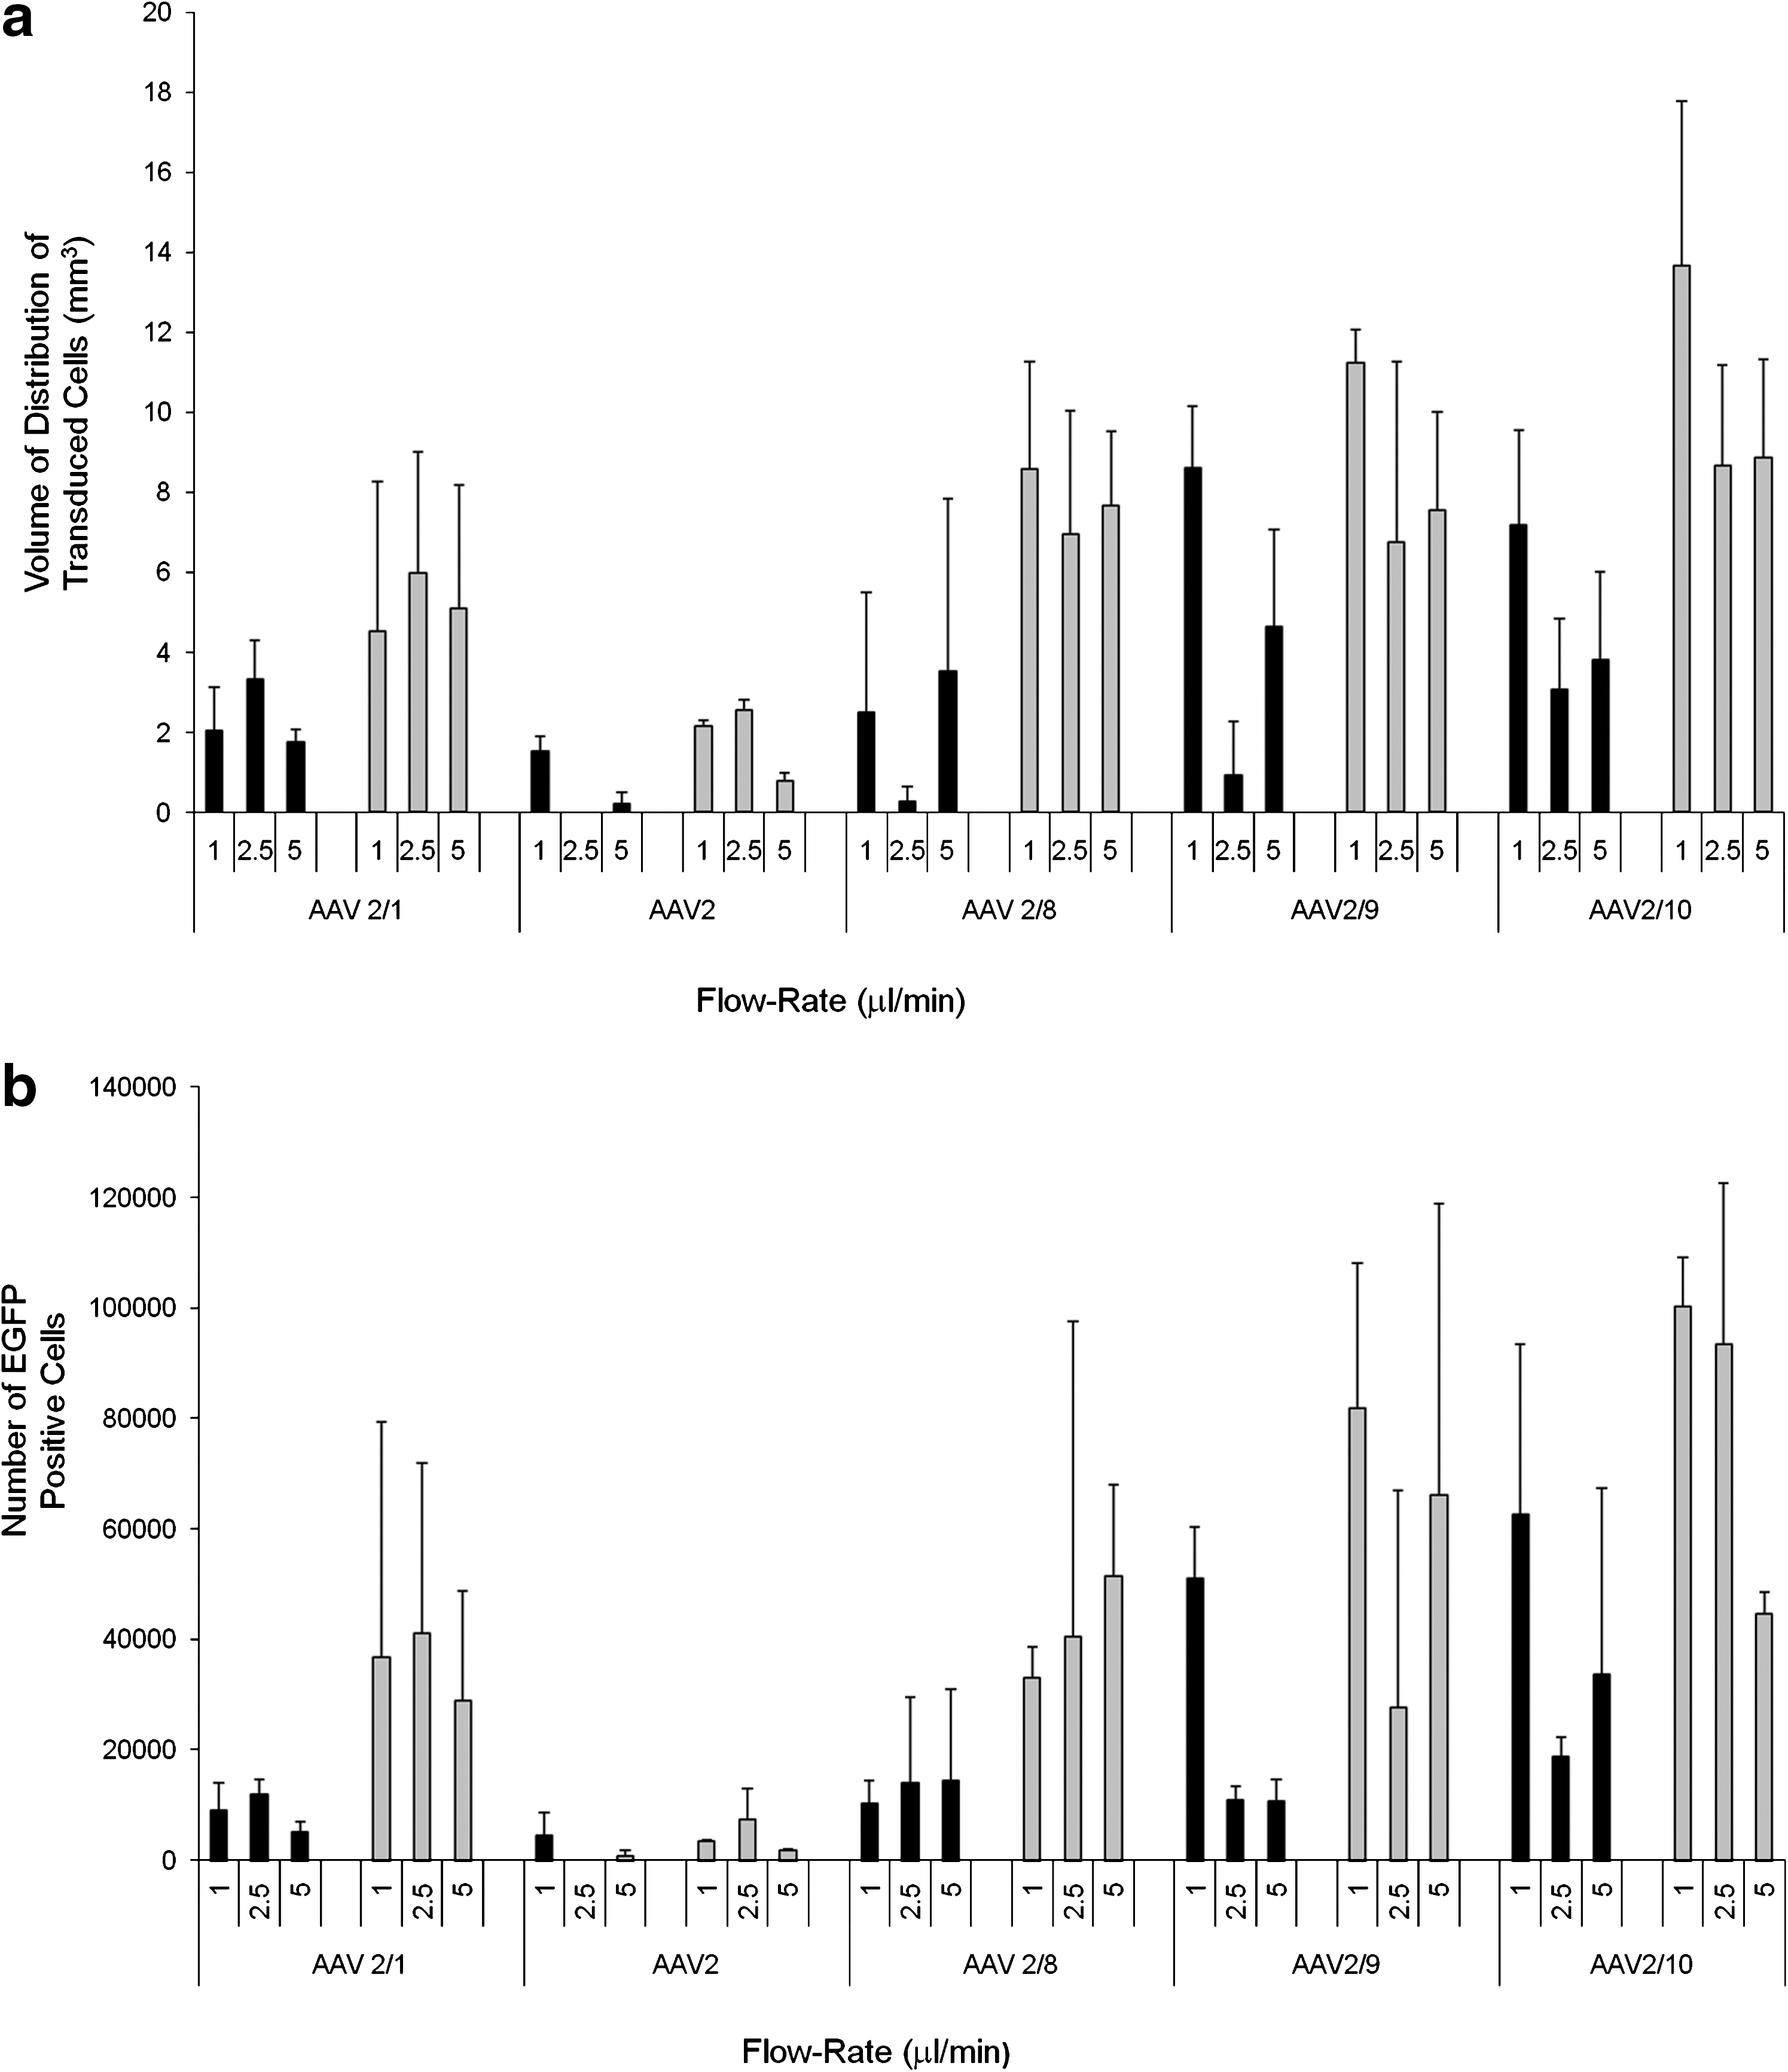
Effect of infusion flow rate on vector distribution. The relationship between infusion flow rate and distribution of rAAV (serotypes 2/1, 2/2, 2/8, 2/9, and 2/rh10) was evaluated at infusion titers of 1 × 10¹⁰ vg/ml (black bars) and 1 × 10¹² vg/ml (gray bars) in rat striatum as determined by (
Effect of infused viral titer on rAAV distribution
Establishing that the infusion flow rate had no demonstrable effect on the volume of distribution of transduced cells, the total number of transduced cells in the striatum, or the occurrence of vector reflux led to the conclusion that rAAV could be efficiently distributed at flow rates as fast as 5 μl/min without causing tissue damage at the cannula tip. Infusions of rAAV serotypes at a titer of 1013 vg/ml were then performed at a flow rate of 5 μl/min (n = 3 per vector). As the infusion rate did not have an obvious effect on any of the measured parameters (Fig. 1), we combined the data from each dose (n = 6 per dose at 1010 vg/ml and 1012 vg/ml) to assess the effect of infused vector titer on the same parameters as before.
A statistically significant increase in the number and volume of distribution of transduced cells was observed for all rAAV serotypes, except serotype 2/2, when the infusion titer was increased from 1010 to 1012 vg/ml (p < 0.02) (Table 2). For serotype 2/2, when the infused titer was increased from 1010 to 1012 vg/ml, there was a significant increase in the volume of distribution of transduced cells (p = 0.012; Table 2), but not the number of transduced cells (p = 0.11; Table 3). At an infused titer of 1010 vg/ml, the volume of distribution of transduced cells for serotypes 2/1, 2/9, and 2/rh10 was significantly greater than for infusions of serotype 2/2 (p = 0.0028, 0.012, and 0.002, respectively) (Fig. 2a and Table 2). At this titer the number of transduced cells was also significantly greater for infusions of serotypes 2/1, 2/rh8, 2/9, and 2/rh10 compared with infusions of serotype 2/2 (p = 0.003, 0.016, 0.014, and 0.006, respectively) (Fig. 2b and Table 3). In addition, the volume of distribution of transduced cells for infusions of serotype 2/rh10 was significantly greater than for infusions of rAAV serotypes 2/1 (p = 0.003) (Fig. 2a and Table 2), and the number of transduced cells at this titer with serotype 2/rh10 was significantly greater than for infusions of serotypes 2/1 and 2/rh8 (p = 0.016 and 0.034, respectively) (Fig. 2b and Table 3). There was no significant difference in the volume of distribution of transduced cells between serotypes 2/rh8 and 2/9 (p = 0.098), 2/rh8 and 2/rh10 (p = 0.063), and 2/9 and 2/rh10 (p = 0.49) (Fig. 2a and Table 2) or in the number of transduced cells at this titer between serotypes 2/rh8 and 2/9 (p = 0.13) or 2/9 and 2/rh10 (p = 0.18) (Fig. 2b and Table 3).
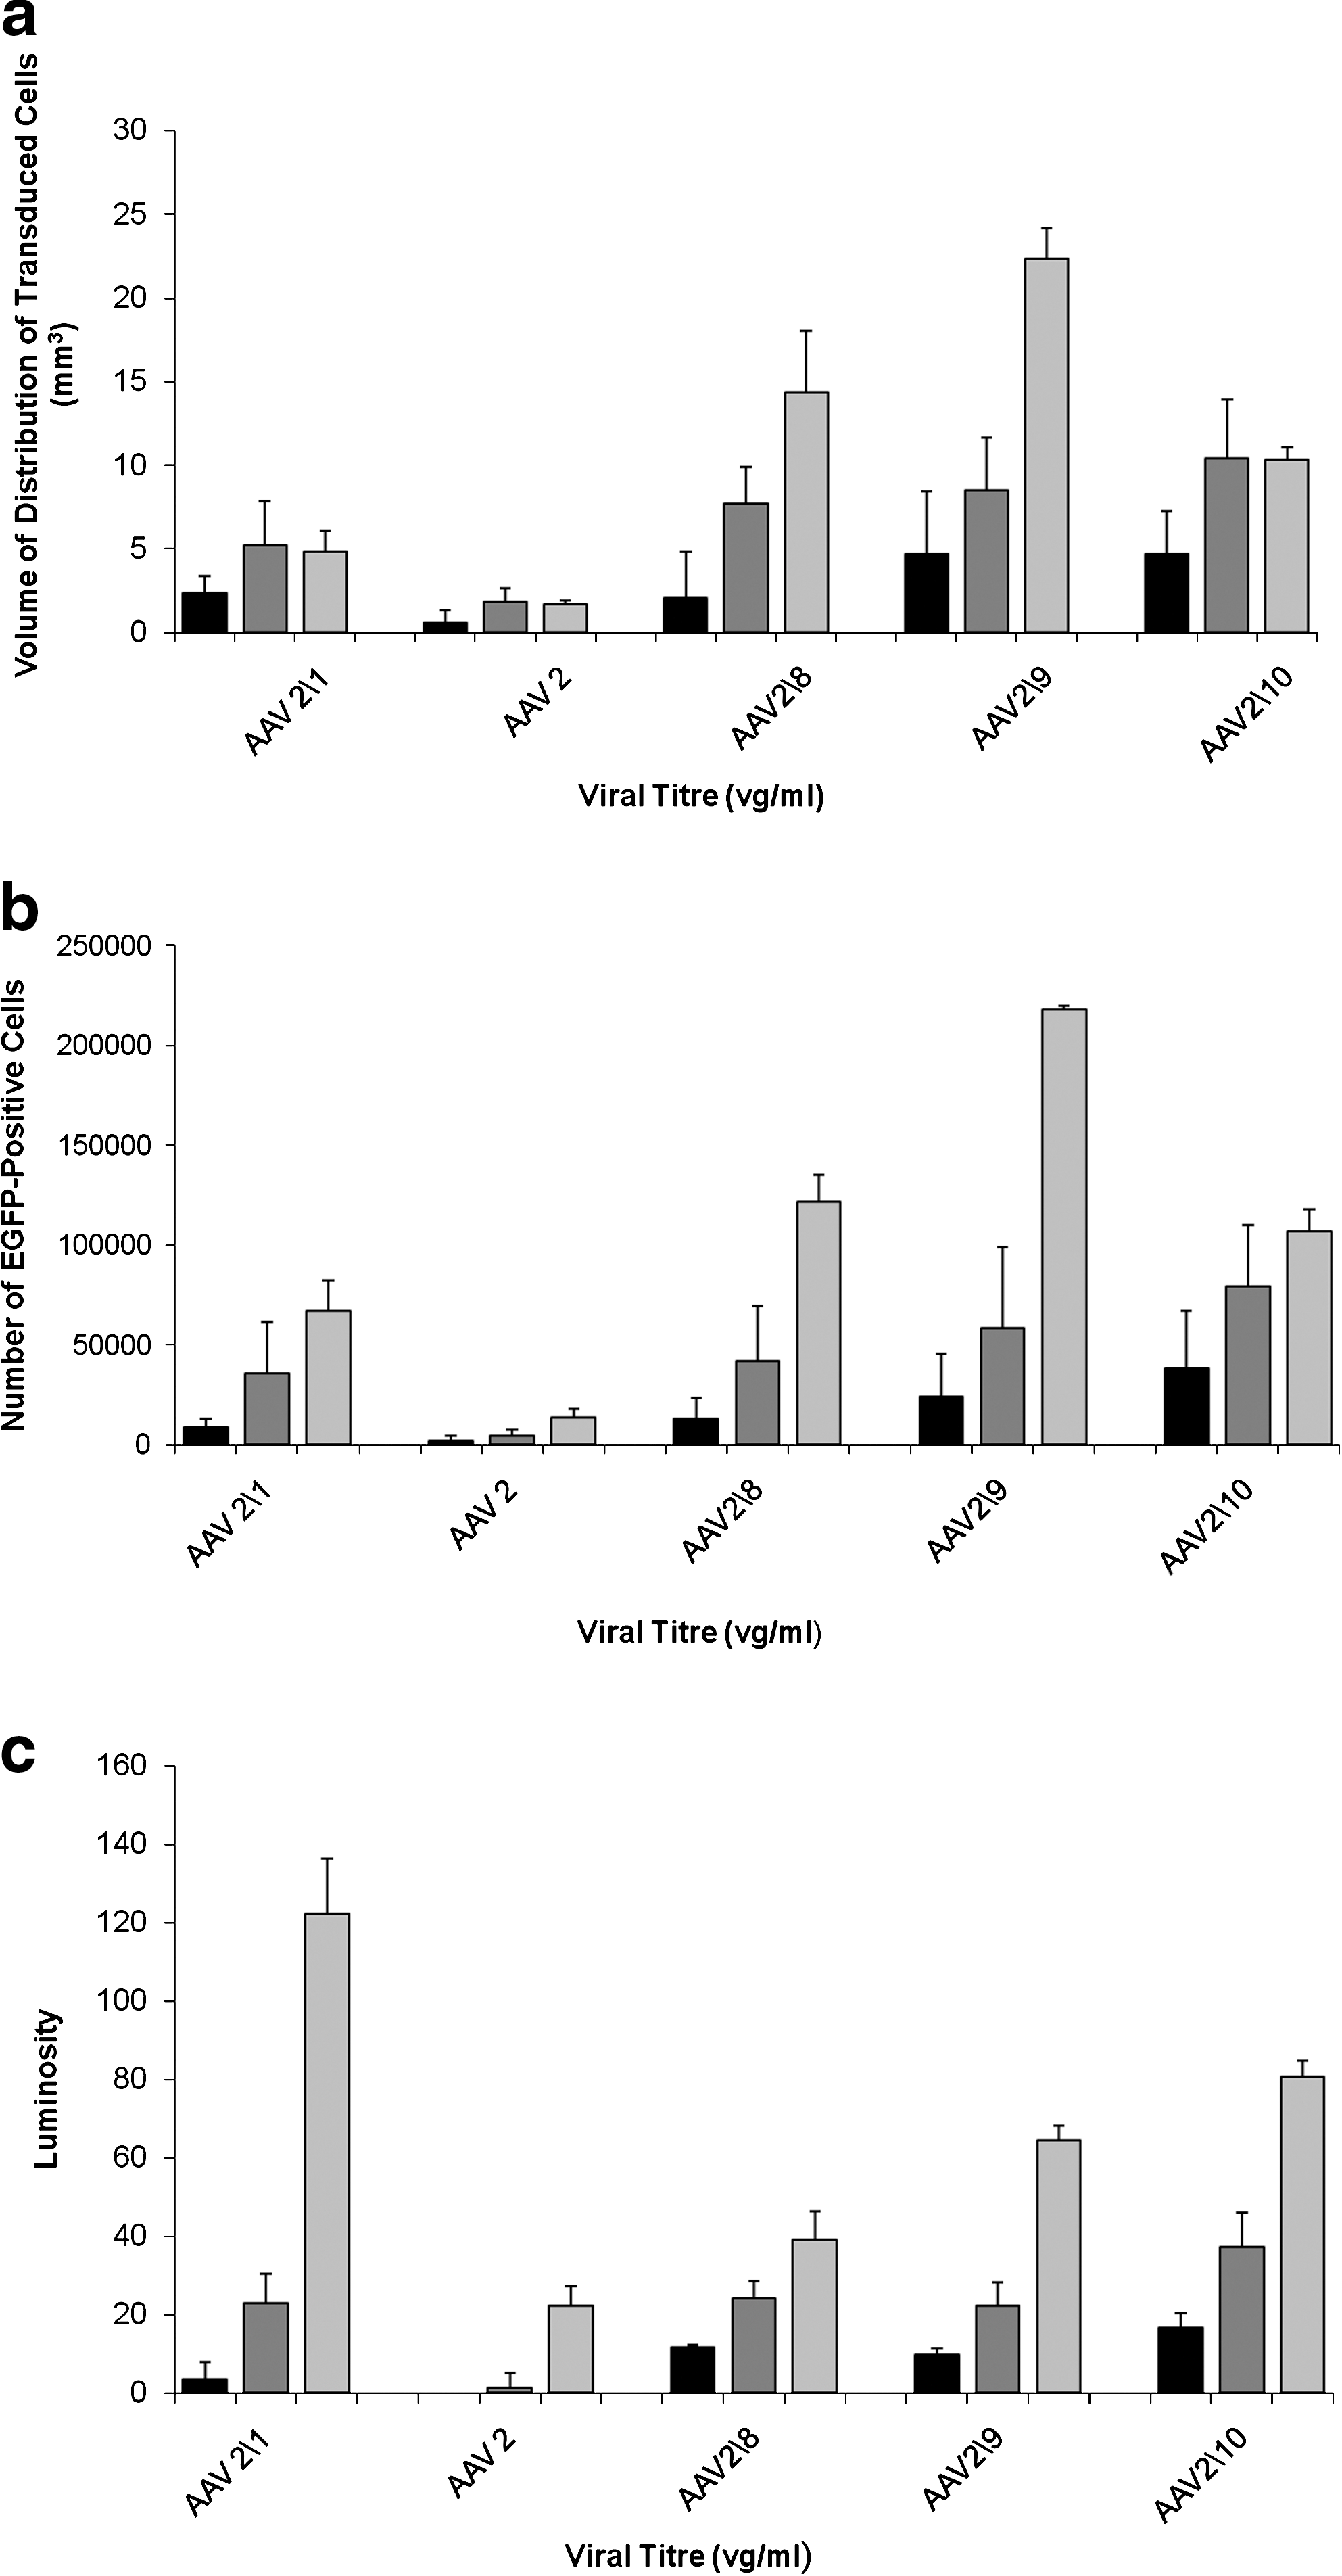
Relationship between infused titer and measurements of rAAV distribution. There were clear differences in the number and volume of distribution of transduced cells between serotypes and at different infusions titers. The (
p < 0.05, ** p < 0.01, *** p < 0.001 compared with serotype at the equivalent titer; by paired two-sample t test assuming equal variance.
NS, not significant.
p < 0.05, ** p < 0.01, *** p < 0.001 compared with serotype at the equivalent titer by paired two-sample t test assuming equal variance.
NS, not significant.
When the infused titer was increased to 1012 vg/ml the volume of distribution of transduced cells was significantly greater for serotypes 2/1, 2/rh8, 2/9, and 2/rh10 compared with serotype 2/2 (p = 0.007, < 0.001, < 0.001, and < 0.001, respectively) (Fig. 2a and Table 2). The volume of distribution was also greater for serotypes 2/rh8, 2/9, and 2/rh10 compared with serotype 2/1 (p = 0.049, 0.039, and 0.008, respectively) (Fig. 2a and Table 2). At this titer there was no statistically significant difference in the volume of distribution of transduced cells between serotypes 2/rh8 and 2/9 (p = 0.32), 2/rh8 and 2/rh10 (p = 0.07), and 2/9 and 2/rh10 (p = 0.18) (Fig. 2a and Table 2). In terms of the number of transduced cells, serotypes 2/1, 2/rh8, 2/9, and 2/rh10 transduced more cells than serotype 2/2 (p = 0.007, 0.004, 0.004, and < 0.001, respectively) (Fig. 2b and Table 3). Serotype 2/rh10 infected more cells than serotypes 2/1 (p = 0.011) and 2/rh8 (p = 0.025) (Fig. 2b and Table 3). There was no statistically significant difference in the number of cells transduced between serotypes 2/rh8 and 2/9 (p = 0.21) or between 2/9 and 2/rh10 (p = 0.17) (Fig. 2b and Table 3).
It is interesting that when the infusion concentrations were increased from 1012 vg/ml to 1013 vg/ml, no statistically significant increase in the volume of distribution of transduced cells was observed for rAAV serotypes 2/1 (p = 0.42), 2/2 (p = 0.41), or 2/rh10 (p = 0.49), whereas for serotypes 2/rh8 and 2/9 a very large increase in the volume of distribution of transduced cells was observed (p = 0.001 and < 0.001, respectively) (Fig. 2a and Table 2). In contrast, when the infused concentration was increased to 1013 vg/ml the number of transduced cells increased significantly for all serotypes except 2/rh10 (p = 0.09): 2/1, p = 0.047; 2/2, p = 0.004; 2/8, p = 0.001; 2/9, p < 0.001 (Fig. 2b and Table 3). At this concentration there were significant differences in volume of distribution and total number of transduced cells between serotypes. Specifically, the volume of distribution of transduced cells was significantly greater for serotype 2/9 than 2/rh10 (p < 0.001) or 2/rh8 (p = 0.014). The distribution of transduced cells for serotypes 2/rh10 and 2/rh8 was significantly greater than for serotype 2/1 (p = 0.001 and 0.007, respectively), which transduced cells over a greater volume than serotype 2/2 (p = 0.006) (Fig. 2a and Table 2). There was no significant difference in the volume of distribution of transduced cells between serotypes 2/rh8 and 2/rh10 at this titer (p = 0.07). For the number of transduced cells by each serotype at this titer, a similar relationship was observed in that serotype 2/9 transduced significantly more cells than serotypes 2/rh8 and 2/rh10 (p < 0.001). Serotypes 2/rh8 and 2/rh10 transduced more cells than serotype 2/1 (p = 0.005 and 0.01, respectively), and serotype 2/1 transduced more cells than serotype 2/2 (p = 0.002). There was no significant difference in the number of cells transduced by serotypes 2/rh8 and 2/rh10 at this titer (p = 0.11). These results are summarized in Fig. 2b and Table 3.
In contrast, for all serotypes, increasing the infused titer from 1010 vg/ml to 1012 vg/ml and then 1013 vg/ml led to a statistically significant increase in the average luminosity of EGFP-positive areas of striatum (p < 0.01) in all cases except when the infused titer of serotype 2/2 was increased from 1010 vg/ml to 1012 vg/ml (p = 0.17). This suggested an increased MOI and/or density of transduced cells in the infused volume. These results are summarized in Fig. 2c and Table 4.
p < 0.01, *** p < 0.001 by paired two-sample t test assuming equal variance.
NS, not significant.
Assuming the volume fraction of the brain (ratio between extracellular space volume and the total tissue volume) is 20% in normal gray matter (Nicholson and Sykova, 1998), infusion by CED into the brain extracellular space should lead to a maximum volume of distribution of five times the infusion volume, assuming infusate distribution occurs only by bulk flow. As 2.5 μl of vector was infused into each striatum, the volume of distribution should not have exceeded 12.5 mm3. However, infusions of 1013 vg/ml of rAAV2/rh8 and 2/9 led to vector distributions of 14.4 ± 3.7 mm3 and 22.4 ± 1.8 mm3, respectively, suggesting an additional mechanism for vector distribution.
Transductional tropism of rAAV (serotypes 2/1, 2/2, 2/rh8, 2/9, and 2/rh10) in rat striatum
Next, we assessed the number of neurons that were transduced with each of the rAAV serotypes. Immunostaining of representative tissue sections with the neuronal marker NeuN was performed on all brains. Co-localization of NeuN and EGFP was then assessed by stereology. Stereological counts performed on selected sections demonstrated that all rAAV serotypes transduced cells of a neuronal phenotype (Fig. 3). Serotypes 2/1, 2/2, 2/rh8, 2/9, and 2/rh10 gave rise to, respectively, 49.3 ± 18.7%, 67.8 ± 22.1%, 37.6 ± 8.5%, 58.8 ± 18.8%, and 30.1 ± 20.7% neurons out of the transduced cell population (data not shown).

Tropism of rAAV serotypes in rat striatum. Representative images show EGFP-expressing cells in the striatum for each serotype of rAAV tested (left panels), corresponding NeuN immunostaining (middle panels), and overlay (right panels). Scale bars: 100 μm. Color images available online at
Retrograde axonal transport of rAAV vectors
Because of the widespread distribution of EGFP-positive cells after infusions of rAAV, identifying axonal transport of vector was challenging. However, anterograde axonal transport of EGFP was routinely observed with infusions of rAAV2/1, 2/rh8, 2/9, and 2/rh10 vectors. As the infused vector concentration increased, the extent and fluorescent intensity of EGFP expression within neuronal processes increased. This routinely manifested as the presence of EGFP-positive neuronal processes in the cortex, globus pallidus, thalamus, and substantia nigra. There was also evidence of retrograde axonal transport of serotypes 2/rh8 and 2/9 at infusion titers of 1012 vg/ml and above as demonstrated by the presence of EGFP-positive cell bodies in the globus pallidus (Fig. 4a), hippocampus (Fig. 4b), thalamic nuclei (Fig. 4c), cortex (Fig. 4d), and substantia nigra pars compacta (Fig. 4e and f). No evidence of retrograde axonal transport of serotypes 2/1, 2/2, or 2/rh10 was observed at any titer.

Axonal transport of rAAV2/9 in rat brain. Fluorescent images from a rat infused with 1 × 10¹³ vg/ml rAAV2/9 show the presence of EGFP-positive cells in (
Immune cell infiltration following CED of rAAV into the rat striatum
Immunostaining of selected sections for the presence of the inflammatory cell markers ED1 (activated microglia; Fig. 5), CD4 (helper T cells), and CD8 (cytotoxic T cells; Fig. 5) demonstrated minimal tissue infiltration of inflammatory cells except along the course of the needle track, where there was a focal infiltration of both ED1-positive activated microglia and CD8-positive T cells. No CD4-positive T cells were observed on any tissue section. There was no detectable difference in the density of inflammatory cells between serotypes or when the infusion titer was increased from 1010 to 1013 vg/ml.
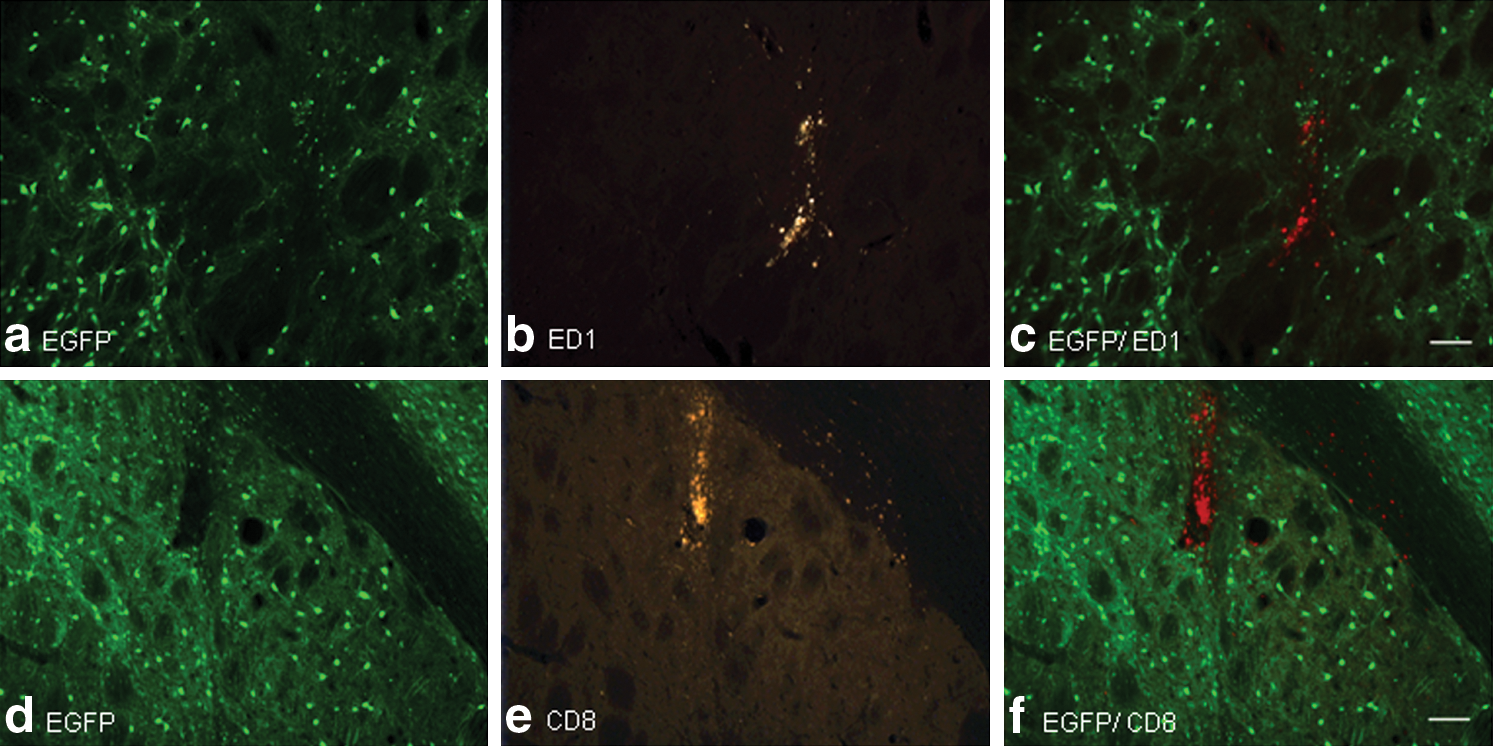
Immune cell infiltration into rAAV-infused rat striatum. Representative tissue sections of brain infused with 1 × 10¹³ vg/ml rAAV2/8 are shown. (
CED of rAAV serotypes in the striatum of pigs
Infusions of 120 μl of each serotype of rAAV were performed unilaterally into the striatum of pigs. Infusions were undertaken at a titer of 1011 vg/ml on account of the large volume infused and the need to maximize the experimental use of limited viral stocks. All catheters were accurately inserted into the striatum, based on T2-weighted MRI. Extensive cell transduction was observed with serotype 2/rh8 and to a lesser extent serotype 2/1, filling a large proportion of the striatum. Significantly less cell transduction was observed with infusions of serotype 2/9. Cell transduction with serotype 2/rh10 was comparatively poor. No transduction was observed in the striatum infused with rAAV serotype 2/2, although small numbers of transduced cells were observed in the white matter, along the cannula track (Fig. 6). All infusions, including the infusion of rAAV2/2, but particularly in the case of rAAV2/9 (Fig. 6d), led to extensive transduction of cells in the perivascular spaces of vessels, particularly in the distribution of the lenticulostriate arteries (Fig. 7). No axonal transport of any vector serotype was observed in any of the infused pig brains.
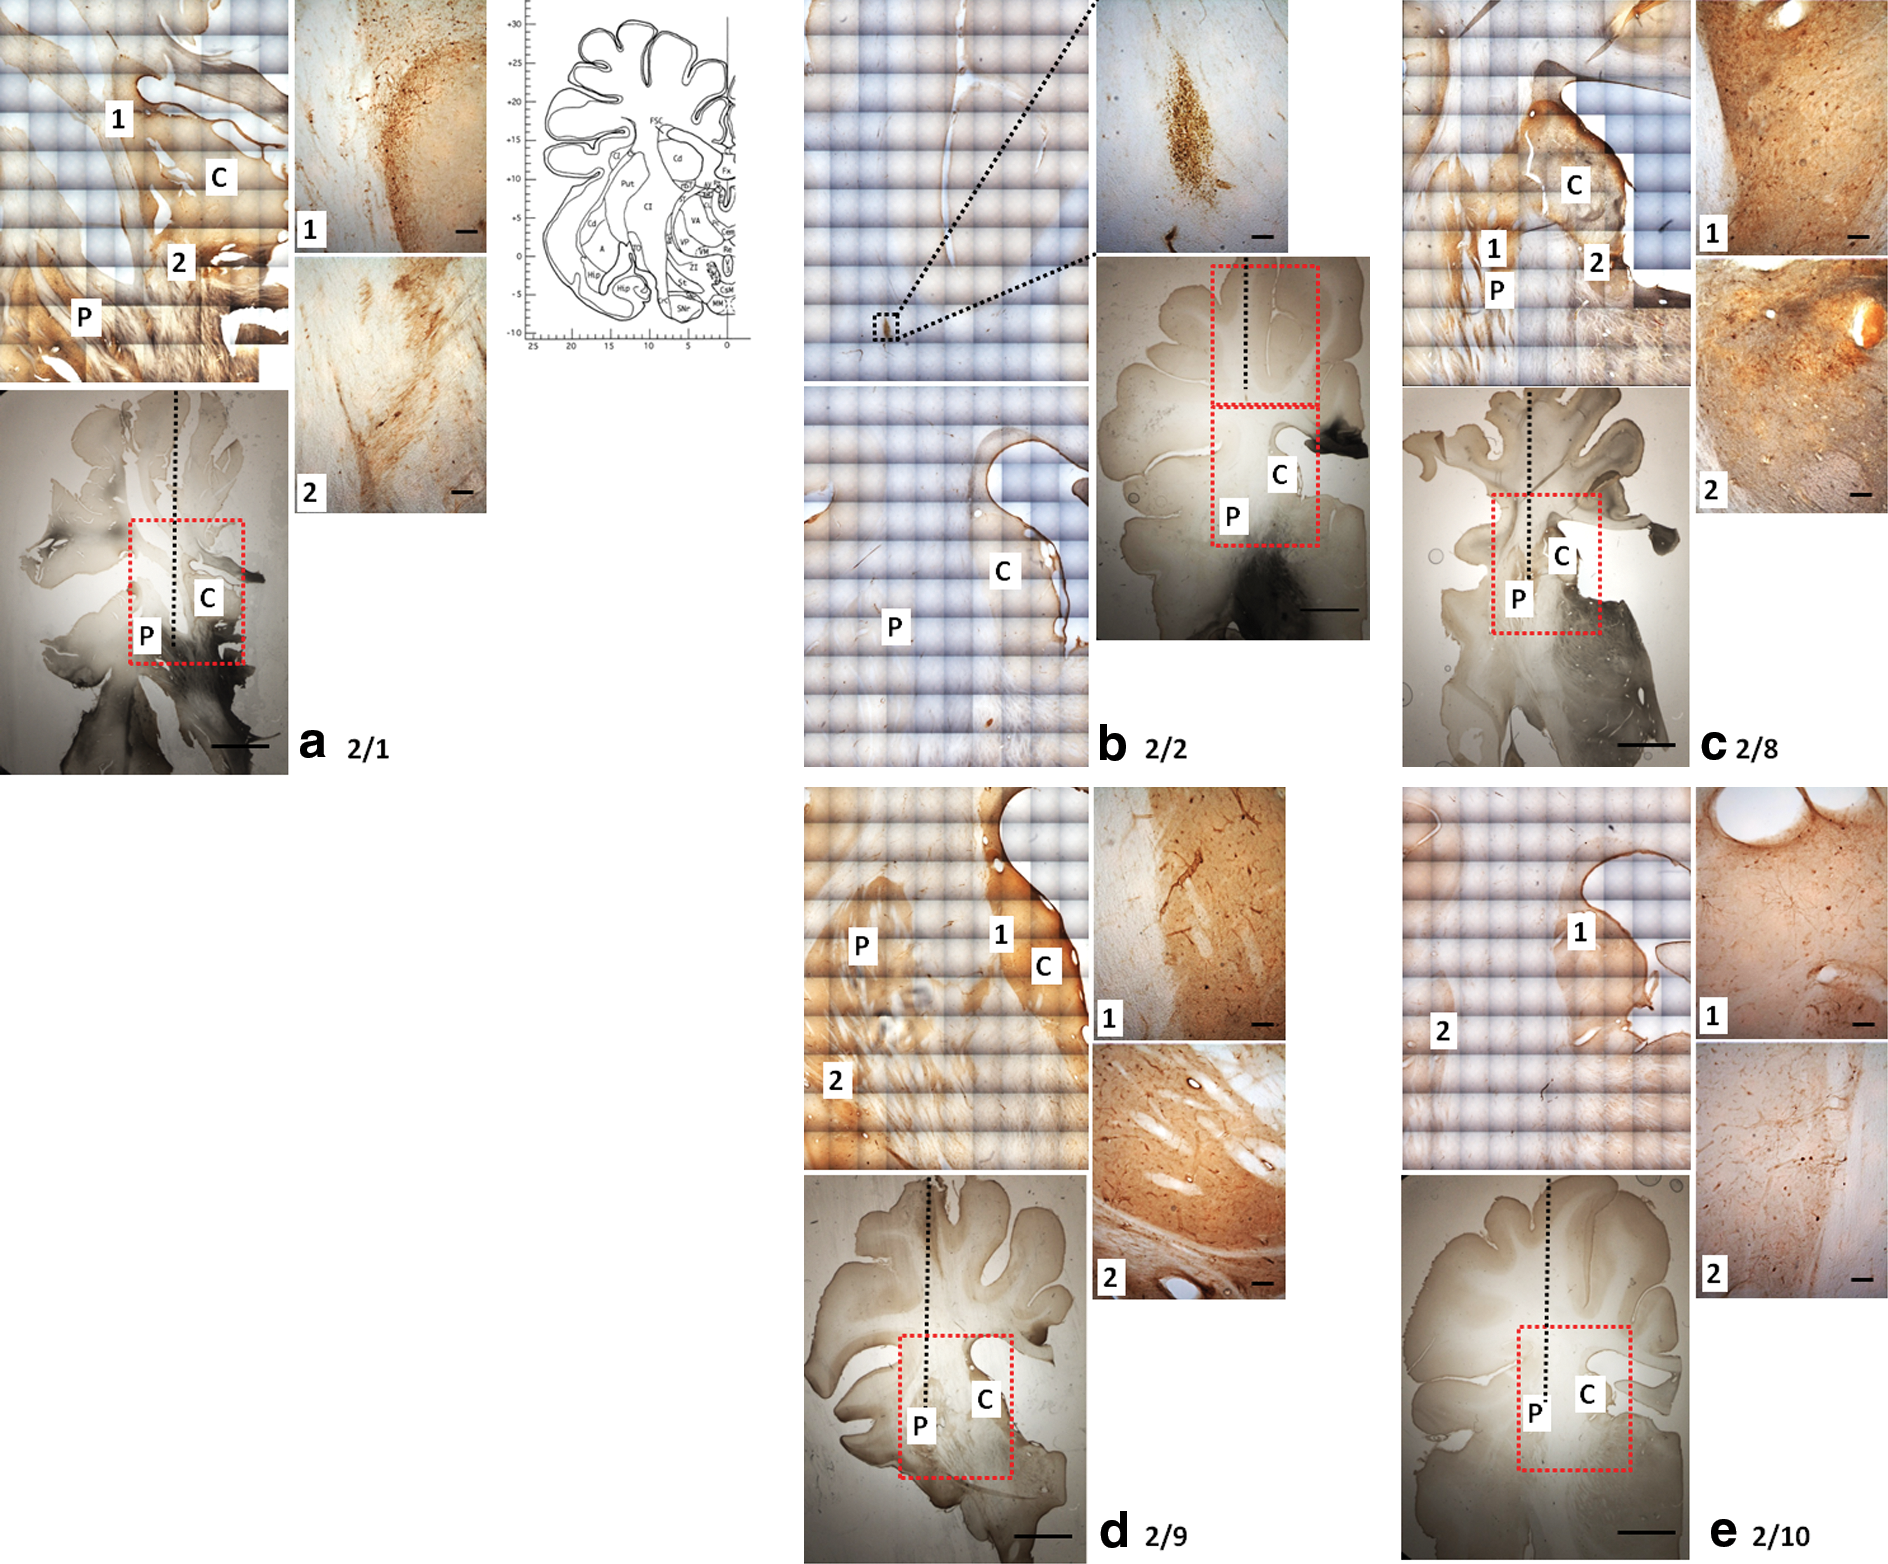
rAAV distribution in pig striata. Photomicrographs show areas of EGFP expression following infusions of rAAV serotypes into pig striatum (right panels are high-magnification images of black outlined boxes): (
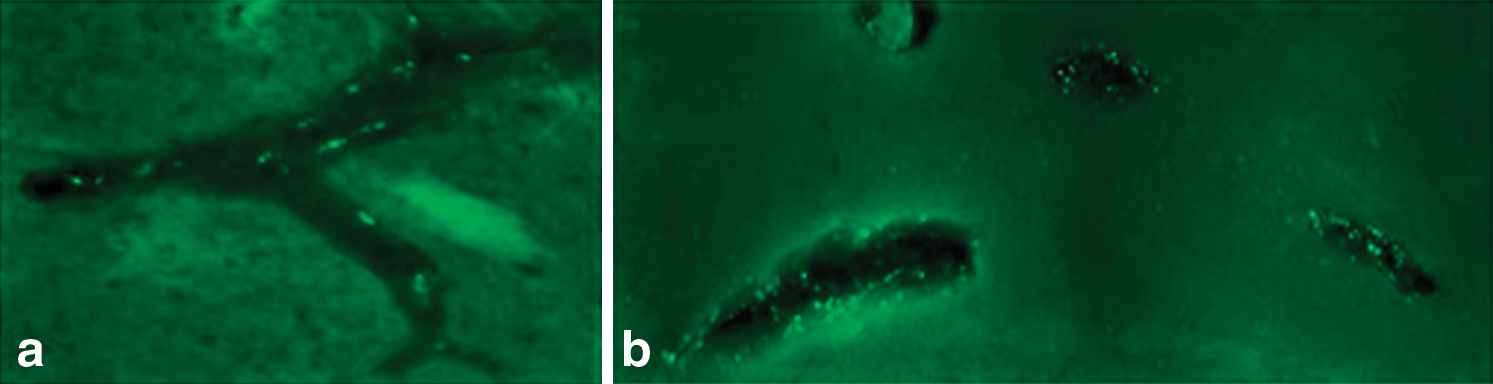
Perivascular transport of rAAV. Fluorescent images show EGFP-expressing cells within the perivascular space of (
Transductional tropism of rAAV (serotypes 2/1, 2/rh8, 2/9, and 2/rh10) in pig striatum
Immunostaining of representative tissue sections with the neuronal marker NeuN was performed on all brains. It was not possible to perform stereological counts to assess the number of transduced cells or assess the volume of distribution because of the widespread distribution observed with these large volume infusions, the difficulty in visualizing transduced cells in tissue sections as thick as 100 μm, and the inherent difficulty of distinguishing transduction of cells in the striatum from transduction of cells located in the intermingled white matter tracts. However, careful examination of representative tissue sections demonstrated that the majority of transduced cells in the striatum were neuronal (Fig. 8).
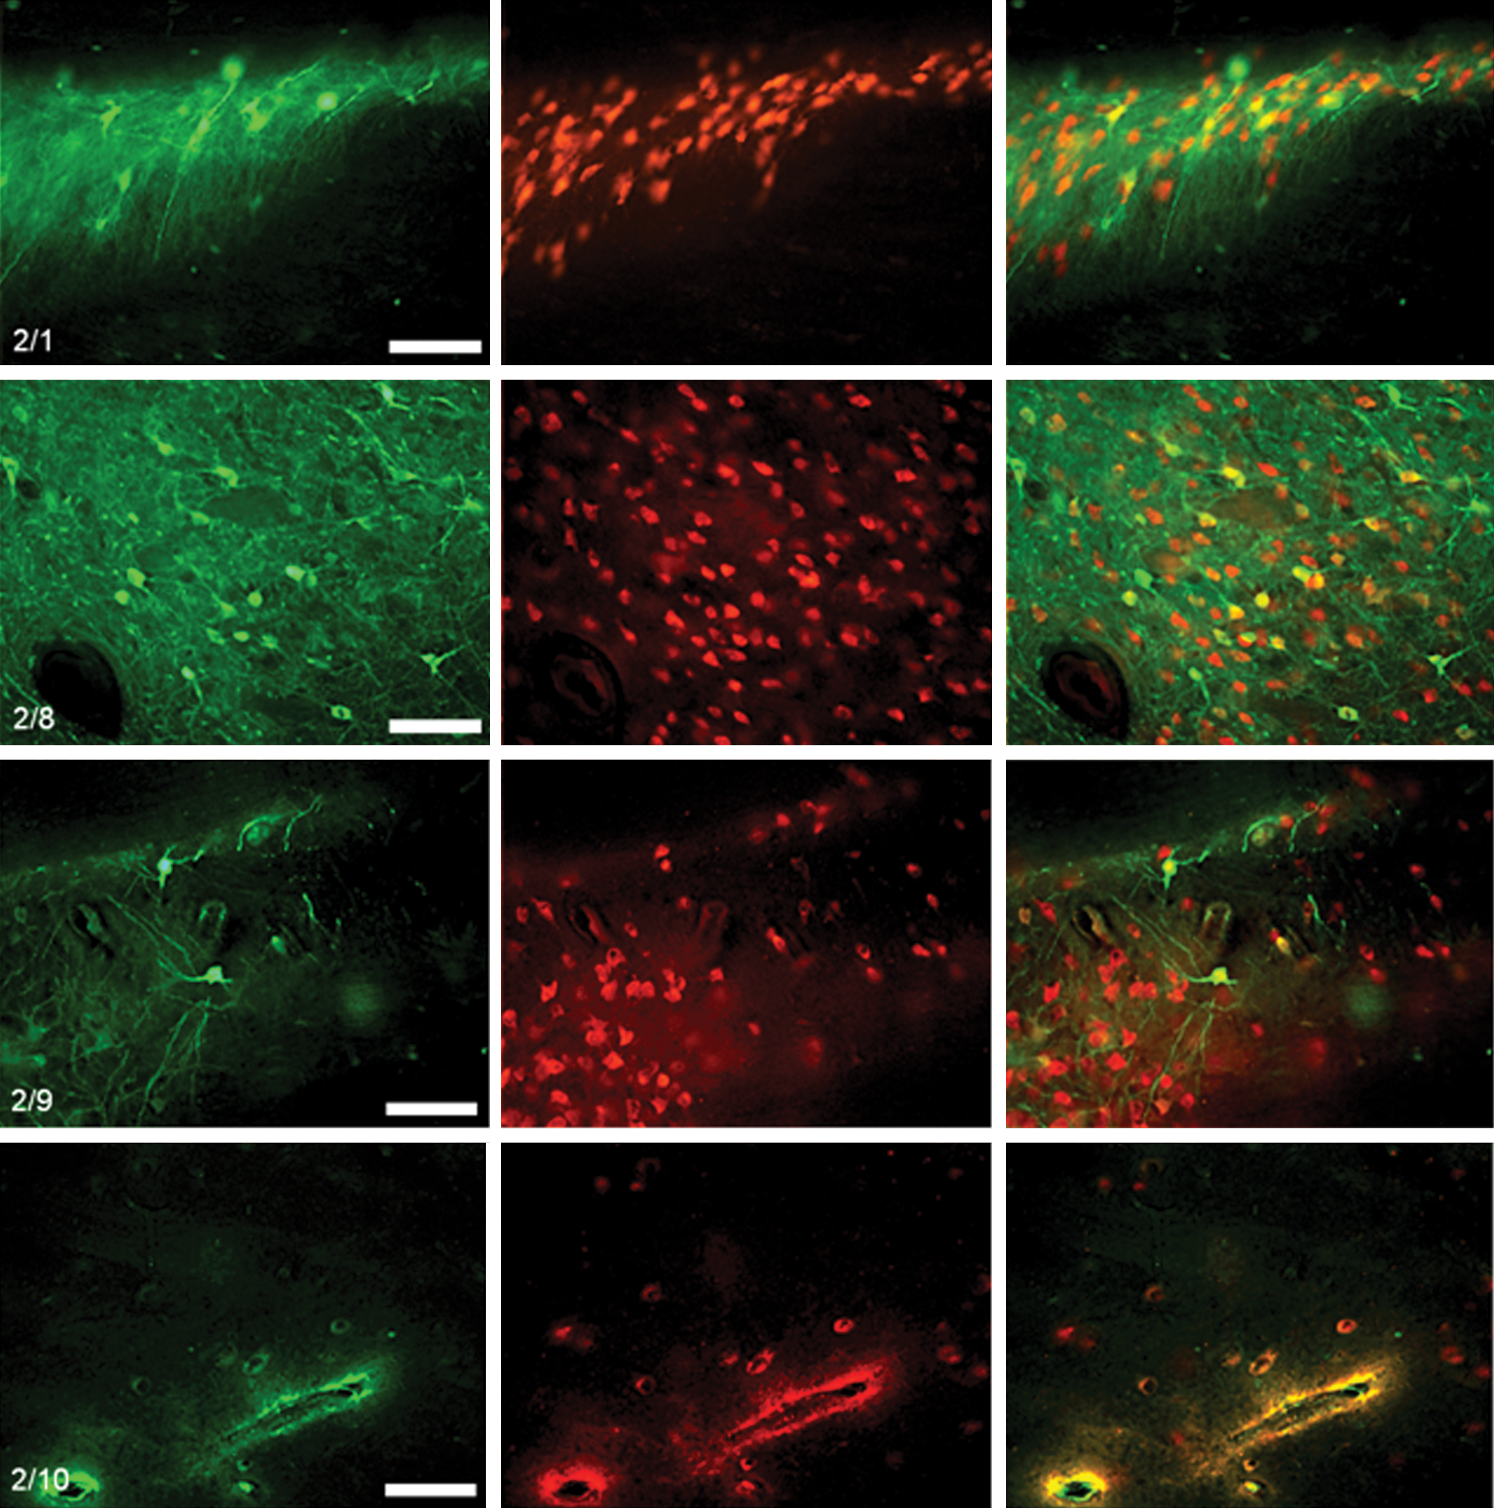
Tropism of rAAV serotypes in pig striatum. Representative images show (left panels) EGFP-expressing cells in the striatum following infusions of rAAV serotypes 2/1, 2/8, 2/9, and 2/rh10, (middle panels) corresponding NeuN immunostaining, and (right panels) overlay. Although difficult to accurately quantify with fluorescent imaging because of the extensive vector distribution and difficulty differentiating the closely interrelated gray and white matter in the vicinity of the striatum, the majority of transduced cells were neuronal in all cases. No cell transduction was observed in the striatum following infusions of rAAV serotype 2/2. Scale bars: 100 μm. Color images available online at
Discussion
Gene therapy vectors based on AAV are well-situated vehicles for in vivo delivery of therapeutic transgenes, particularly for the treatment of neurodegenerative diseases. This study was designed to evaluate the relationships among the infusion flow rate, infusion volume, and infused titer on the volume of distribution of cell transduction for rAAV serotypes 2/1, 2/2, 2/rh8, 2/9, and 2/rh10 following administration into the brain by CED. The principal aim of this study was to provide guidance to clinicians on vector dosing and serotype selection in future clinical trials. In particular, we were keen to obtain information on vector dosing to facilitate a clinical trial using rAAV-mediated gene therapy, delivered by CED, to treat patients with Tay–Sachs disease and Parkinson's disease. Indeed, to date there have been no studies systematically examining the relationships between these variables and the distribution of cell transduction following CED. In particular, to achieve optimal vector delivery in clinical practice and therefore maximize the likelihood of efficacy being observed, several key questions must be addressed: (1) What is the maximal infusion rate that can be safely used that will allow adequate vector distribution in the shortest period of time? (2) What infusion volume is necessary to allow vector distribution over the required target structure? (3) What is the relationship between the infused vector titer and the number and volume of distribution of transduced cells as well as the occurrence of axonal transport? (4) Does vector delivery lead to infiltration of inflammatory cells in the brain?
Despite the standardized infusion parameters, equipment, and stereotactic coordinates used in the rat infusions, the wide variability in vector distribution between infusions was a striking observation. Hypothetically, the extensive transduction of cells in the perivascular spaces observed following intrastriatal infusions in pig brain implies that there may have been extensive passage of vector through the perivascular spaces around the infusion site. Indeed, Hadaczek et al. (2006b) previously identified flow in the perivascular space as being critical in mediating the distribution of AAV2 following CED into the rat striatum. As such, the three-dimensional relationship between the cannula tip, with an outer diameter of just 220 μm, and vessels with diameters as large as 1–2 mm is likely to critically determine the extent of vector distribution through the brain. As these vessels are concentrated around the highly vascular striatum, this effect would explain the significant variability observed with vector infusions in rat brain and raises concerns with regard to the feasibility of undertaking infusions over predictable volumes of brain in clinical practice.
From a practical perspective, it was, however, encouraging that vector distribution could be achieved efficiently at flow rates as rapid as 5 μl/min without evidence of excessive vector reflux into the white matter or cortex or tissue damage at the cannula tip. We chose flow rates (0.5 μl/min for 5 min, 1 μl/min for 5 min, 2.5 μl/min for 5 min, and then 5 μl/min for 20 min) that are higher than others published (Sanftner et al., 2005; Hadaczek et al., 2006b). Previously, we have shown that high infusion rates such as 5 μl/min can fill large volumes of gray and white matter provided a 0.22-mm outer diameter cannula is used (authors' unpublished data). Indeed, to adequately infuse vector into a target structure as large as the human putamen, which has a volume as large as 8,170 mm3 (Bonneville et al., 2005), significant infusion volumes would be required. For example, assuming a volume of infusion to volume of distribution ratio of 1:5 (based on an extracellular volume fraction of 0.2), it would be necessary to infuse a volume of 1.6 ml to fill the human putamen. Assuming two catheters were implanted within each putamen this would necessitate an infusion lasting just 2 hr 40 min. As such, the use of rapid infusion parameters is an essential prerequisite for undertaking infusions of adequate volumes of vector, particularly as with current technology, infusions would probably need to be undertaken in surgery with the patient under general anesthesia.
Although CED is capable of achieving widespread distribution of viral vectors in the brain (Chen et al., 1999; Cunningham et al., 2000, 2008; Hadaczek et al., 2006a,b, 2009), it is critical that controlled and predictable vector distribution is achieved for specific disease processes. For example, to treat Parkinson's disease it would be desirable to achieve targeted transgene delivery to the post-commissural putamen and subthalamic region without extensive axonal transport of vector or transgene product to distant sites in the brain, which could lead to adverse effects. In contrast, the treatment of genetic conditions such as lysosomal storage diseases would necessitate adequate delivery of therapeutic transgene products to sites throughout the central nervous system. In addition, it is essential to consider the target cell population for cell transduction. For example, in neurodegenerative disease processes, neuronal transduction would be desirable, whereas in inflammatory conditions such as multiple sclerosis, glial cell transduction may be preferable.
This dose-ranging study was performed for a number of clinically important reasons. First, it was hypothesized that as the infused vector concentration was increased, the number and volume of distribution of transduced cells would increase proportionally. However, it would be logical that this effect would plateau when no further vector distribution could be achieved for a given infusion volume, although the density of transduced cells and MOI of transduced cells within this volume would be expected to continue to rise. Determining the minimum vector concentration necessary to administer in clinical practice to achieve the maximal volume of distribution of transduced cells would represent a valuable starting point in planning a dose-escalation study of AAV-mediated gene therapy in clinical practice. In addition, there is some evidence that the occurrence of retrograde axonal transport of rAAV vectors is dependent on the infused vector concentration (Kaspar et al., 2003). Identifying the relationship between the infused vector titer and the occurrence of retrograde axonal transport for different serotypes of AAV has significant clinical value, particularly when localized or more global transgene expression is required to obtain therapeutic efficacy.
Increasing the infused viral titer from 1010 to 1012 vg/ml led to a significant increase in the total number of transduced cells and the volume of distribution of transduced cells for all rAAV serotypes tested. This result closely correlated with the results of Taymans et al. (2007), who undertook a similar dose-finding study for rAAV serotypes 2/5, 2/7, and 2/8 using a maximum infusion titer of 2.2 × 10¹² vg/ml. However, for serotypes 2/1, 2/2, and 2/rh10, when the infusion titer was increased further to 1013 vg/ml, no evidence of greater vector distribution was observed, although the number of transduced cells increased as did the intensity of fluorescence in the infused volume, suggesting an increase in the density and MOI of transduced cells. In contrast, the distribution of rAAV2/rh8 and 2/9 continued to rise when the infused vector titer was increased to 1013 vg/ml. It is important that this distribution of transduced cells exceeded the theoretical maximum achievable volume of distribution by CED. In view of an infusion volume of 2.5 μl and the known extracellular volume fraction of 20% (Nicholson and Sykova, 1998), the maximum achievable volume of distribution by CED in isolation (i.e., excluding vector diffusion and axonal transport) would be 12.5 mm3. However, the mean distribution of rAAV-mediated cell transduction at this high titer was 14.4 ± 3.7 mm3 and 22.4 ± 1.8 mm3 for rAAV2/rh8 and 2/9, respectively, implying additional mechanisms of vector distribution or, less likely, that this estimate of the extracellular fraction is incorrect.
Careful examination of rat tissue sections confirmed the presence of anterograde axonal transport of EGFP for serotypes 2/1, 2/rh8, 2/9, and 2/rh10 as evidenced by EGFP-positive neuronal processes in the globus pallidus, cortex, thalamus, hippocampus, and substantia nigra. Anterograde transport of EGFP simply represents EGFP diffusion from the cell body, along the axon. As such, the extent of EGFP expression within neuronal processes is determined by the amount of EGFP produced in the cell. This in turn is a function of the efficiency of vector-mediated cell transduction. As such, the absence of EGFP-positive neuronal processes following infusions of rAAV2/2 is probably related to the comparatively poor transduction efficiency observed with this serotype.
In addition to the observed anterograde transport of EGFP, there was evidence of retrograde axonal transport of serotypes 2/rh8 and 2/9, particularly when the infused vector concentration exceeded 1012 vg/ml. This effect probably accounted for the distribution of these vectors beyond the theoretical maximum volume of distribution achievable just by CED. This was evidenced by the presence of EGFP-positive neuronal cell bodies in the hippocampus, globus pallidus, thalamic nuclei, and substantia nigra pars compacta, which have projections from the putamen. In view of the extensive distribution of these serotypes by CED, it is also feasible that there was direct spread of vector from the striatum into the adjacent globus pallidus, with possible retrograde transport of vector back into the striatum. Regardless of the mechanism of transduction responsible for neuronal transduction in the globus pallidus, it was difficult to reliably distinguish between cell transduction in these two structures histologically. As such, the observation that rAAV2/rh8 and 2/9 led to a volume of distribution of cell transduction exceeding the theoretical maximum distribution achievable by CED probably relates to inadvertent inclusion of transduced cells in the globus pallidus in these measurements.
In contrast to the number and volume of distribution of transduced cells observed following the administration of each serotype into the striatum of rats, in pig brain, serotype 2/rh8 clearly demonstrated the greatest level and distribution of cell transduction, although striatal cell transduction was also observed for serotypes 2/1 and 2/9. Vector distribution and cell transduction with serotype 2/rh10 was comparatively poor. Like with the results of the rat infusions, no rAAV2-mediated cell transduction was observed in the striatum.
To date several clinical trials of rAAV2-mediated gene therapy have been conducted in patients with Parkinson's disease (Kaplitt et al., 2007; Eberling et al., 2008; Marks et al., 2008), Canavan's disease (McPhee et al., 2006), and late infantile neuronal ceroid lipofuscinosis (Worgall et al., 2008), using infused vector concentrations between 1011 and 6.8 × 10¹² vg/ml. However, in this study, poor distribution of rAAV2 was observed at infusion concentrations of between 1010 and 1013 vg/ml. Furthermore, no intrastriatal cell transduction was observed within the striatum of a pig infused with a concentration of 1011 vg/ml. These findings reinforce previous observations demonstrating poor distribution of rAAV2 compared with other serotypes of AAV in mouse, rat, and cat brain (Davidson et al., 2000; Kirik et al., 2002; Passini et al., 2003; Vite et al., 2003; Wang et al., 2003; Burger et al., 2004; Taymans et al., 2007). Subsequently, several strategies have been developed to enhance the distribution of rAAV2 in the brain, including co-infusion with heparin (Nguyen et al., 2001) and mannitol (Mastakov et al., 2002a). Indeed, it may be beneficial to evaluate these coinfusion strategies in enhancing the distribution of the vector serotypes used in this study. In direct contrast to these findings, Hadaczek et al. (2006a) demonstrated that CED is able to mediate efficient distribution of rAAV2 in the striatum of primates at vector concentrations of 1.5–3.6 × 10¹¹ vg/ml. Furthermore, Kells et al. (2009) demonstrated efficient CED of rAAV2 in the primate thalamus and even retrograde axonal transport of rAAV2 along thalamo-cortical projections. However, in view of the extensive perivascular transport of rAAV vectors in this study, it is conceivable that transduced cells distant to the infusion site could be falsely attributed to axonal transport when vector actually reached these sites through perivascular spaces. The variability of these studies is difficult to explain, but reasons may include ratios of empty to full capsids (Parker et al., 2003; Sommer et al., 2003), levels of particle aggregation, or nonspecific binding to the inner aspects of the vial in which it is stored or the infusion device (Wright, 2008). Therefore, it is critical that the specific distribution properties of vector formulations and delivery devices that are to be used in clinical trials are thoroughly evaluated in further studies prior to use in patients.
A final encouraging observation of this study was the failure to elicit a pronounced infiltration of inflammatory cells into the brain, even when the infused vector titer was increased to 1013 vg/ml. This reinforces the observations of previous studies demonstrating very low immunogenicity of rAAV in the brain (Mastakov et al., 2002b), although these studies utilized much lower infused vector concentrations (a maximum of 1.4 × 10¹⁰ vg/ml). An important corollary to this is that these studies have typically been conducted in animals that have not previously been exposed to wild-type AAV2. This is an important consideration as between 18% and 70% of the population have antibodies to AAV2 (Chirmule et al., 1999; Erles et al., 1999; Moskalenko et al., 2000), and infusion of rAAV2 into the brains of animals with circulating antibodies against AAV2 has been shown to significantly reduce the transduction efficiency observed (Peden et al., 2004; Sanftner et al., 2004). In view of this finding and the significantly greater distribution of other serotypes of AAV in rat and pig brain, observed in this study, it seems logical to preferentially utilize these vector serotypes in clinical trials instead of rAAV2.
This study has extended the work of other investigators by systematically evaluating the effect of increasing the infused vector titer on the volume of distribution of transduced cells, the total number of transduced cells, and the infiltration of inflammatory cells into the brain. In conclusion, this study demonstrated that the rAAV vector serotypes 2/1, 2/rh8, and 2/rh10 can be efficiently distributed by CED at infusion rates as high as 5 μl/min, without eliciting a significant innate immune response. Careful use of these vectors and infusion parameters offers significant possibilities for the treatment of a range of neurodegenerative diseases such as Parkinson's disease. Infusions of rAAV2/2 led to poor distribution and low-level cell transduction. Retrograde axonal transport occurred with infusions of rAAV2/rh8 and 2/9 above a threshold vector infusion titer of 1012 vg/ml. It would be useful to determine whether this threshold effect also occurs in the brain of a large animal model, such as a pig. If indeed this were the case, clinicians could make use of the widespread axonal transport of the vectors by CED in the treatment of Tay–Sachs disease. In addition, the excellent cell transduction that we have shown with rAAV2/1, 2/8, and 2/10 after injection into the striatum makes these vectors potential candidates for targeted gene expression to the striatum or substantia nigra for Parkinson's disease patients.
Footnotes
Acknowledgments
The authors acknowledge the financial assistance of the Medical Research Council, the Cure Parkinson's Trust, and the Friends of the Bristol Oncology and Haematology Centre. We kindly acknowledge the support of Roy Harris for his engineering expertise.
Author Disclosure Statement
E.W., A.B., M.S.-E., H.T., C.B., E.C., and S.G. have read the manuscript and have approved the work published here and confirm that there are no conflicts of interest and no competing financial interests.