




Abstract
Cardiac gene transfer for the treatment of ischemic diseases has suffered from low gene transfer efficiency and inability to target treatment genes to the ischemic myocardium. A combined method has been developed based on electromechanical mapping and radiowater PET imaging to target gene therapy to viable but ischemic and hibernating areas of the myocardium. Electromechanical NOGA mapping produces three-dimensional images of myocardium with both an electric activity map and a myocardial contractility map. These have been converted to 17-segment 2D bull's-eye maps, which were superimposed onto PET radiowater perfusion imaging maps of the myocardium. This technique was applied in a Phase I/IIa clinical trial to target gene therapy for refractory angina patients. It was found that by combining electromechanical map with PET imaging, targeting of gene therapy to hibernating ischemic myocardium can be significantly improved. Here, the methods for the identification of viable, ischemic, and hibernating myocardium for gene transfer are described, and examples of treated refractory angina patients who have benefited from the improved gene transfer method to the ischemic myocardium are presented.
Introduction
C
Gene therapy is considered a potential new treatment for refractory angina patients. Promising results has been published in animal studies using angiogenic growth factors. Adenoviral VEGF-DΔNΔC (AdVEGF-DΔNΔC) delivered intramyocardially has increased myocardial perfusion in the porcine heart. 2 VEGF-DΔNΔC gene therapy has also been shown to increase angiogenesis in rat and rabbit muscles. 3,4
One of the most critical issues in gene therapy trials has been low gene transfer efficiency in the target tissues. Also, identification of the myocardial region with exercise-induced ischemia causing angina pectoris and location of the site for optimal gene injections have been challenging. Single photon emission computed tomography has been commonly used in previous CAD gene therapy trials for assessment of regional perfusion in CAD. 5 –7 However, it has only reduced sensitivity to assess perfusion in patients with refractory angina. 15 O-water positron emission tomography (PET) is a standardized method to evaluate myocardial perfusion in CAD patients, 8 and it can be used to assess perfusion in patients with left main disease, three-vessel disease, or history of bypass operation. Therefore, it is ideal to guide the selection of optimal sites for gene injections. In addition, endocardial electroanatomical mapping with the NOGA® system has been shown to be a useful method to target endocardial gene therapy. 9 This study combined both 15 O-water-PET and NOGA® mapping to identify optimal sites for local, targeted gene therapy and to assess changes in regional myocardial perfusion after the gene therapy.
Materials and Methods
Patient selection
Thirty patients (M age = 70 ± 6 years) with CAD and refractory angina (CCS II–III class) were recruited and randomized 4:1 to the AdVEFG-DΔNΔC treatment group (AdVEGF-D group) or placebo (control group). The study was performed in Kuopio and Turku University Hospitals, and was approved by the local Ethics Committees and Finnish Medicines Agency. All patients signed informed consent.
Inclusion and exclusion criteria
Patients (aged 30–80 years) were included if they had: (1) signed informed consent; (2) severe angina pectoris (CCS II–III) despite maximal medication; (3) angina pectoris or ischemic ST-depression (≥1 mm) in the exercise test; (4) significant stenoses in coronary angiography; (5) contraindications to coronary angioplasty or bypass operation (diffuse or distal stenosis, vessels with difficult anatomy, stenosis with severe calcifications, chronic total occlusion, stenosis in small vessels; <2.5 mm); and (6) LV wall >8 mm detected by transthoracic and transesophageal echocardiography (TTE; treatment area).
Exclusion criteria were type 1 diabetes mellitus (DM) or severe complicated type 2 DM (diabetic retinopathy or nephropathy), women of fertile age, clinically significant anemia (hemoglobin count <120 mg/L in males, <110 mg/L in females; hematocrit <0.36), leucopenia (b-leukocyte count <3.0 × 10⁹/L), leucocytosis (b-leucocyte count >12.0 × 10⁹/L), thrombocytopenia (b-thrombobyte count <100 × 109/L), renal insufficiency (s-creatinine >160 mg/L), liver insufficiency (p-alanine aminotransferase or p-alcaline phosphatase >2 × normal value), severe hypertension (systolic blood pressure >200 mmHg or diastolic blood pressure >110 mmHg), significant hypotension (systolic blood pressure <90 mmHg), significant impairment of left ventricular function (EF <25% in TTE), significant obesity (body mass index >35 kg/m2), acute infection, hematuria of unknown origin, and immunosuppressive medication.
Electroanatomic mapping
Electroanatomic mapping procedure has been described previously. 2 In brief, an 8.0F introducer sheath was inserted in the right femoral vein. Transseptal puncture was performed under fluoroscopic guidance using a transseptal needle, and a steerable introducer catheter (St Jude Medical™, St Paul, MN) was introduced into the left atrium. A NOGA® electroanatomical mapping and injection catheter (Cordis Corp., Johnson & Johnson, Miami Lakes, FL) was introduced into the left ventricle via the transseptal sheat. An external reference patch containing tip sensors was placed on the patient's back behind the heart. Information from the tip sensors provides the position and heading of the catheter inside the heart. The left ventricle was mapped with approximately 100 points to create maps of myocardial viability (voltage map) and contractility (local linear shortening map [LLS map]). The catheter measures local voltage produced by the myocardium. On a unipolar voltage map, local activity >15 mV is considered normal and viable myocardium, 5–15 mV as an infarct border zone, and <5 mV as a non-viable infarcted scar. LLS measures the local contractility of myocardium. LLS >6% is considered a normal contraction, LLS <6% a reduced contraction, and LLS <2% a paradoxical contraction. Unipolar and bipolar voltage maps as well as LLS maps are displayed as three-dimensional color maps of the left ventricle (Fig. 1A–D). In addition, the three-dimensional maps were converted to two-dimensional bull's-eye maps with 17 segments identical to the segments of PET mapping (Fig. 1E and F).
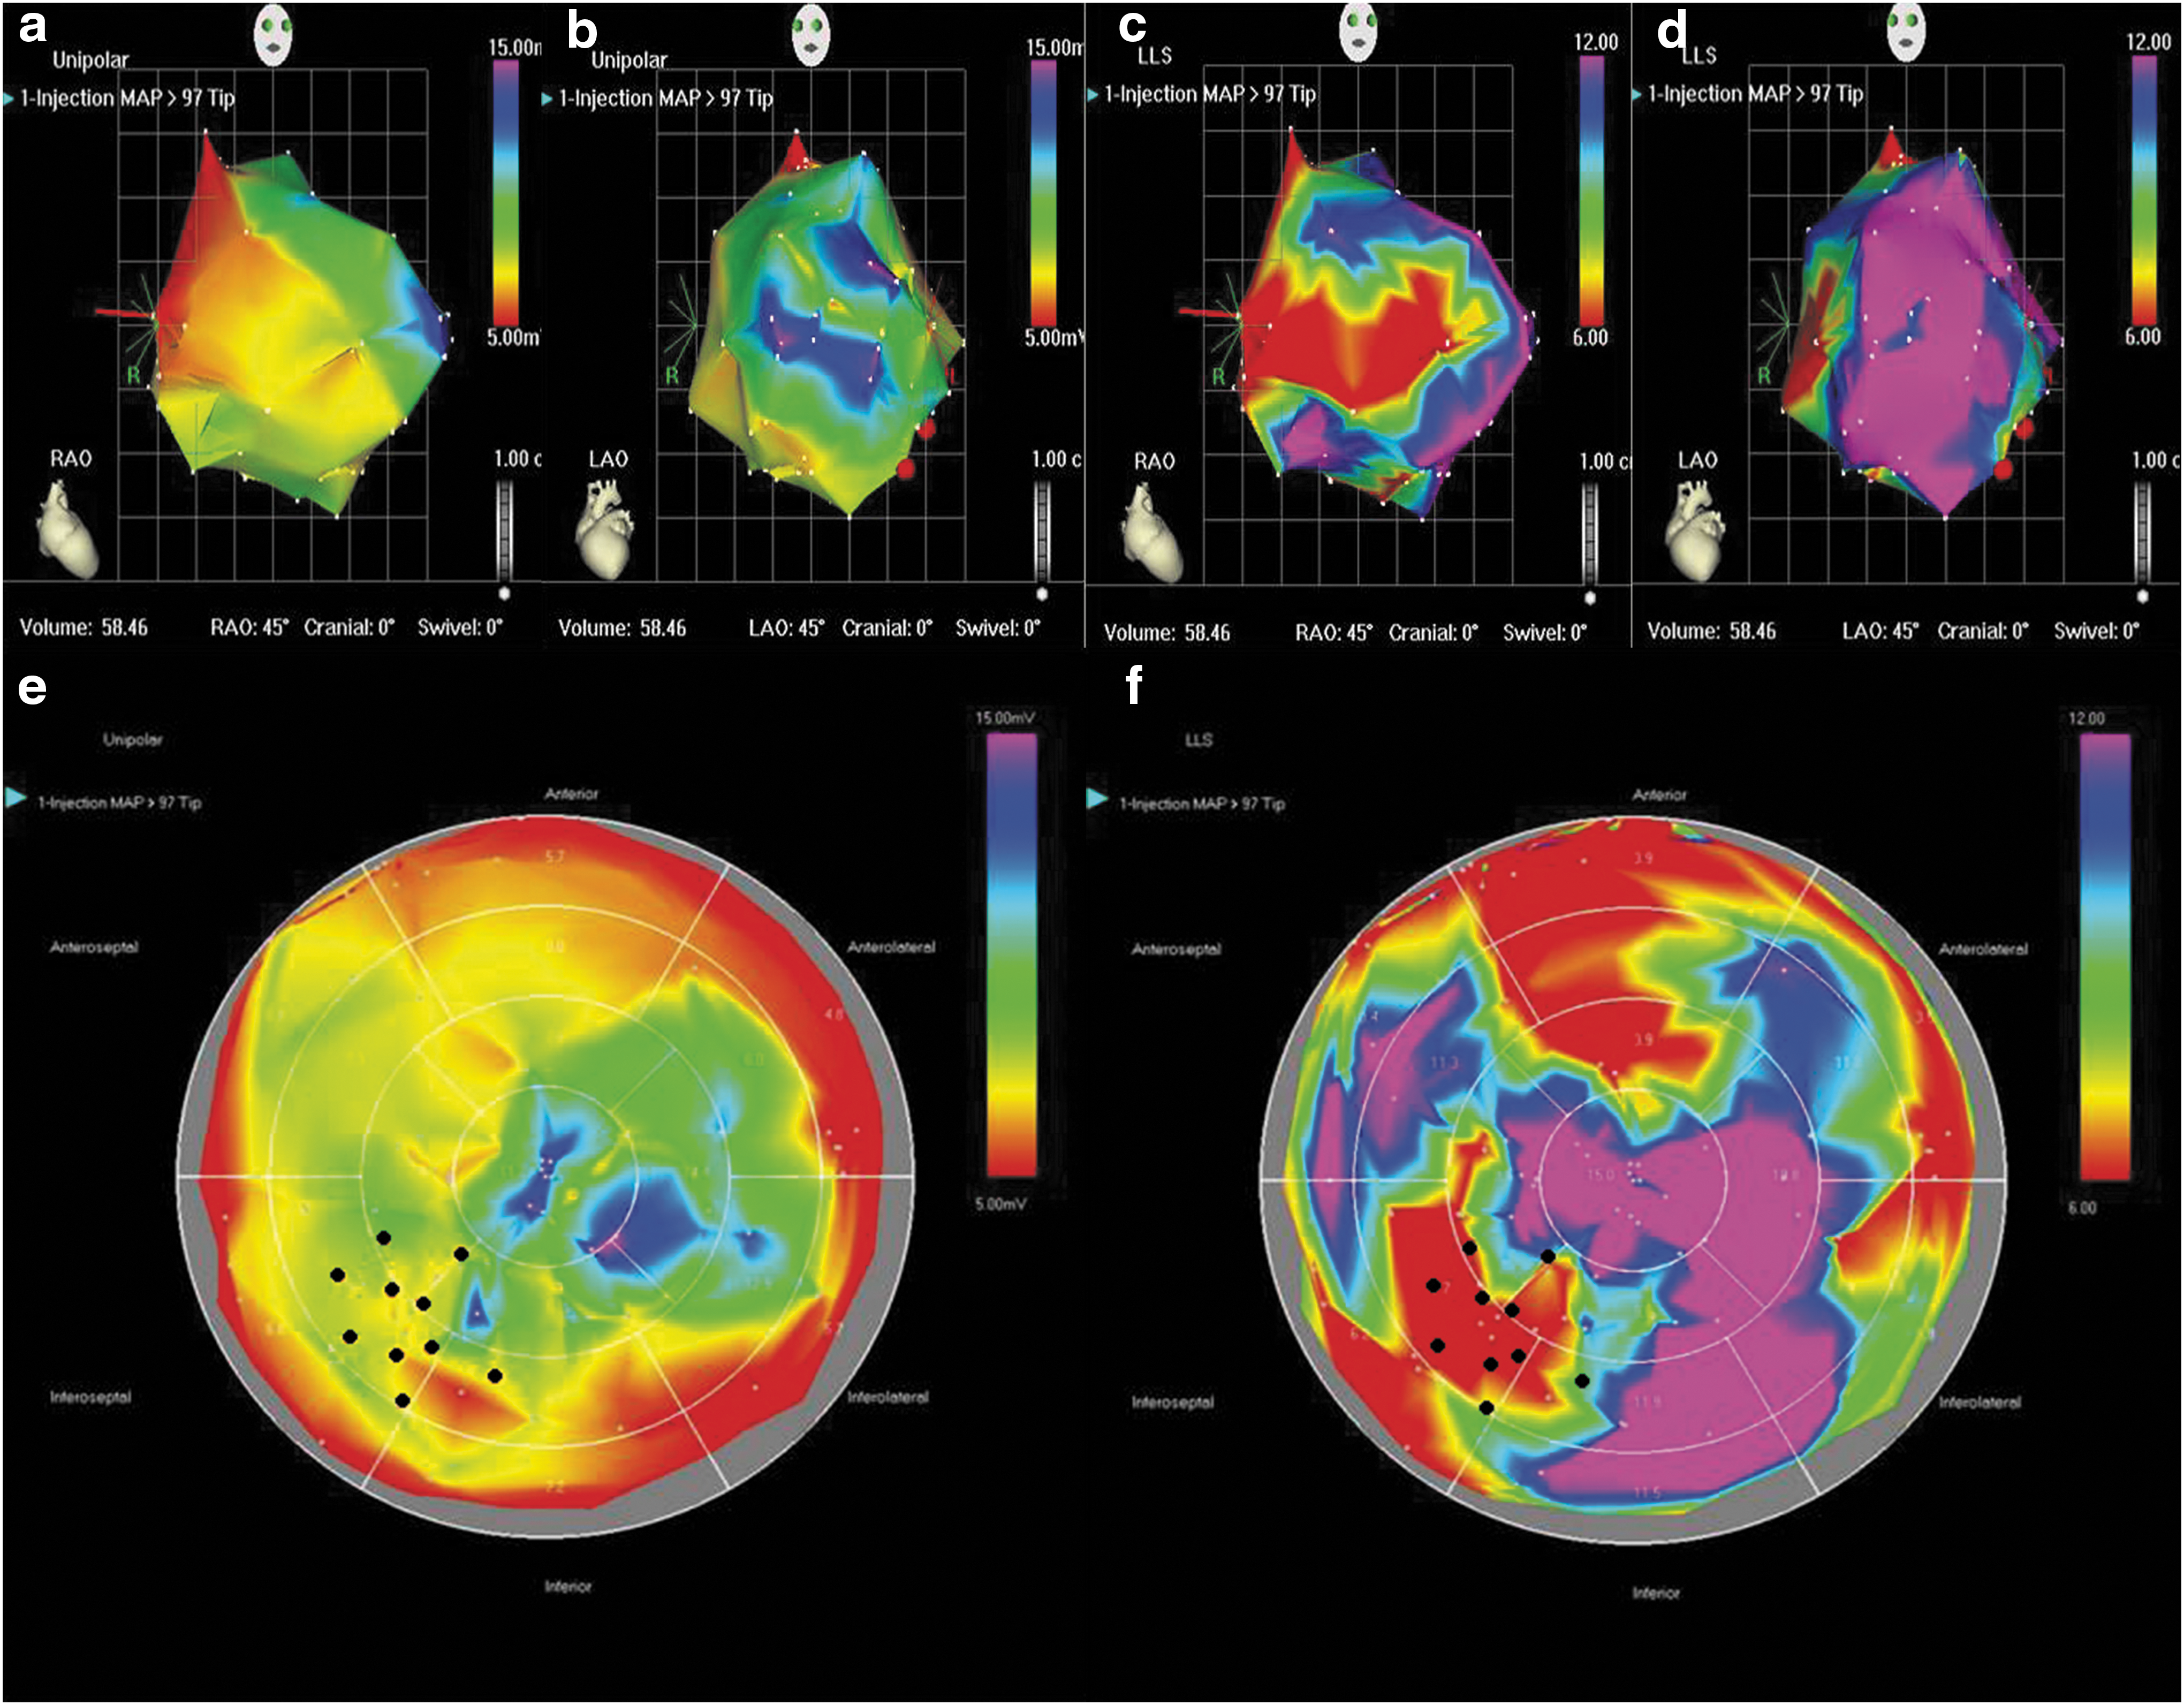
Electroanatomical mapping of patient 127. Three-dimensional unipolar voltage maps (
After mapping, AdVEFG-DΔNΔC was injected into 10 sites on the left ventricular myocardium selected based on the combined NOGA and PET mapping with the NOGA injection catheter. The injections were localized 5–10 mm apart from each other in areas of viable myocardium with reduced contraction and impaired perfusion reserve (i.e., hibernating myocardium). The injection volume was 200 μL per injection, the depth of the injections being 5 mm. Patients received 1 × 10⁹–1 × 10¹¹ vpu AdVEFG-DΔNΔC or matching placebo. The control group underwent the same electroanatomical mapping of the left ventricle and selection of ideal sites for gene injections, but instead of AdVEFG-DΔNΔC, 10 injections of NaCl solution were delivered into the left ventricular cavity. Only the operator knew the randomization code. Details of the patients and study design are reported elsewhere. 10
Myocardial perfusion imaging
A bolus of 15 O-labeled water was injected into the vein, and perfusion was detected by PET imaging (GE Discovery; General Electric Medical Systems, Waukesha, WI). Myocardial blood flow was assessed at rest and during adenosine induced stress, as described. 11 The myocardial perfusion reserve was calculated as the ratio of myocardial blood flow during adenosine-induced hyperemia and at rest. Three-dimensional perfusion images were converted to 17 segmental two-dimensional bull's-eye view with Carimas program v2.9. Details of the imaging procedure have been described previously. 11
Vector
Replication-deficient GMP grade serotype 5 Ad was produced by FinVector Therapies Oy (Kuopio, Finland). Details of the adenovirus production methods and the transgene have already been described. 12 –14
Follow-up
In-hospital follow-up until the second postoperative day included vital signs, routine laboratory tests, transthoracic echocardiography, and electrocardiogram. Follow-up was continued on days 6 and 14 as well as 3 and 12 months after the procedure. Adverse events were classified as either serious or non-serious based on European Commission Enterprise and Industry Directorate. 15
Results and Discussion
NOGA® mapping was successfully performed in all 30 patients. The mapping and injection procedure took about 4 h, and it was safe and well tolerated. The three-dimensional NOGA® maps converted to 17 segment two-dimensional bull's-eye view correlated in most cases very well to 17 segment bull's-eye view in PET. Figure 1 presents conversion of the NOGA® maps to the bull's-eye maps. The program converts three-dimensional maps to two-dimensional using the left ventricular apex and base as reference information. Voltage and linear shortening maps are color coded. Areas with the highest voltage and linear shortening are coded in purple (normal viability and contractility, respectively). Lowest regional voltage and linear shortening areas are coded in red (scar and impaired contraction, respectively). The aim was to target the injections into areas with viable myocardium and reduced contraction (i.e., hibernating myocardium), which usually also showed low perfusion in the PET imaging. Infarcted myocardium (low voltage map) does not contain viable myocardium, and thus gene therapy cannot enhance perfusion in these areas.
In the authors' experience, NOGA® mapping provides significant support to target intramyocardial gene transfer to hibernating myocardium. Injections without intramyocardial mapping would be at much higher risk of missing the right target area. Both PET imaging and NOGA® mapping were used together to locate the right target area for intramyocardial injections. Most of the patients who presented with an ischemic area in PET stress perfusion had also reduced contractility in the NOGA® LLS mapping. However, in spite of severe ischemia in PET mapping, some patients did not have any impairment of contractility in the NOGA® mapping. This is most likely due to the fact that NOGA® mapping is performed at rest, and those patients did not have any ischemia at rest. These patients, however, showed ischemia in the stress PET imaging, and thus injections were successfully targeted to those areas.
Patients having clear ischemic area in PET mapping and viable myocardium with reduced contractility in NOGA® mapping are the optimal candidates for gene therapy. These patients showed reduced contractility and perfusion, and injections were targeted to this area. Follow-up PET imaging showed that perfusion increased in those treated areas as depicted in Fig. 2.
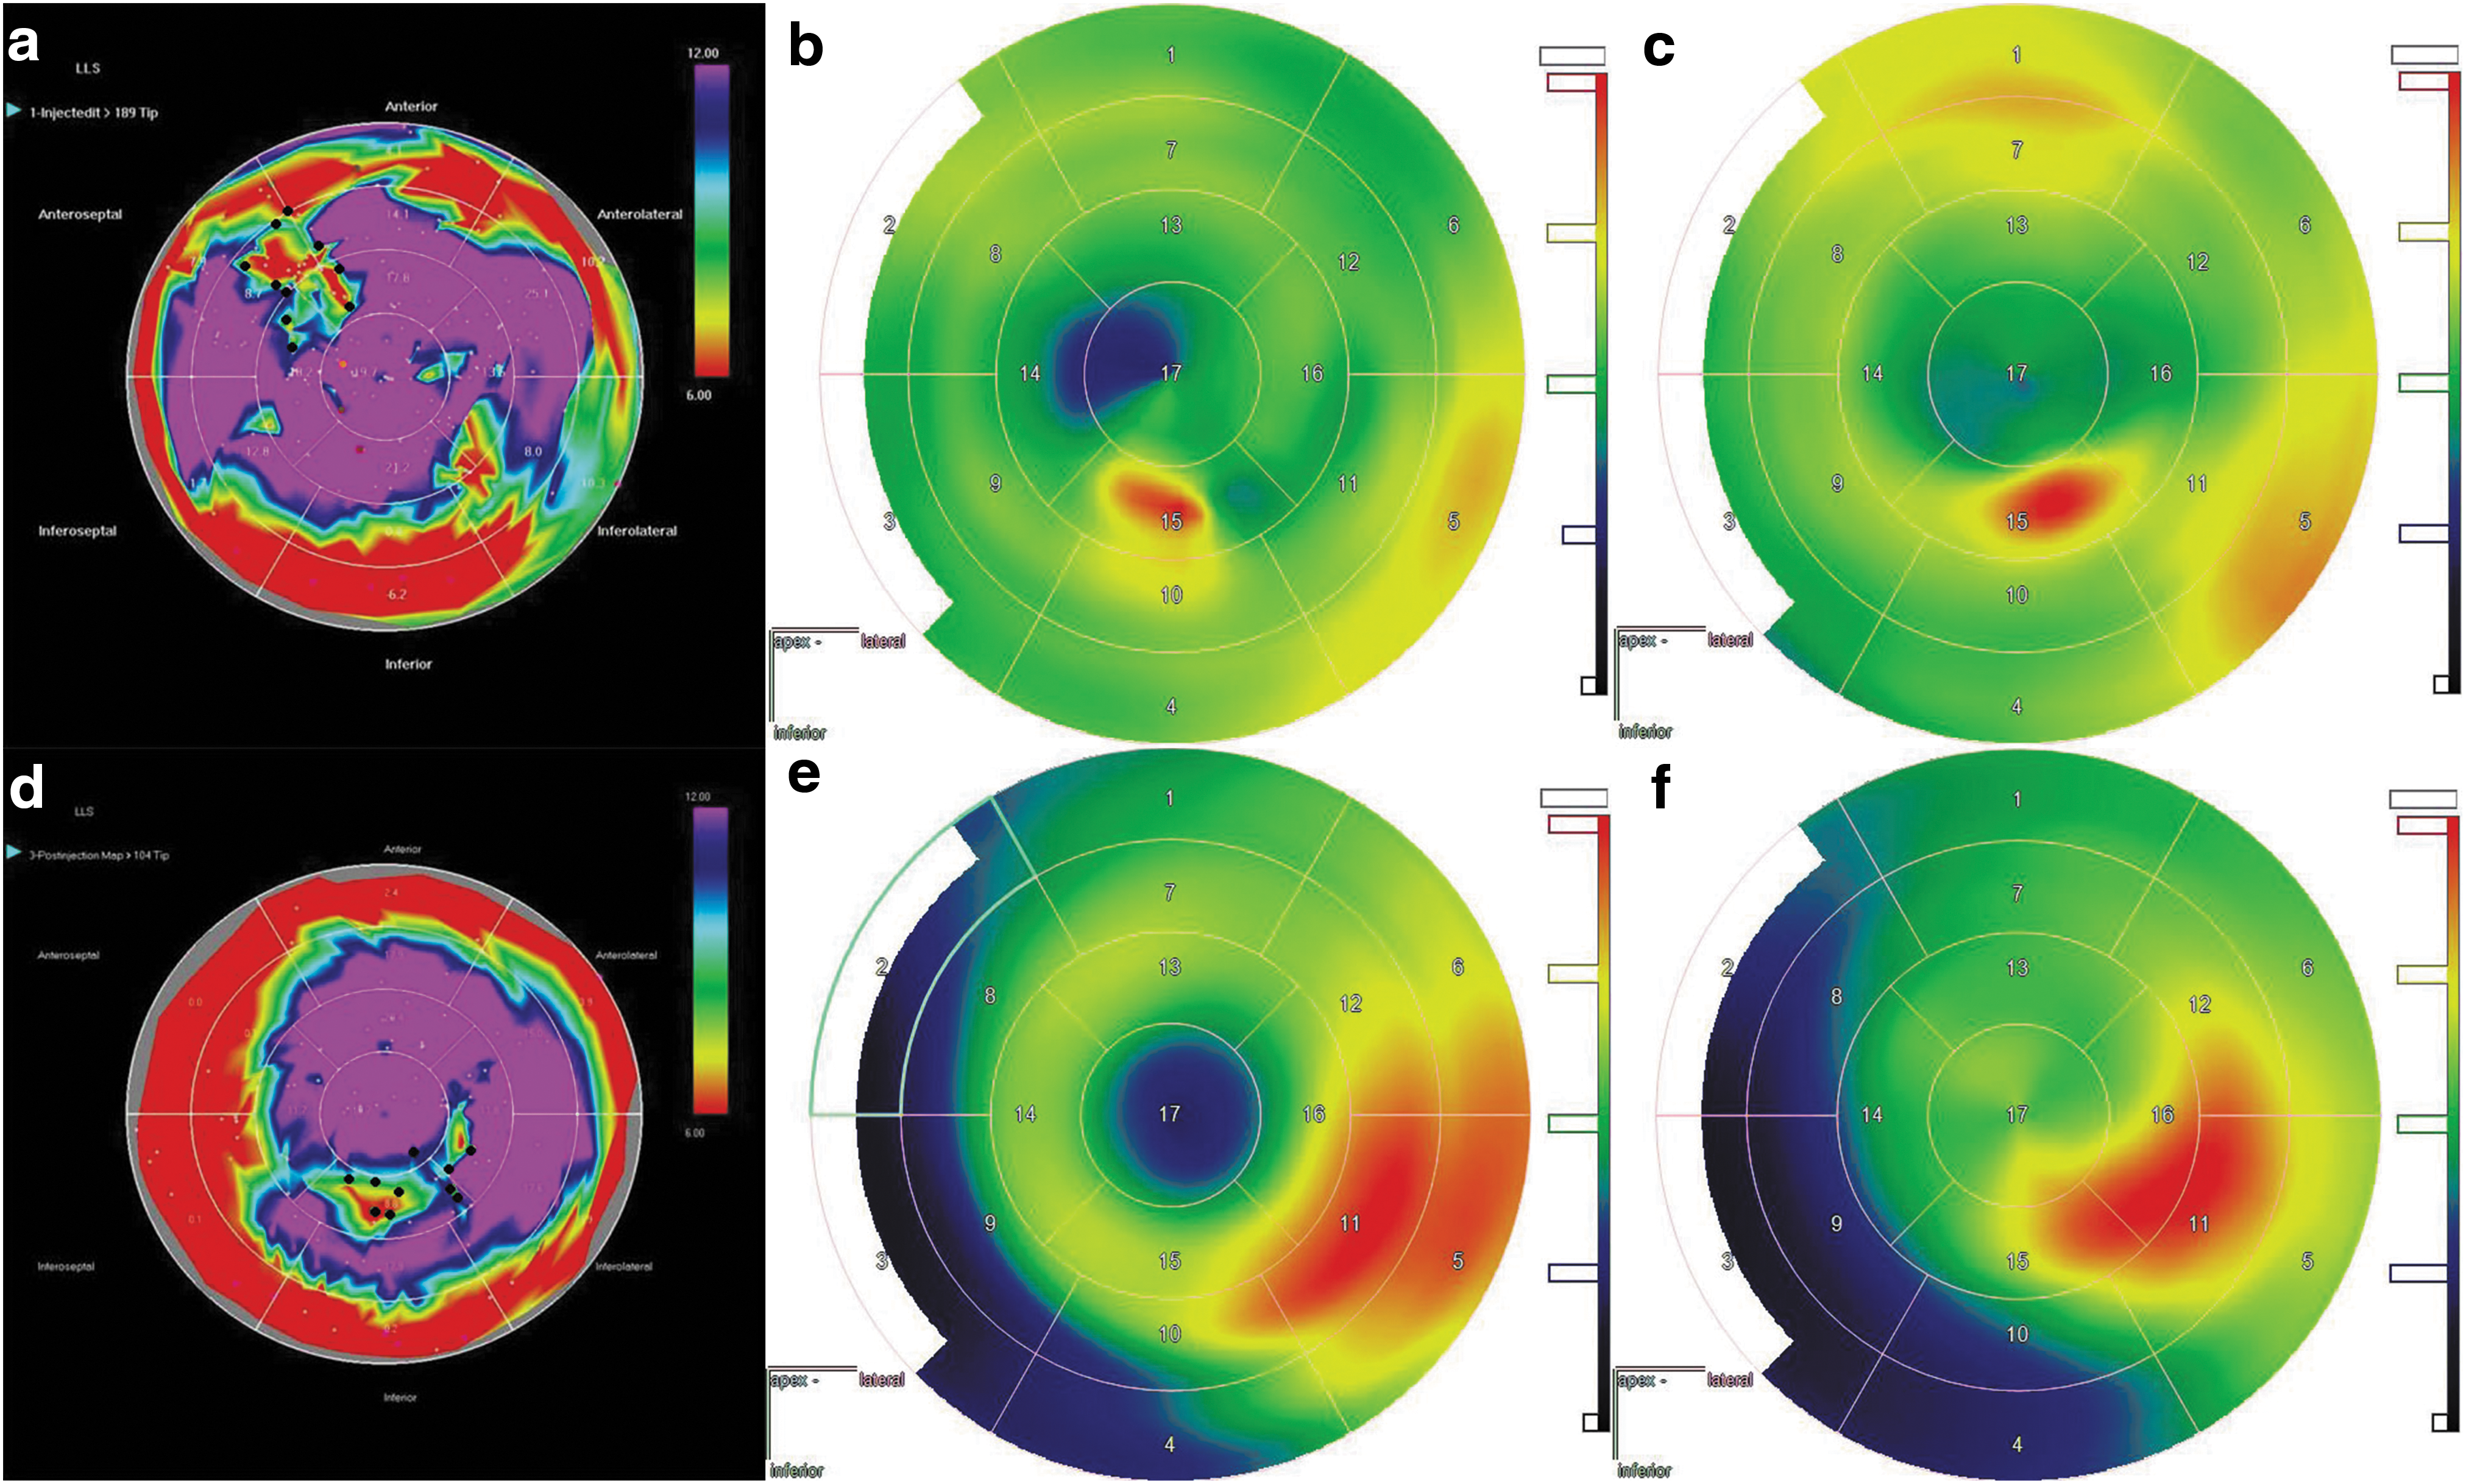
NOGA® maps and positron emission tomography (PET) images of two study patients. (
In conclusion, the optimal route for gene therapy is via targeted intramyocardial injections. Combined information provided by perfusion imaging and electromechanical NOGA® mapping is the most accurate method to target gene transfer to ischemic but viable hibernating myocardium.
Footnotes
Acknowledgments
We thank the University Hospital staff in Kuopio and Turku PET Center for their help in the study.
Author Disclosure
No competing financial interests exist.