
Abstract
Lentiviral vectors hold great promise for the genetic correction of various inherited diseases. However, lentiviral vector biology is still not completely understood and warrants the precise decoding of molecular mechanisms underlying integration and post-translational modification. This study investigated a series of self-inactivating (SIN) and full long terminal repeat (LTR) lentiviral vectors that contained different types of promoters with or without a transgene to gain deeper insights in lentiviral target site selection and potential perturbation of cellular gene expression. Using an optimized nonrestrictive linear amplification-mediated polymerase chain reaction (nrLAM-PCR) protocol, vector structure-dependent integration site profiles were observed upon transduction of mouse lin– hematopoietic progenitors in vitro. Initial target site selection mainly depended on the presence of the promoter while being independent of its nature. Despite the increased propensity for read-through transcription of SIN lentiviral vectors, the incidence of viral–cellular fusion transcript formation involving the canonical viral splice donor or cryptic splice sites was reduced in both unselected primary lin– cells and transformed 32D cells. Moreover, the strength of the internal promoter in vectors with SIN LTRs is decisive for in vitro selection and for the abundance of chimeric transcripts, which are decreased by moderately active promoters. These results will help to better understand vector biology and to optimize therapeutic vectors for future gene therapy applications.
Introduction
R
Recently, clinical and preclinical studies revealed that lentiviral integration can be associated with side effects other than enhancer-mediated gene activation, namely the formation of aberrant transcripts. SIN lentiviral vectors display an increased frequency of read-through transcription compared to their wild-type (WT) LTR counterpart. 21,22 Subsequent aberrant splicing can result in viral–cellular fusion transcripts, which may deregulate cellular gene expression and potentially promote unwanted effects. In a clinical gene therapy trial for β-thalassemia, lentiviral vector-induced aberrant splicing stabilized a truncated HMGA2 transcript, which caused clonal dominance. 23 This was associated with transfusion independence but no adverse effects. On the contrary, a truncated transcript generated by the fusion of a lentiviral vector with a cellular proto-oncogene contributed to tumor formation in a mouse model. 19 Chimeric transcript formation might also lead to gene inactivation due to downregulation of the full length messenger, as has been recently observed in a murine study. Intronic integration and subsequent aberrant splicing of a lentiviral gene marking vector induced haploinsufficiency of Ebf1, a known tumor suppressor gene, thereby causing leukemia. 24 These results emphasize the need for a deeper understanding of the fundamental interplay between viral vectors and the host-cell transcription machinery and its consequences. 25
Recent reports showed that chimeric transcript formation is a very common event that likely depends on the cell type and LTR configuration. 26,27 Thus, the exact functions and interactions of viral and cellular elements during integration and transcription are not yet resolved. Vector elements such as the LTR (full or SIN), enhancer/promoter, and transgene are the most commonly changed features during vector design. 28 This work examined the influence of these functional vector elements on lentiviral integration and cellular gene expression by high-resolution genome- and transcriptome-wide analysis. The results highlight the importance of the internal promoter in SIN lentiviral vectors during target site selection and in the context of chimeric transcript formation. The quantification of these transcripts will help to improve lentiviral vector design and eventually the safety of gene therapeutic applications.
Materials and Methods
Lentiviral vector production and titration
VSV-G pseudotyped lentiviral vectors were produced by transient four-plasmid co-transfection of 293T cells using polyethylenimine, harvested 2 days after transfection and concentrated by ultracentrifugation. The vector titer was determined on HeLa cells by flow cytometry 72 h after infection with serial dilutions of the viral suspension.
Isolation and transduction of hematopoietic progenitor cells
Mouse bone marrow was isolated from the femur and tibia by flushing with phosphate-buffered saline with 2% fetal bovine serum (FBS; Invitrogen) and lin– cells were purified by lineage-marker negative selection using the Enrichment of Murine Hematopoietic Progenitors kit (STEMCELL Technologies, Inc.). Cells were plated at a density of 1 × 10⁶ cells/mL and cultured for 24 h in StemSpan™ serum-free expansion medium (STEMCELL Technologies, Inc.) supplemented with cytokines (100 ng/mL of stem cell factor [SCF], 100 ng/mL of Flt3-ligand, 100 ng/mL of thrombopoietin [TPO], and 20 ng/mL of interleukin [IL]-3; PeproTech). Lin– cells were then subjected to mock or lentiviral vector transduction and, 18 h post-infection, cells were washed and maintained in RPMI supplemented with 10% FBS, 100 IU/mL of penicillin, 100 mg/mL of streptomycin, 20 ng/mL of SCF, 20 ng/mL of Flt3-l, 20 ng/mL of TPO, and 4 ng/mL of IL-3 for up to 60 days.
DNA and RNA isolation, cDNA synthesis, and vector copy number determination
Genomic DNA was isolated using the High Pure PCR Template Preparation Kit (Roche) according to the manufacturer's instructions. Total mRNA was extracted with the RNeasy MiniKit (Qiagen), including the optional on column DNA digestion step. Following a rigorous DNase treatment using the Ambion™ TURBO DNA-free™ kit (Life Technologies), cDNA was synthesized with the Verso™ cDNA Kit (Thermo Scientific). A control reaction lacking the reverse transcriptase (–RT) was performed for subsequent nonrestrictive linear amplification-mediated polymerase chain reaction (nrLAM-PCR) analyses. To further exclude DNA contamination, a reverse transcription (RT) PCR was performed with Hprt specific primers annealing in different exons (data not shown). Vector copy numbers (VCNs) were determined by quantitative PCR, with primers annealing within Hprt and within the vector: 5′-GGGCATCTACTTACAGTCTGG/5′-GAAGCTGTCCTTATTCTGAATGC and 5′-GAGCTCTCTGGCTAACTAGG/5′-GCTAGAGATTTTCCACACTG, respectively.
In vitro genotoxicity assay
32D cells (ATCC) were cultured in RPMI supplemented with 10% fetal calf serum, 1% penicillin/streptomycin, and 5% IL-3. Transduction was performed at a density of 5 × 10⁵ cells/mL in the presence of polybrene followed by an expansion period of several days. Colony assays were executed as described previously. 29 Transduction efficiency and vector presence in selected colonies were determined by flow cytometry and PCR, respectively (primers: 5′-AAACGGCCACAAGTTCAGCG and 5′-TCTTCTGCTTGTCGGCCATG).
Integration site and chimeric transcript analysis
Integration sites (IS) were analyzed by nrLAM-PCR using an optimized protocol (see below) for increased sensitivity and accuracy. Read-through and fusion transcripts were detected via LAM- or nrLAM-PCR. (nr)LAM-PCR, 454 sequencing, and bioinformatical data analysis were performed as described before, 30 –33 with the following adjustments in the nrLAM-PCR protocol. After magnetic capture of the linear PCR product, beads were washed and re-suspended in 10 μL of mastermix for linker cassette ligation using CircLigase™ ssDNA Ligase (Epicentre): 1.5 μL of water, 1 μL of 10 × CircLigase™ reaction buffer, 1 μL of ssDNA linker (10 pmol/μL), 0.5 μL of MnCl2 (50 mM), 0.5 μL of ATP (1 mM), and 5 μL of 50% PEG 8000 (preheated for 5 min to 60°C). After 1 h of incubation at 60°C, the reaction was stopped by addition of 90 μL of H2O. Subsequently, DNA–bead complexes were washed and re-suspended in 10 μL of H2O. Exponential amplification by nested PCR and 454 sequencing were performed as previously described. 31 Primer sequences for read-through and fusion transcript analyses were as follows: 5′-bio-AGTAGTGTGTGCCCGTCTGT, 5′-bio-GTGTGACTCTGGTAACTAGAG, 5′-GATCCCTCAGACCCTTTTAGTC and 5′-bio-AGTAGTGTGTGCCCGTCTGT, 5′-bio-CAGTGGCGCCCGAACAG, 5′-GAAAGCGAAAGGGAAACCAG, respectively. A –RT control (see above) was analyzed in addition for each sample as a control for DNA contamination.
Clonality and comparative common integration site analysis
The Shannon value Hj for the sample j is defined as Hj = Σ i fji log fji , where fji is the reads fraction that contributes to the IS i in the sample j, whereas the Simpson index Sj is defined as Sj = 1/Σ ifji 2. The pairwise comparison of the common integration site (CIS) profile was performed to evaluate the similarity of the samples. The CIS definition was as follows: a CIS of 2nd order comprises two IS within 30 kb, a CIS of 3rd order comprises three IS within 50 kb, a CIS of 4th order comprises four IS within 100 kb, and a CIS of 5th and higher order comprises five or more IS within 200 kb. 34 Each combination of the insertion site set of sample i and j were analyzed in order to obtain a mixed CIS profile. Normalized entropy N between 0 and 1 was then computed for each CIS >4th order in the mixed profile. The normalized entropy value for the CIS l in the mixed profile of the sample i and j is defined as Nijl = (Σ k pijlk )/log 2, where pijlk is the IS fraction belonging to the sample k. Then, all those CIS with Nijl > 0.5 were defined as shared. The fraction of shared CIS with respect to the total number of CIS was used as a measure of association between the two samples. The values together form a 5 × 5 association matrix, with values ranging from 0 (no shared CIS) to 1 (all CIS are shared). The matrix was then loaded into R suite and converted to a dissimilarity table. Briefly, for each element eij in the matrix, with i = 1, 2, …, 5, a dissimilarity table was constructed where the dissimilarity values di,j = 1 – eij are used as a distance in order to perform a hierarchical clustering. The tree structure is then obtained by plotting the results returned from the R function hclust().
Results
For high-resolution IS analyses, nrLAM-PCR performance was substantially improved in terms of sensitivity and efficiency (Supplementary Fig. S1 and S2; Supplementary Data are available online at
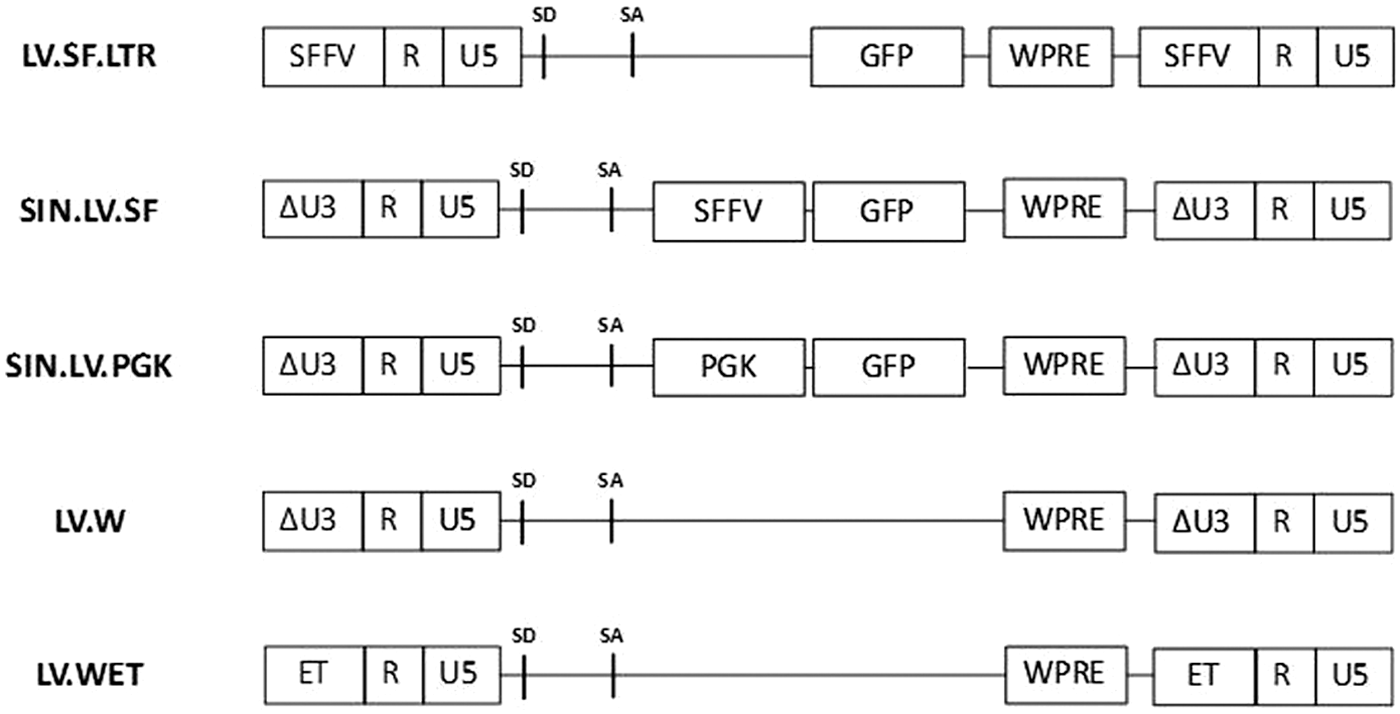
Lentiviral vector constructs employed to assess vector architecture's effect on integration site and clonal selection. SFFV, enhancer/promoter of the spleen focus forming virus; SD, splice donor; SA, splice acceptor; GFP, green fluorescent protein; WPRE, woodchuck hepatitis virus post-transcriptional regulatory element; ΔU3, deletion of U3; PGK, phosphoglycerate kinase promoter, ET, liver-specific transthyretin promoter.
nrLAM and vector copy number analysis performed 14 days post transduction on lineage negative (lin–) murine stem and progenitor cells transduced with a series of lentiviral vectors
nrLAM, nonrestrictive linear amplification-mediated; IS, integration sites; VCN, vector copy number.
First, nrLAM-PCR followed by 454 pyrosequencing was performed on lin– cells 14, 30, 45, and 60 days after lentiviral transduction. In total, the study identified 5,159 (LV.SF.LTR), 9,414 (SIN.LV.SF), 8,461 (SIN.LV.PGK), 5,033 (LV.W), and 6,719 (LV.WET) uniquely mappable IS (Table 2). Diversity analyses based on the number of IS, VCN, and transduction efficiency showed a highly polyclonal pattern for all vectors 14 days post-transduction. Over time, emergence of individual cell clones and loss of diversity was observed in cells transduced with the full SFFV LTR-driven vector LV.SF.LTR (Fig. 2A). Sample heterogeneity was assessed by two diversity indexes, the Shannon index and the Simpson index. 35 This confirmed a clear reduction in both clonality (Shannon index; Fig. 2B) and homogeneity (Simpson index; Fig. 2C) in LV.SF.LTR-transduced cells 30–45 days post-transduction. In contrast, SIN lentiviral vectors and a vector with a liver-specific LTR promoter did not show dominant clones and only exhibited a slight diversity reduction. All vectors showed the typical lentiviral integration pattern, with 62.6 ± 0.9% of all integrations occurring in-gene and no obvious differences in the global chromosomal distribution.
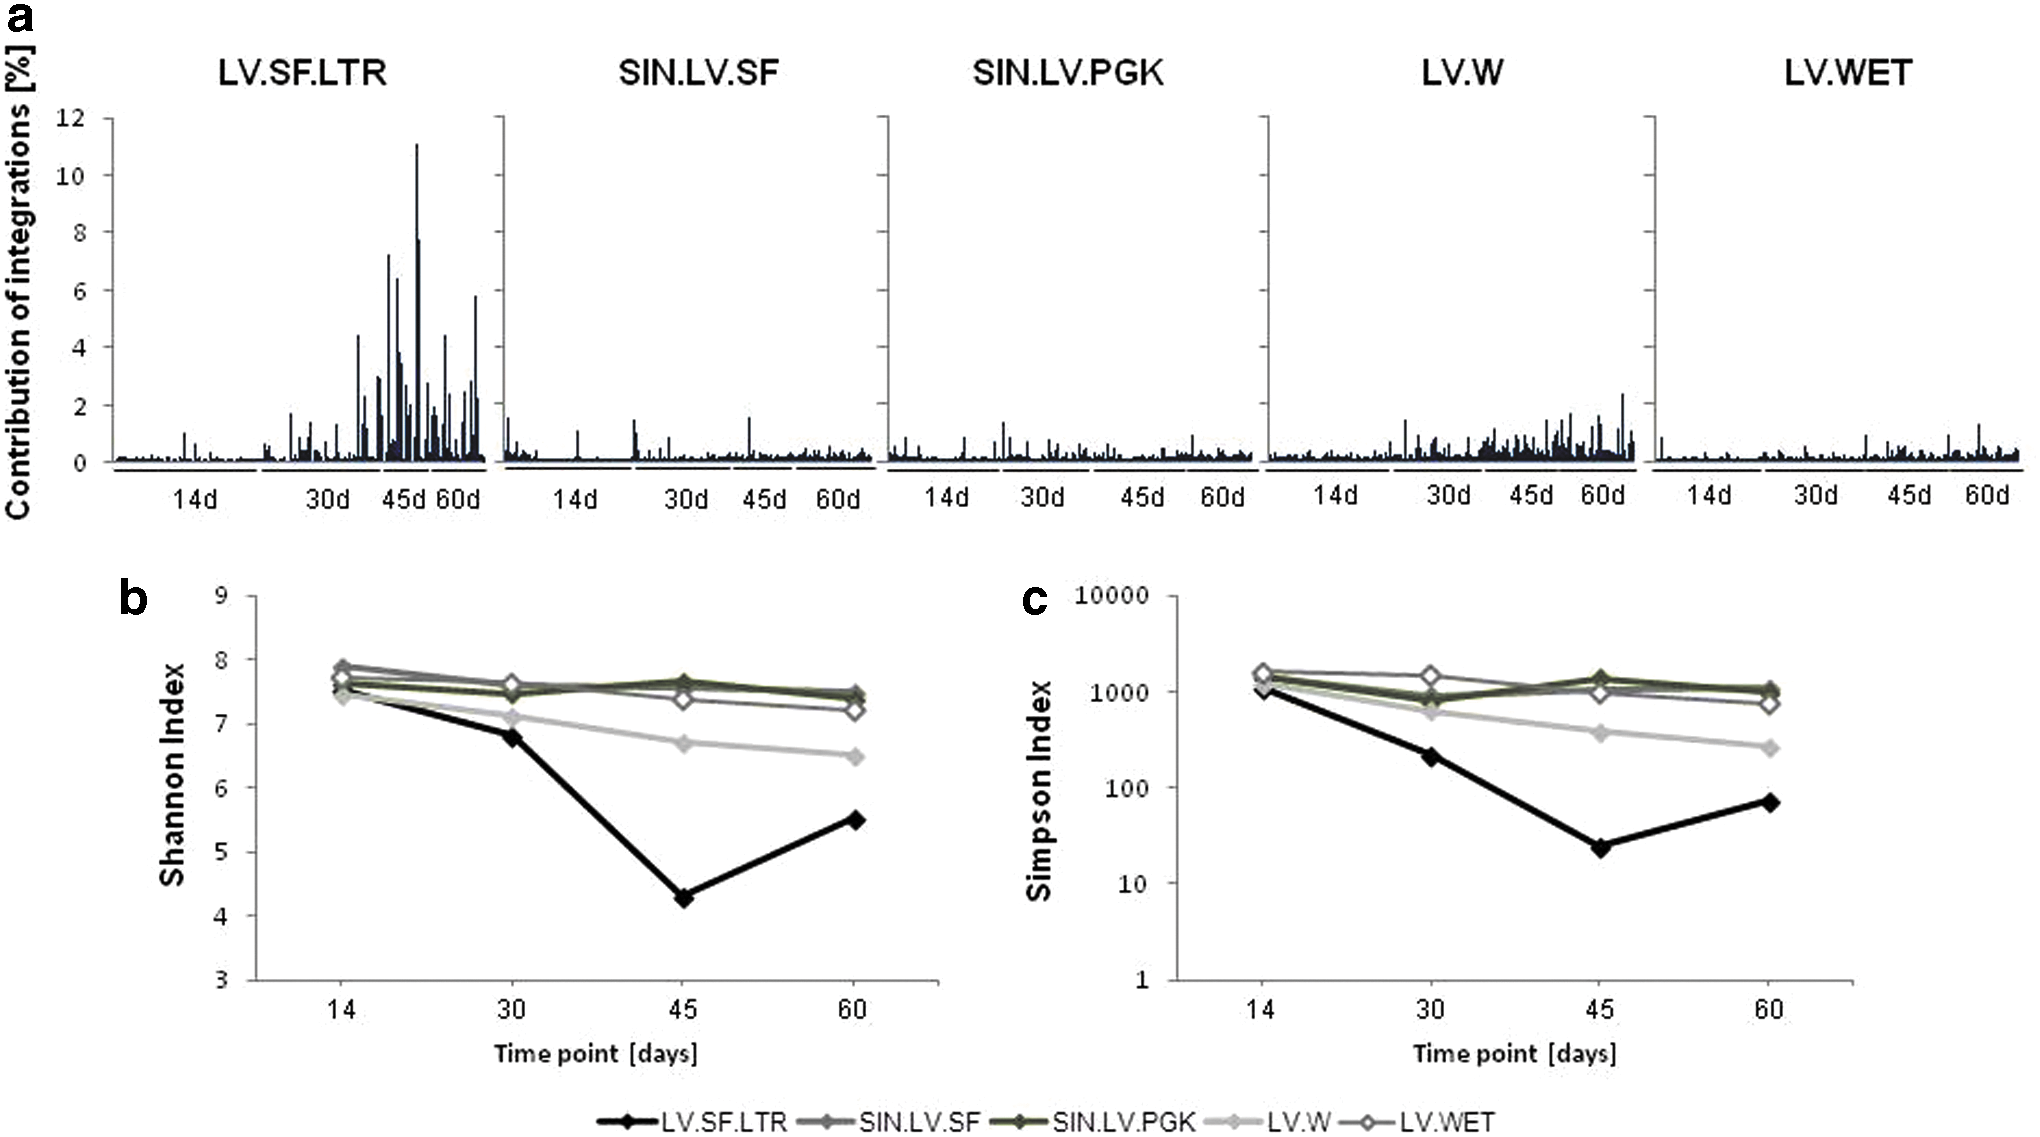
Clonality of transduced cell populations over time.
Integration site analysis performed on lineage negative (lin–) murine stem and progenitor cells at different time points post transduction with different lentiviral vectors
To obtain a deeper insight into lentiviral target site selection, comparative analyses of common integration sites (CIS) were performed at an early time point after transduction (48 h). By LAM-PCR and subsequent 454 sequencing 1,200 (LV.SF.LTR), 899 (SIN.LV.SF), 1,051 (SIN.LV.PGK), 847 (LV.W), and 1,226 (LV.WET) IS were identified. Comparable data sets were obtained by extracting equal numbers of IS from each integration site pool. Comparative CIS analyses were performed pairwise, with the proportion of shared CIS being representative for the similarity of their IS profiles. Based on the ratio of shared and unique CIS, a phylogenetic tree was created. All vectors comprising a professional promoter formed one common cluster, while the only vector lacking promoter sequences did not integrate in this cluster (Fig. 3A). The distance of the cluster to the empty vector without promoter and transgene (LV.W) was relatively high compared to the distances between vectors within the cluster (height 1.0 vs. 0.01–0.2). In contrast, comparative CIS analysis 14–60 days post-transduction showed that the further development of the integration site pool is mainly dependent on the nature and strength of the promoter (Fig. 3B). Both vectors with a strong SFFV promoter in an internal position or in the LTR (SIN.LV.SF and LV.SF.LTR) constituted one cluster, while another cluster was formed by two vectors with a weak or without a promoter (SIN.LV.PGK and LV.W). The vector bearing a tissue-specific promoter (LV.WET) showed the lowest similarity in the selected IS profile. The prolonged culture of bulk cells and subsequent analyses with high-resolution nrLAM-PCR enabled vector-driven clonal selection to be measured in an easy and fast in vitro setting.
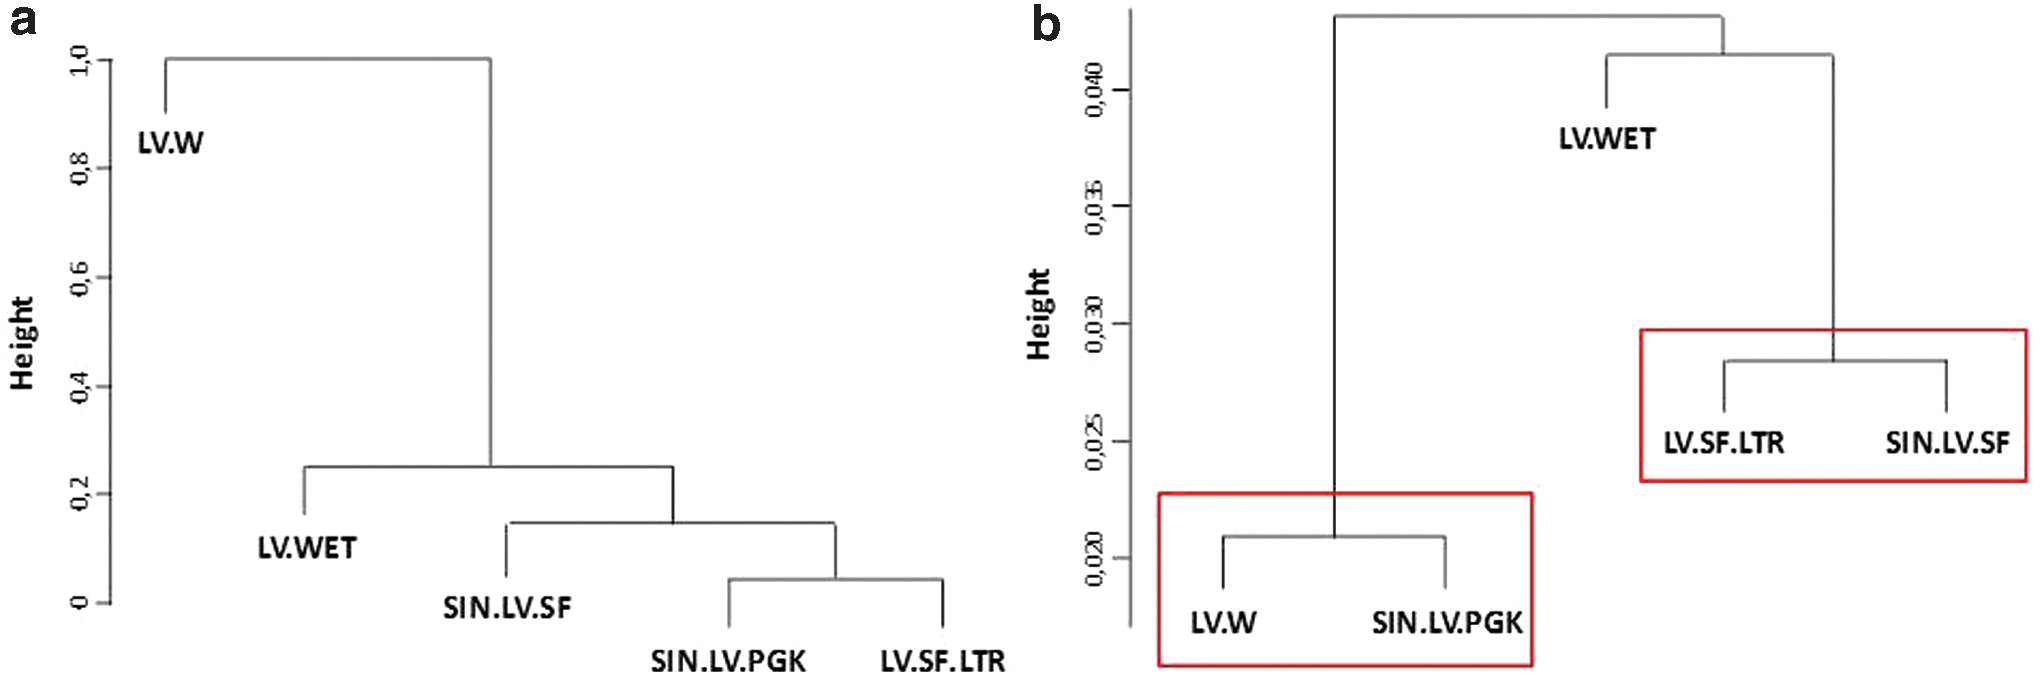
Comparative analysis of integrations site profiles of different lentiviral vector constructs at different time points post transduction. To determine the relationship of the vectors, comparative CIS analyses were performed pairwise, and dendrograms were generated based on the percentage of common CIS, with the height representing the distance between the vectors.
Next, the study aimed to understand how vector structure and elements affect the incidence of viral–cellular read-through transcription, abnormal splicing, and the characteristics of chimeric transcripts. Thus, aberrant transcript formation was investigated in a transcriptome-wide fashion using nrLAM-PCR on cDNA from murine lin– cells 14 days after transduction. Functional analyses were conducted with the vectors LV.SF.LTR, SIN.LV.SF, and SIN.LV.PGK, showing that at different frequencies, all three vectors may give rise to chimeric read-through (Fig. 4A) and fusion (Fig. 4B) transcripts. High-throughput sequencing revealed 351 (LV.SF.LTR), 674 (SIN.LV.SF), and 74 (SIN.LV.PGK) viral–cellular read-through transcripts (Fig. 4C).
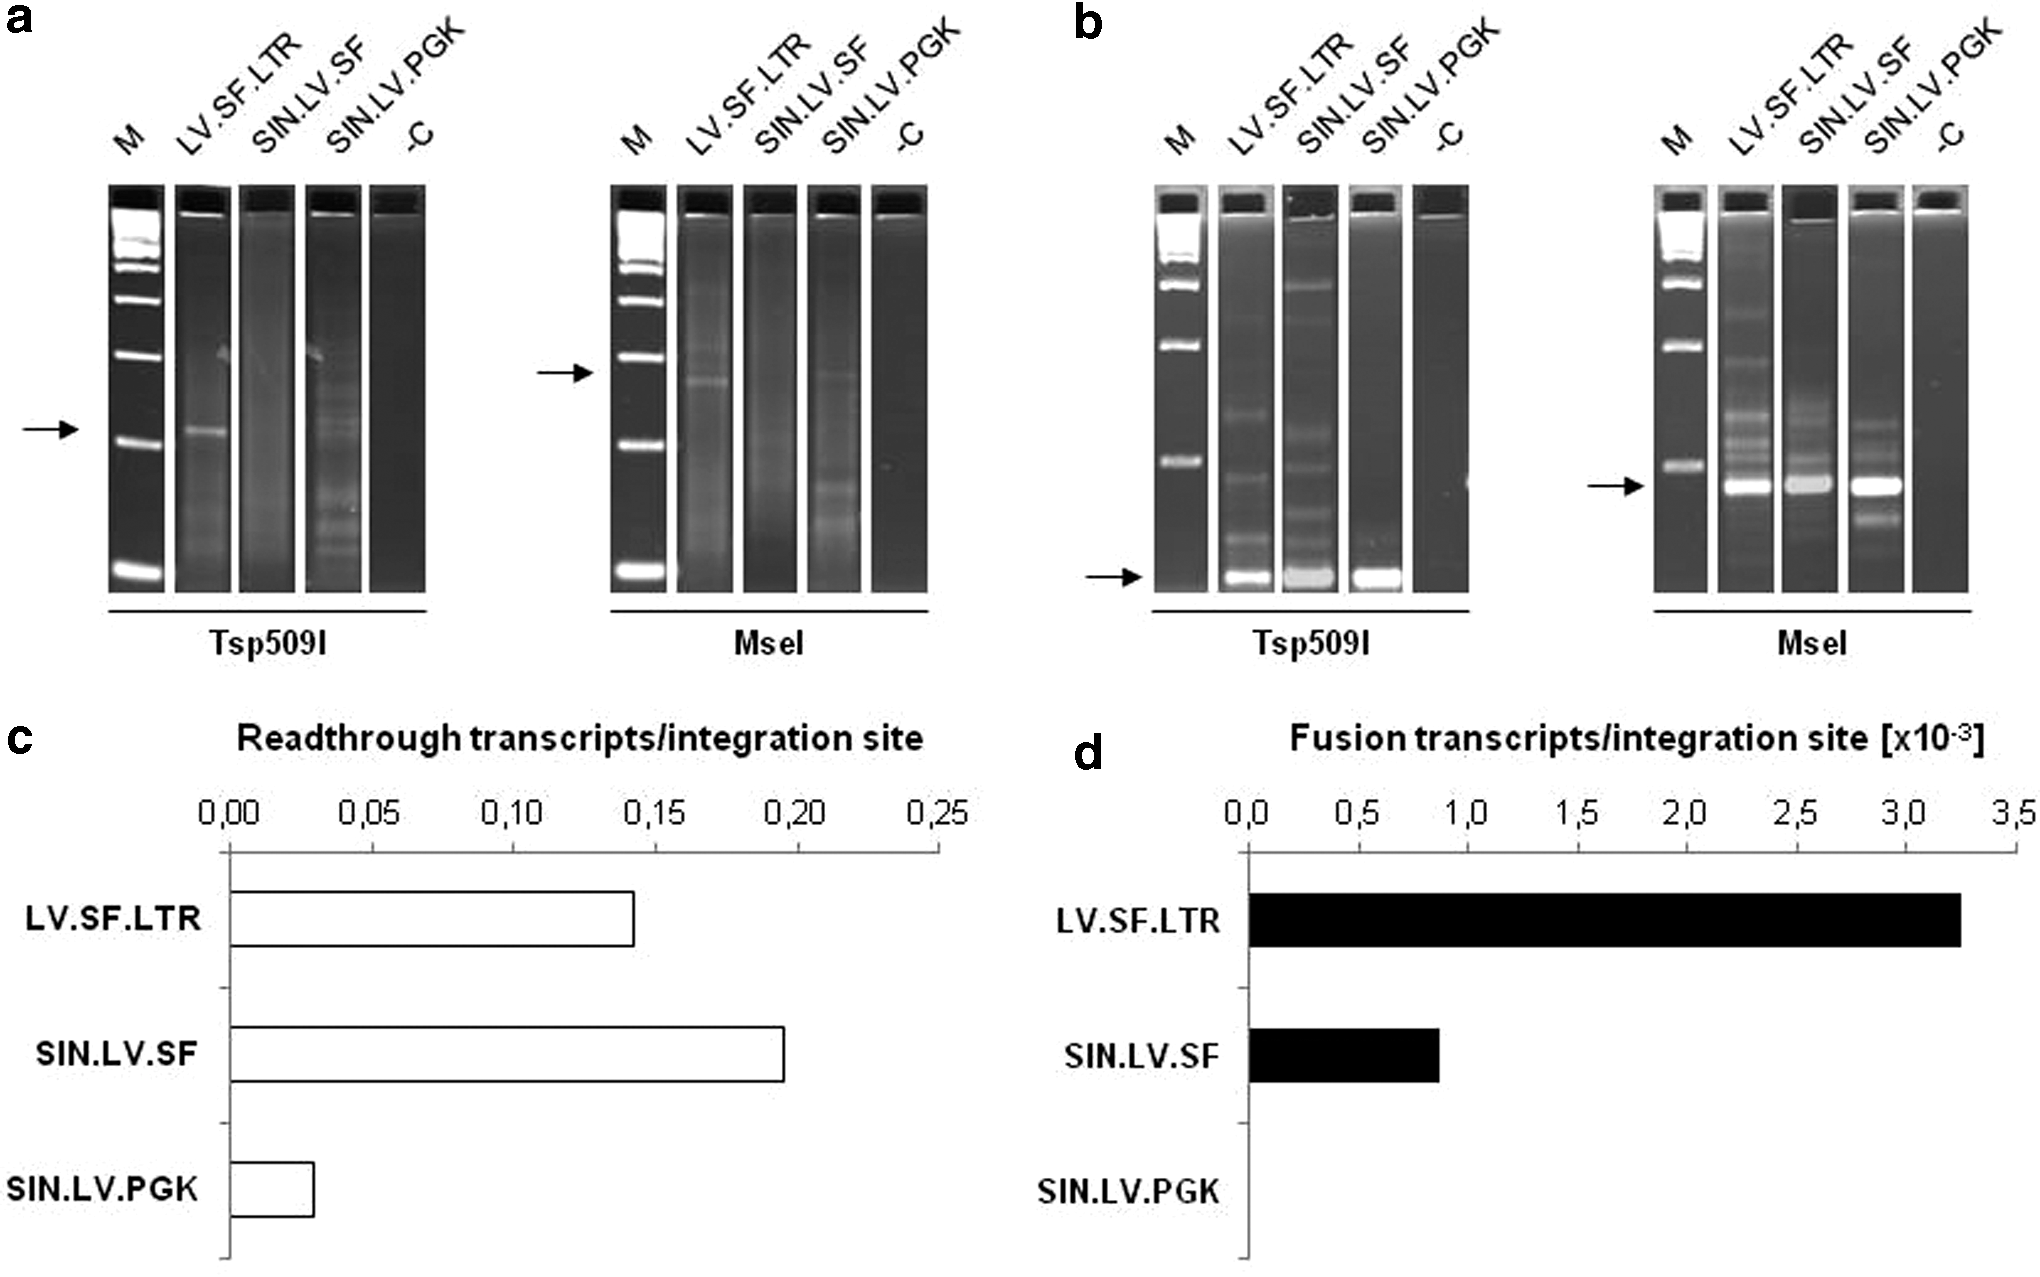
Aberrant transcript formation of lentiviral vectors. 3′ LAM-PCR analysis was performed on 150 ng of cDNA of lentiviral transduced lineage negative cells for the detection of chimeric
To answer the question of whether the genomic region surrounding the insert has an influence on the frequency of read-through transcription, the occurrence of transcripts in gene coding and non-coding regions was compared with the IS distribution. All vectors showed a significantly higher read-through rate within gene coding regions, mainly in introns (75.1 ± 3.1% vs. 62.4 ± 0.7%; p = 2.9 × 10⁻¹³, χ2 test). Furthermore, transcripts containing exonic sequences were significantly enriched with SIN.LV.PGK compared to SIN.LV.SF and LV.SF.LTR (9.5% vs. 5.1 ± 0.1%; p = 9.9 × 10⁻²–1.5 × 10⁻³, χ2 test; Fig. 5A).
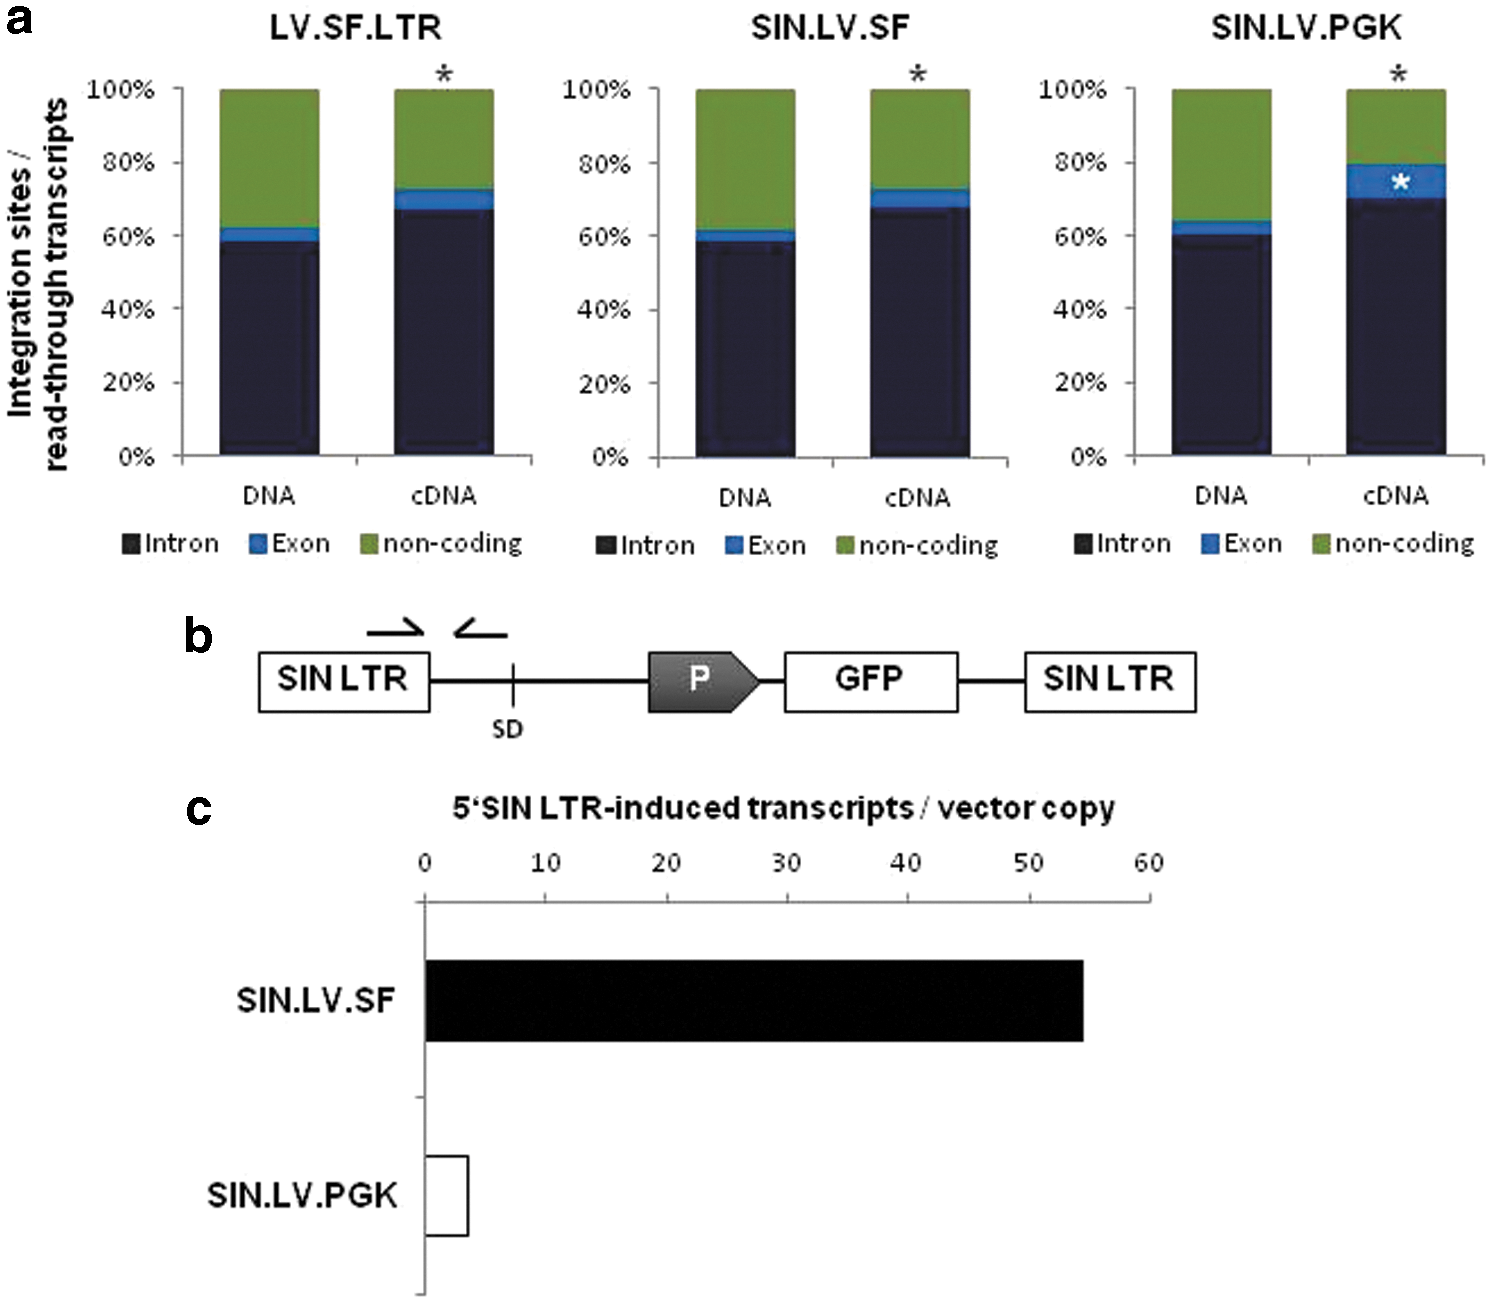
Distribution of viral–cellular read-through transcripts.
Despite the high rate of read-through transcription, only rare chimeric fusion transcripts were observed: eight with LV.SF.LTR, three with SIN.LV.SF, and none with SIN.LV.PGK (Fig. 4D). Even though LTR-induced transcription is largely abrogated with the SIN-LTR design, full-length vector transcripts have been observed with both gammaretro- and lentiviral SIN vectors. 36,37 Since the lentiviral splice site is located upstream of the internal promoter, the fusion transcripts detected in the SIN.LV.SF setting might result from LTR-directed or cellular read-through transcription.
To test whether these transcripts could arise from an increased SIN LTR residual activity due to the potent SFFV promoter at the internal position, the amount of LTR-induced transcripts generated by SIN.LV.SF and SIN.LV.PGK was quantified by qRT-PCR. With this approach, it was found that full-length transcripts are 16 times more frequent with the strong SFFV promoter than with the weak PGK promoter (Fig. 5B and C). To assess the contribution of vector-induced fusion transcripts to the biological safety of lentiviral vectors, an in vitro genotoxicity assay was employed. Herein, the genotoxic potential of a vector is measured by the functional transformation of a factor-dependent cell line. 29 The transformation potential of the LV.SF.LTR vector was determined at 19.5 ± 3.8 × 10⁻⁶ per vector copy, whereas the ones of the SIN vectors were 20 and even 50 times lower (1.0 ± 0.5 × 10⁻⁶ for SIN.LV.SF and 0.4 ± 0.4 × 10⁻⁶ for SIN.LV.PGK; Fig. 6A). For each vector, several transformed colonies were randomly picked and expanded for further functional analyses (12 LV.SF.LTR, 12 SIN.LV.SF, and all [3] SIN.LV.PGK colonies). In total, 55 LV.SF.LTR, 71 SIN.LV.SF, and 30 SIN.LV.PGK integrants were identified, with at least one being located in the 5′ region of the growth hormone receptor (Ghr) in all LV.SF.LTR and 83% of SIN.LV.SF colonies, but not in SIN.LV.PGK colonies. Ghr fusion transcripts were shown to be the major cause for the functional transformation of IL-3-dependent cells by lentiviral vectors. 38,39 The transcriptome-wide analysis of fusion transcripts using the optimized nrLAM-PCR protocol on cDNA revealed that almost 60% of LV.SF.LTR, 25% of SIN.LV.SF, and 3% of SIN.LV.PGK integrants led to the formation of fusion transcripts (Fig. 6B). Genes involved in fusion transcript formation mainly played a role in protein synthesis, cell proliferation, and signal transduction. Ghr fusion transcripts were detected in all LV.SF.LTR (12/12) and some SIN.LV.SF (4/12) colonies (Fig. 6C). These transcripts were generated from integrants located within a 25 kb window directly upstream of exon 2, while integrants >25 kb upstream or downstream of exon 2 did not give rise to fusion transcripts. Gene expression analysis showed an upregulation of Ghr in almost all colonies transduced with the two SFFV vectors. In contrast, SIN.LV.PGK colonies did not show any upregulation (Fig. 6D).
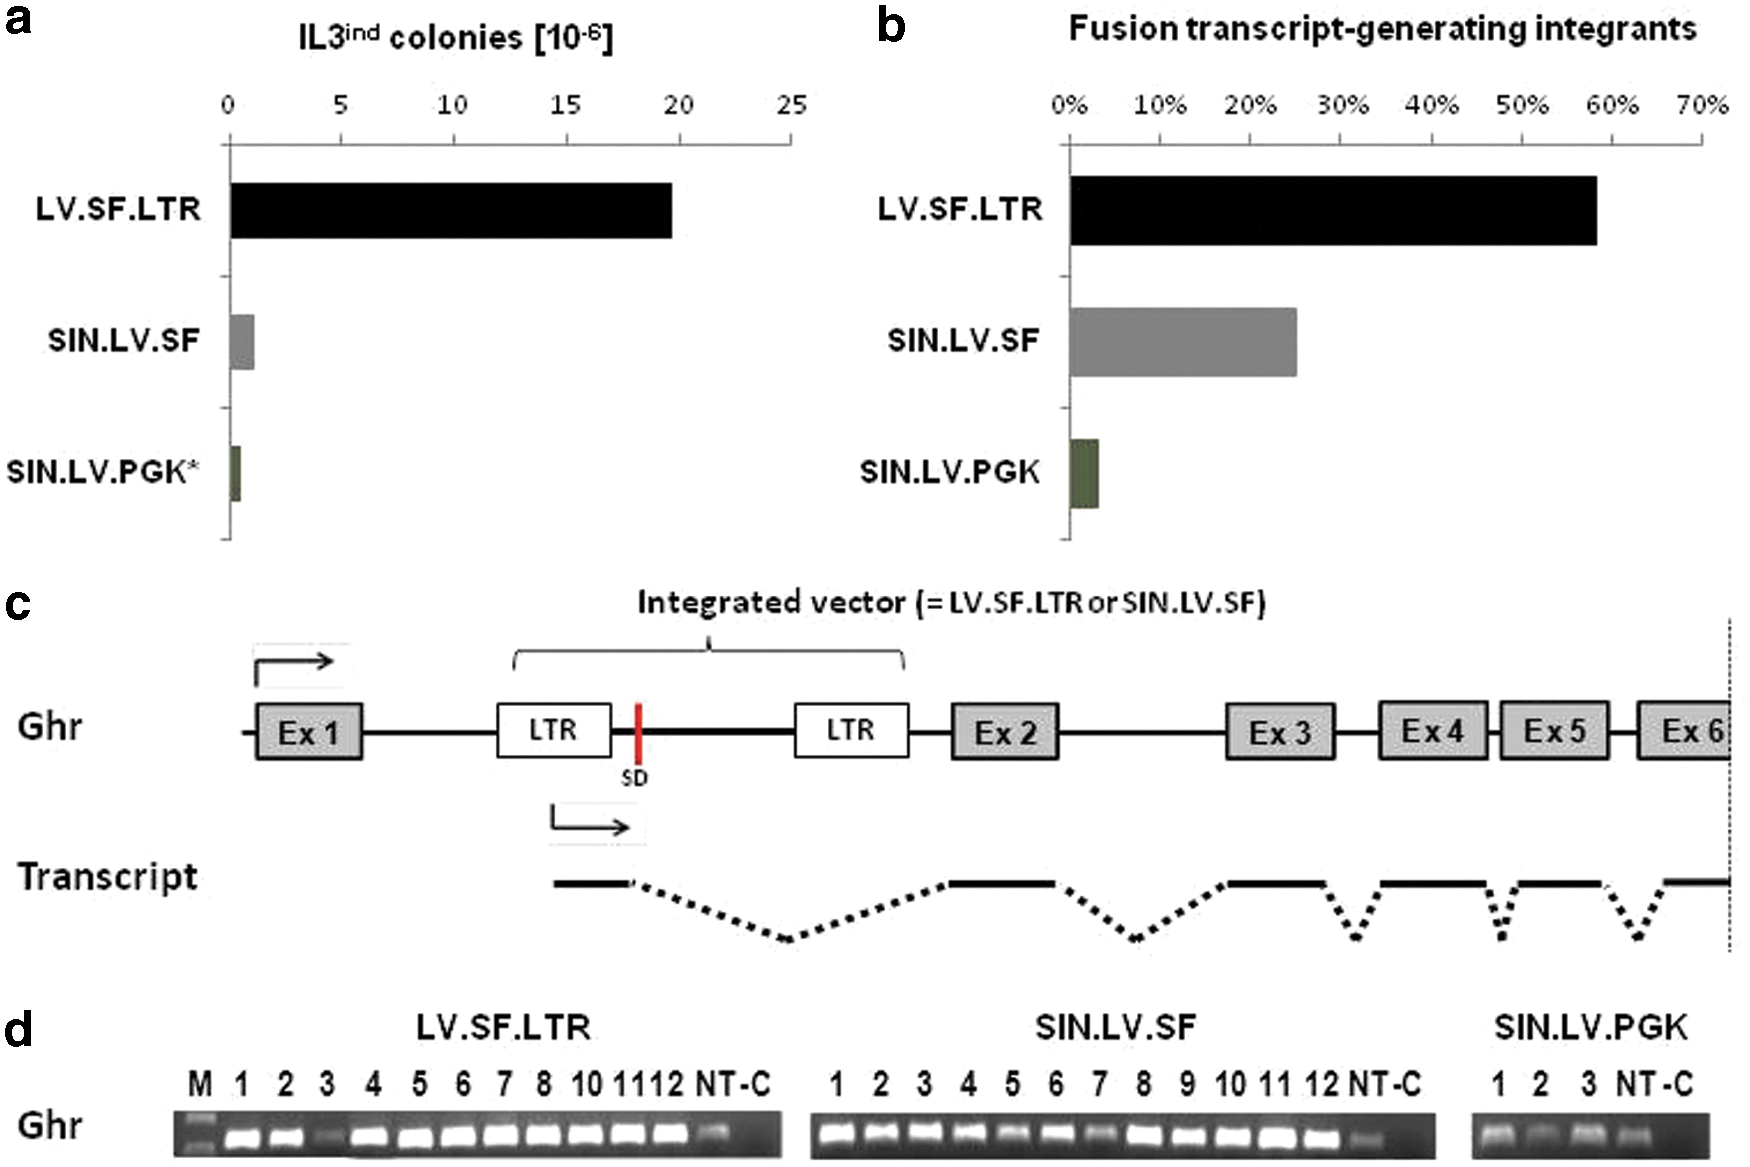
Genotoxic potential of lentiviral vectors.
Discussion
Vector integration is the key event for the success of retroviral gene therapy and its long-lasting therapeutic effect, but also represents a potential cause for the development of adverse events due to insertional mutagenesis. Major determinants for the genotoxic profile of retroviral vectors are the site of integration and their ability to deregulate the expression of surrounding genes. This study investigated a series of lentiviral vectors using functional integrome analysis to determine the influence of vector structure elements, such as LTR configuration or the promoter, on target site selection, clonal development, transcription of cellular genes, and the consequences for vector biosafety.
So far, standard in vitro IS analyses concentrate on late time points after transduction, thus hampering the determination of the vector's initial target site selection preferences and the ability to differentiate them from integration features that are rather due to clonal selection. With this aim in mind and to enable the detection of potential clonal selection processes taking place over time, it is mandatory to analyze early time points when no remarkable clonal selection has yet occurred. This study scrutinized the integration profiles of lentiviral vectors differing in LTR configuration, promoter, and presence of a transgene in hematopoietic stem and progenitor cells (HSPCs) 48 h after transduction. The results show that LTR configuration and the presence of a transgene play minor roles during target site selection. In contrast, early IS profiles are highly influenced by the presence of a promoter, independently of its nature and activity. The preferential integration of MLV-derived vectors in gene regulatory regions is mediated by the binding of transcription factors to the pre-integration complex and cellular transcription factor binding sites (TFBS), while human immunodeficiency virus type 1 (HIV-1)-derived vectors do not show such a bias, but rather an underrepresentation of TFBS around the IS. However, this negative bias is removed when the HIV-1 U3 is replaced by the U3 region of MLV. 40 Altogether, this suggests that ectopic promoter sequences have a major impact on the target site selection of lentiviral vectors, most likely due to transcription factor-mediated interactions, such as described for LEDGF, which are not present in promoter-less or WT HIV-1 LTR containing vectors.
When the early 48 h IS profiles were compared with later time points at 1,460 days, an obvious over time clonal selection of cells transduced with the complete SFFV LTR-driven lentiviral vector was observed. In addition, high-resolution IS analysis and comparative CIS analysis also demonstrated that a SIN vector with an internal strong (SFFV) promoter may have a certain albeit low potential to induce clonal selection. In agreement with this, the SIN.LV.SF vector exhibited a higher genotoxic potential when compared to the SIN.LV.PGK in an in vitro genotoxicity assay. 29 Overall, the clustering of IS profiles determined by comparative CIS analysis occurred according to the promoter and its respective activity in HSPCs. This indicates the decisive role of promoter strength and/or nature even in context of SIN LTR vectors. The genotoxic potential of LV.SF.LTR was also illustrated in a murine mouse model, leading to an acceleration of tumor onset and biased integration site profiles in vivo and in vitro. This study shows that, if any, SIN.LV.SF vector's genotoxicity is substantially reduced and below detection limit, probably due to background oncogenesis of Cdkn2a–/– HSPCs and the too short (2 weeks) in vitro culture. 19 Here, it has been shown that the prolonged culture of transduced cells and meticulous comparative integration site analysis enable the detection of even subtle clonal selection processes in bulk cell populations and thus may provide a good prospect for early biosafety measurements of new therapeutic vectors.
Using nrLAM-PCR based transcriptome analysis of unselected vector-transduced bulk cells, the study shows that both full and SIN LTR vectors generate substantial amounts of read-through transcripts, though the frequency is clearly reduced with SIN LTR configurations and weak internal promoter usage. As 70–80% of the termination signals reside within the first 124 nucleotides of the HIV-1 transcriptional control region overlapping enhancer and promoter sequences, 41 the high read-through activity of a full SFFV LTR-driven vector observed in this study points out that an ectopic U3 region, albeit placed within the LTR, cannot completely compensate for the deletion of these HIV-1 U3 inherent termination signals.
Most read-through transcripts were detected within gene-coding regions. Genomic sequences and/or chromatin structure can influence the expression of the vector. 42 The open form of the chromatin and the increased transcriptional activity in the area of actively transcribed genes might lead to higher levels of viral–cellular read-through transcripts. Another possibility is the mechanism of differential regulation of the identical 5′ and 3′ LTRs. In WT HIV-1, the polyadenylation signal in the 5′ LTR is suppressed by the canonical splice donor. The introduction of an intron downstream of the 3′ LTR can interfere with this regulation, thereby weakening the poly(A) site at this position. 43 In addition, the chimeric transcripts detected in this setting can originate from the vector as well as from cellular genes. Read-through transcription from cellular genes therefore increases the amount of chimeric transcripts containing gene-coding sequences. With a vector harboring a weak promoter, the ratio of vector-induced transcripts is further decreased. Vector sequences within introns of cellular transcripts will be spliced out to a large extent by the normal cellular RNA processing, while vector sequences within exons will remain in the transcript. This may result in a higher ratio of exon-containing chimeric transcripts, as observed with SIN.LV.PGK.
The lack of transcriptional termination in SIN lentiviral vectors poses an increased risk of activating cellular oncogenes downstream of the viral integration site. 44 This study shows that the activity of the internal promoter has a significant impact on the incidence of chimeric read-through and fusion transcripts. Moreover, these transcripts partially contribute to the genotoxic potential of lentiviral vectors. This is in agreement with a study by Bokhoven et al., reporting that the major mechanism of mutagenesis used by lentiviral vectors involves vector-mediated aberrant splicing. 38 The identification of cryptic splice sites within the vector construct allows the recoding of these sequences and reduction of residual aberrant splicing. 45 However, aberrant transcript formation cannot be stalled completely, 26 and the viral canonical splice donor cannot be recoded due to its important role in the regulation of the termination and polyadenylation signals within the 5′ LTR. 43 Mutations in this sequence indeed lead to a drastic decrease of virus titer and viral gene expression. 46 Thus, this study concentrated its investigation of aberrantly spliced mRNAs on the canonical splice donor and surrounding cryptic splice sites. In lin– and IL-3– dependent murine cells, fusion transcripts were yielded utilizing both canonical and cryptic splice sites.
Fusions with exon-like sequences suggest the formation of new transcripts upon integration of the lentiviral vector, potentially with growth promoting features. Primary HSPCs contained only few chimeric fusion transcripts, which were solely formed under utilization of the canonical lentiviral splice donor. In contrast, up to 100% of transformed 32D clones generated aberrant transcripts. These results coincide with a study showing that the frequency of aberrant splicing, as well as the utilization of different splice sites, strongly varies, depending on the cell line and selection conditions. 27 The accumulation of aberrant transcripts in the cell is, to some extent, prevented by nonsense-mediated mRNA decay (NMD). 27 Indeed, despite high frequencies of read-through transcription, spliced chimeric transcripts were hardly detected.
It was found that the activity of the internal promoter in SIN vectors critically impacts the incidence of read-through and fusion transcripts. This is likely due to the higher transcription rate conferred by a strong promoter such as SFFV. With the increasing amount of transcripts that have to be processed, the probability of a mistake in this process, for example the recognition of termination and splice signals, rises. Yet, an additional factor has to account for the differential formation of viral-cellular fusion transcripts using splice sites upstream of the internal promoter. In an in vitro genotoxicity assay, an internal SFFV enhancer/promoter was shown to increase the expression of an intact lentiviral 5′ LTR, leading to higher transformation rates compared to a vector without an internal promoter. 39 Although the promoter sequences are deleted from the LTR in SIN vectors, a residual promoter activity exists within the leader region, resulting in full-length transcripts. 36 This study shows for the first time that this residual activity of the 5′ SIN LTR is influenced by the activity of the internal promoter, resulting in a higher amount of aberrantly spliced viral–cellular transcripts. Nevertheless, a portion of the transcripts detected in this experiment might also be the result of cellular read-through transcription, as previously suggested. 26
The assessment of the genotoxic potential confirmed the importance of the LTR configuration and internal promoter and their impact on genotoxicity via the formation of viral–cellular transcripts. The quantitative analysis of transformed 32D colonies showed that the proportion of integrants generating fusion transcripts is clearly reduced in SIN vectors and even further in a SIN vector bearing a weak internal PGK promoter. Ghr fusion transcripts, which are the major cause for the functional transformation in this assay, were detected with both full and SIN LTR SFFV-containing vectors leading to its upregulation, whereas a SIN PGK vector did not result in the deregulation of gene expression.
The data demonstrate the high potential of high-resolution integration site analysis of in vitro cultured bulk cells. The study shows that functional vector elements contribute to the initial target site selection of lentiviral vectors as well as to the later over time clonal development. Above that, the incidence of chimeric transcripts and the genotoxic potential are strongly influenced by the vector design, in particular by LTR configuration and promoter. It is concluded that, also in the context of SIN vectors, powerful promoters should be avoided or at least be restricted to the lineages in which high transgene expression is required.
Footnotes
Acknowledgments
Funding was provided by the European Commission's 7th Framework Program through contracts FP7-HEALTH-FS-2009-222878-PERSIST, FP7-HEALTH-2012-INNOVATION-1-305011-Net4CGD, FP7-HEALTH-F5-2012-305421-EUROFANCOLEN, and the NC3R CRACK IT Challenge 21: InMutaGene. The authors thank the DKFZ Genomics and Proteomics Core Facility.
Author Disclosure
M.S. and C.v.K. are co-founders of GeneWerk GmbH. R.F. and M.S. are part-time employers and C.B. is a full-time employee of GeneWerk GmbH. S.J.S., D.C., E.G., and I.G.F. have no competing financial interests to disclose.
References
Supplementary Material
Please find the following supplemental material available below.
For Open Access articles published under a Creative Commons License, all supplemental material carries the same license as the article it is associated with.
For non-Open Access articles published, all supplemental material carries a non-exclusive license, and permission requests for re-use of supplemental material or any part of supplemental material shall be sent directly to the copyright owner as specified in the copyright notice associated with the article.