
Abstract
Enhanced in vivo expansion, long-term persistence of chimeric antigen receptor T (CART) cells, and efficient tumor eradication through these cells are linked to the proportion of less-differentiated cells in the CART cell product. Retronectin is well established as an adjuvant for improved retroviral transduction, while its property to enrich less-differentiated T cells is less known. In order to increase these subsets, this study investigated the effects of retronectin-mediated T-cell activation for CD19-specific CART cell production. Peripheral blood mononuclear cells of healthy donors and untreated chronic lymphocytic leukemia (CLL) patients without or with positive selection for CD3+ T cells were transduced with a CD19.CAR.CD28.CD137zeta third-generation retroviral vector. Activation of peripheral blood mononuclear cells was performed by CD3/CD28, CD3/CD28/retronectin, or CD3/retronectin. Interleukin-7 and -15 were supplemented to all cultures. Retronectin was used in all three activation protocols for retroviral transduction. Expansion was assessed by trypan blue staining. Viability, transduction efficiency, immune phenotype, and cytokine production were longitudinally analyzed by flow cytometry. Cytotoxic capacity of generated CART cells was evaluated using a classical chromium-51 release assay. Retronectin-mediated activation resulted in an enrichment of CD8+ cytotoxic CART cells and less-differentiated naïve-like T cells (CD45RA+CCR7+). Retronectin-activated CART cells showed increased cytotoxic activity. However, activation with retronectin decreased viability, expansion, transduction efficiency, and cytokine production, particularly of CLL patient-derived CART cells. Both retronectin-mediated activation protocols promoted a less-differentiated CART cell phenotype without comprising cytotoxic properties of healthy donor–derived CART cells. However, up-front retronectin resulted in reduced viability and expansion in CLL patients. This effect is probably attributed to the retronectin-mediated activation of B cells with prolonged CLL persistence. Consequently, CART cell expansion and generation failed. In summary, activation with retronectin should be performed with caution and may be limited to patients without a higher percentage of tumor cells in the peripheral blood.
Introduction
C
CART cell therapy has evolved in recent years by targeting several steps. With regards to CAR vector design, up to four generations of CAR vectors have been developed using or combining different co-stimulatory domains such as OX40 (CD134), 4-1BB (CD137), and/or CD28 in order to enhance T-cell activation. 11 –13 Preconditioning prior to CART cell transfusion dramatically enhances engraftment rates of CART cells. 14 Moreover, the composition of the CART cell product has been shown to be crucial for successful treatment and long-term disease control. 15,16 Optimization of CART cell production by modulating T-cell activation and culture conditions improves treatment outcome. The phenotype of transferred T cells influences antitumor activity. In particular, less-differentiated T cells have been associated with long-term in vivo persistence and engraftment. 16,17
The activation of T cells represents an essential and indispensable step in CART cell generation. Optimal activation should lead to adequate expansion and proliferation of T cells. Activation by anti-CD3 and anti-CD28 antibodies constitutes an established strategy to stimulate peripheral blood mononuclear cells (PBMCs) for sufficient activation and expansion. 18,19 Another activation strategy involves the use of the recombinant human fibronectin fragment retronectin. Retronectin is better known as an adjuvant for efficient gene transfer with retroviral vectors. Less known is its application for T-cell activation, given that it can promote the presence of less-differentiated T-cell subsets. 20,21 Furthermore, cytokine combinations used for CART cell culture can influence the composition of the final T-cell product. The combination of interleukin (IL)-7 and IL-15 for propagation has been shown to enhance the survival and maintenance of less-differentiated T cells compared to IL-2. 22 –24 The optimal production and composition of the CART cell product is not yet clearly defined.
This study investigated the impact of retronectin-based T-cell activation for CART cell production with PBMCs derived from healthy donors (HDs) or untreated CLL patients. Transduction was performed with a CD19-specific third-generation retroviral vector from the authors' clinical CD19 CART cell trial (EudraCT 2016-004808-60). The effect of three activation protocols (CD3/CD28, CD3/CD28/retronectin, and CD3/retronectin) together with IL-7/IL-15 was assessed. The CD3/CD28 activation together with IL-7/IL-15 is the same protocol as used in the clinical trial. The focus of this study was to determine the effects of retronectin-mediated cell activation on viability and expansion as well as T-cell subsets in the CART cell product.
Methods
Primary cells
Peripheral blood (PB) samples from three HDs and six untreated patients with CLL were obtained at the University Hospital Heidelberg (Heidelberg, Germany). One CLL patient was Binet A, and five CLL patients had a treatment indication (Binet C) but did not receive lymphodepleting treatment directly before sample acquisition. One patient relapsed after initial treatment with rituximab-bendamustine. The remaining patients were treatment naïve. Mononuclear cells were purified by Ficoll density gradient (Linaris, Dossenheim, Germany) and cryopreserved. The research was approved by the Ethics Committee of the University of Heidelberg (S-254/2016).
Cell lines
CD19-positive Daudi cells (Burkitt lymphoma) and CD19-negative K-562 cells (chronic myeloid leukemia in blast crisis) were obtained from the DSMZ (German Collection of Microorganisms and Cell Cultures, Braunschweig, Germany) and cultured in RPMI 1640 (Thermo Fisher Scientific, Waltham, MA) supplemented with 2 mM L-glutamine (Thermo Fisher Scientific) and 10% heat-inactivated fetal bovine serum (FBS; Thermo Fisher Scientific) at 37°C and 5% CO2.
Production of retroviral vectors
CD19.CAR.CD28.CD137zeta third-generation retroviral vector was produced by co-transfecting 293T cells with the specific retroviral vector plasmid (3.75 μg), PegPam3 plasmid containing gag-pol (3.75 μg), and RDF plasmid containing the envelope (2.5 μg). Plasmids were kindly provided by Prof. Malcolm Brenner (Baylor College of Medicine, Houston, TX). The transfection protocol was kindly provided by Dr. Angelica Loskog (Uppsala University, Uppsala, Sweden). 13 Culture of 2.0 × 10 6 293T cells was performed overnight in 100 mm tissue culture–treated dishes (Sarstedt, Nümbrecht, Germany) in Iscove's modified Dulbecco's medium (IMDM) GlutaMax-I (Thermo Fisher Scientific) supplemented with 10% FBS (Thermo Fisher Scientific) and 0.1% sodium pyruvat (Thermo Fisher Scientific). The following day, a mixture of 470 μL IMDM and 30 μL GeneJuice transfection reagent (Merck Millipore, Burlington, MA) was prepared and added to the plasmid mix. After 15 min of incubation at 37°C and 5% CO2, GeneJuice/IMDM/plasmid mix was added to the 293T cells in the 100 mm tissue culture–treated dish. After 48 h of incubation at 37°C and 5% CO2, retroviral supernatant was harvested, and 11 mL of fresh completed IMDM was added. After another 24 h of incubation, the supernatant was harvested again. Harvested supernatants were frozen at −80°C for storage.
CD19-CART cell generation and expansion
PBMCs were cultured in 50% RPMI 1640 (Thermo Fisher Scientific) and 50% Clicks Medium (EHAA; Irvine Scientific, Santa Ana, CA) with 10% FBS (Thermo Fisher Scientific) and 2 mM L-glutamine (Thermo Fisher Scientific). PBMCs of all three HDs and of all six CLL patient samples were activated without previous depletion of B cells or selection for T cells. Additionally, PBMCs derived from three CLL patients were selected for CD3+ T cells by magnetic-activated cell sorting (MACS; Miltenyi Biotec, Bergisch Gladbach, Germany). Activation of PBMCs was performed for 3 days on non-treated 24-well plates (Corning, Wiesbaden, Germany) coated overnight with three different protocols: (1) 1 μg/mL anti-human CD3 (OKT3; Biozol, Eching, Germany) and 1 μg/mL anti-human CD28 (Biozol); (2) 1 μg/mL OKT3, 1 μg/mL anti-human CD28, and 7 μg/mL retronectin (Takara Bio, Shiga, Japan); and (3) 1 μg/mL OKT3 and 7 μg/mL retronectin. On day 2, culture medium was supplemented with 4.4 × 10 3 IU/mL IL-7 (R&D Systems, Minneapolis, MN) and 100 IU/mL IL-15 (R&D Systems). On day 3, activated cells were transferred to non-treated 24-well plates (Corning) coated overnight with 7 μg/mL retronectin. Retronectin-mediated transduction was performed for all three activation protocols. Next, 5 × 10 5 cells in 0.5 mL culture medium were transduced with 1.5 mL CD19.CAR.CD28.CD137zeta third-generation retroviral supernatant. CART cells were cultivated over 15 days in the presence of IL-7 and IL-15. Change of culture medium and fresh addition of cytokines, as well as adaption of the cell concentration to 1 × 10 6 /mL, was performed on days 7, 10, and 14. Cell cultivation was performed in 24-, 12-, or 6-well tissue culture–treated plates (Sarstedt) and in T25 or T75 tissue culture–treated flasks (Sarstedt), depending on expansion and total cell numbers. On day 14, cells were partly cryopreserved in FBS (Thermo Fisher Scientific) and 10% dimethyl sulfoxide (Sigma–Aldrich, Taufkirchen, Germany).
Flow cytometry
Analysis was effective on a BD LSRII platform (BD Biosciences, Franklin Lakes, NJ). Longitudinal phenotypic analysis was performed on days 0, 2, 3, 7, 10, 14, and 15 of cell cultivation. Dead cells were excluded with the LIVE/DEAD™ fixable near-infrared dead cell stain kit (APC-Cy7; Thermo Fisher Scientific). The anti-human goat F(ab)2 IgG (H + L) PE antibody (Dianova, Hamburg, Germany) was used to identify CD19-specific CAR expression. The following antibodies were used for immunophenotyping of surface markers: anti-CD95-PE-Cy5, anti-CD20-BV510, anti-CD8-PerCP, anti-CD8-Pacific Blue, anti-CD45RA-APC, anti-CXCR3-Alexa Fluor 488, anti-CCR6-PE-Cy7, anti-CCR4-APC, anti-Tim-3-BV421, and anti-PD-1-Alexa Fluor 488 (all from Biolegend, San Diego, CA), anti-CCR7-PE-Cy7, anti-CD3-PE eFluor 610, anti-CD4-Alexa Fluor 700, anti-CD62L-eFluor 450 (all from eBioscience, San Diego, CA), and anti-CD3-V500 (BD Biosciences). For intracellular cytokine staining, cells were co-cultured with CD19-positive Daudi cells for 6 h in 96-well U-bottom microplates (Greiner BioOne, Frickenhausen, Germany), and Brefeldin A (Biolegend) was used for intracellular cytokine retention. Fixation and permeabilization was performed with fix/perm solution and permeabilization buffer of the FoxP3 staining buffer set (Miltenyi Biotec) and staining with anti-interferon (IFN)-γ-Alexa Fluor 488 (Biolegend) and anti-tumor necrosis factor (TNF)-α-BV421 (BD Biosciences). Fixation of the cells after staining was performed with Dulbecco's phosphate-buffered saline (PBS; Sigma–Aldrich) containing 1% paraformaldehyde (Morphisto, Frankfurt am Main, Germany) and 3 mM ethylenediaminetetraacetic acid (EDTA; Sigma–Aldrich). Flow cytometry data were analyzed with FlowJo software (FlowJo, Ashland, OR). Gating strategies and representative FACS blots are displayed in Supplementary Figs. S1 and S2 (Supplementary Data are available online at
Cytotoxicity assay
The cytotoxic function of CART cells was analyzed using a classical chromium-51 (51Cr) release assay. Cryopreserved CART cells were thawed and cultured overnight before performing the cytotoxicity assay. CD19-positive Daudi cells were used as target cells. CD19-negative K-562 cells served as a negative control. Cells were labeled for 2 h with 51Cr (Hartmann Analytic, Braunschweig, Germany) followed by co-culture with CART cells in 96-well U-bottom microplates (Greiner BioOne) for 4 h at 37°C and 5% CO2. Effector-to-target cell ratios of 30:1, 10:1, 3:1, and 1:1 were used. Background lysis was measured by spontaneous release of 51Cr in the presence of culture medium and the absence of CART cells. Maximum release of 51Cr was assessed by adding PBS (Sigma–Aldrich) with 1% Triton X-100 (Sigma–Aldrich) to the target cells to achieve maximum lysis. Culture supernatant was diluted with Ultima Gold liquid scintillation cocktail (PerkinElmer, Waltham, MA) and analyzed by a 1414 WinSpectral liquid scintillation counter (PerkinElmer). Every single experiment was performed in triplicate, and values were averaged. Specific lysis of the 51Cr release was calculated as percentage of maximum 51Cr release after subtracting background release.
Statistical analysis
Statistical analysis was performed using Microsoft Excel (Microsoft, Redmond, WA) and GraphPad Prism v5 (GraphPad Software, Inc., La Jolla, CA). p-Values were calculated using the parametric two-way t-test or the one-way analysis of variance with Bonferroni's multiple comparison test. p-Values <0.05 were considered as statistically significant. Graphs and tables were designed using Microsoft Excel, Microsoft Word, and Apple Keynote (Apple, Cupertino, CA). If not otherwise stated, results are presented as means ± standard deviation (SD).
Results
Influence of different activation protocols on viability, expansion, and transduction efficiency
As a prerequisite for the generation of anti-CD19 CART cells, PBMCs have to be stimulated in order to produce activated T cells (ATCs) before transduction with a CD19.CAR.CD28.CD137zeta third-generation retroviral vector. Three different activation protocols were assessed with the same culture condition supplemented with IL-7/IL-15: (1) activation with anti-CD3 and anti-CD28 antibodies (according to the clinical Good Manufacturing Practice [GMP]-grade CD19 CART cell trial currently in preparation at the authors' institution), (2) activation with anti-CD3 and anti-CD28 antibodies and retronectin, and (3) activation with anti-CD3 antibodies and retronectin.
Viability of CD3+ T cells on the day of activation, of ATCs on day 3, and of CART cells on days 7, 10, and 14 was assessed in samples from HDs and unselected CLL patients (Fig. 1A) and from CD3-selected CLL patients (Fig. 1B). For cells derived from HDs, the three activation protocols mediated the generation of similar percentages of viable T cells during the culture. At final expansion on day 14, the viability of cells activated via protocol 1 was 85 ± 3%, via protocol 2 was 87 ± 8%, and via protocol 3 was 85 ± 13%.
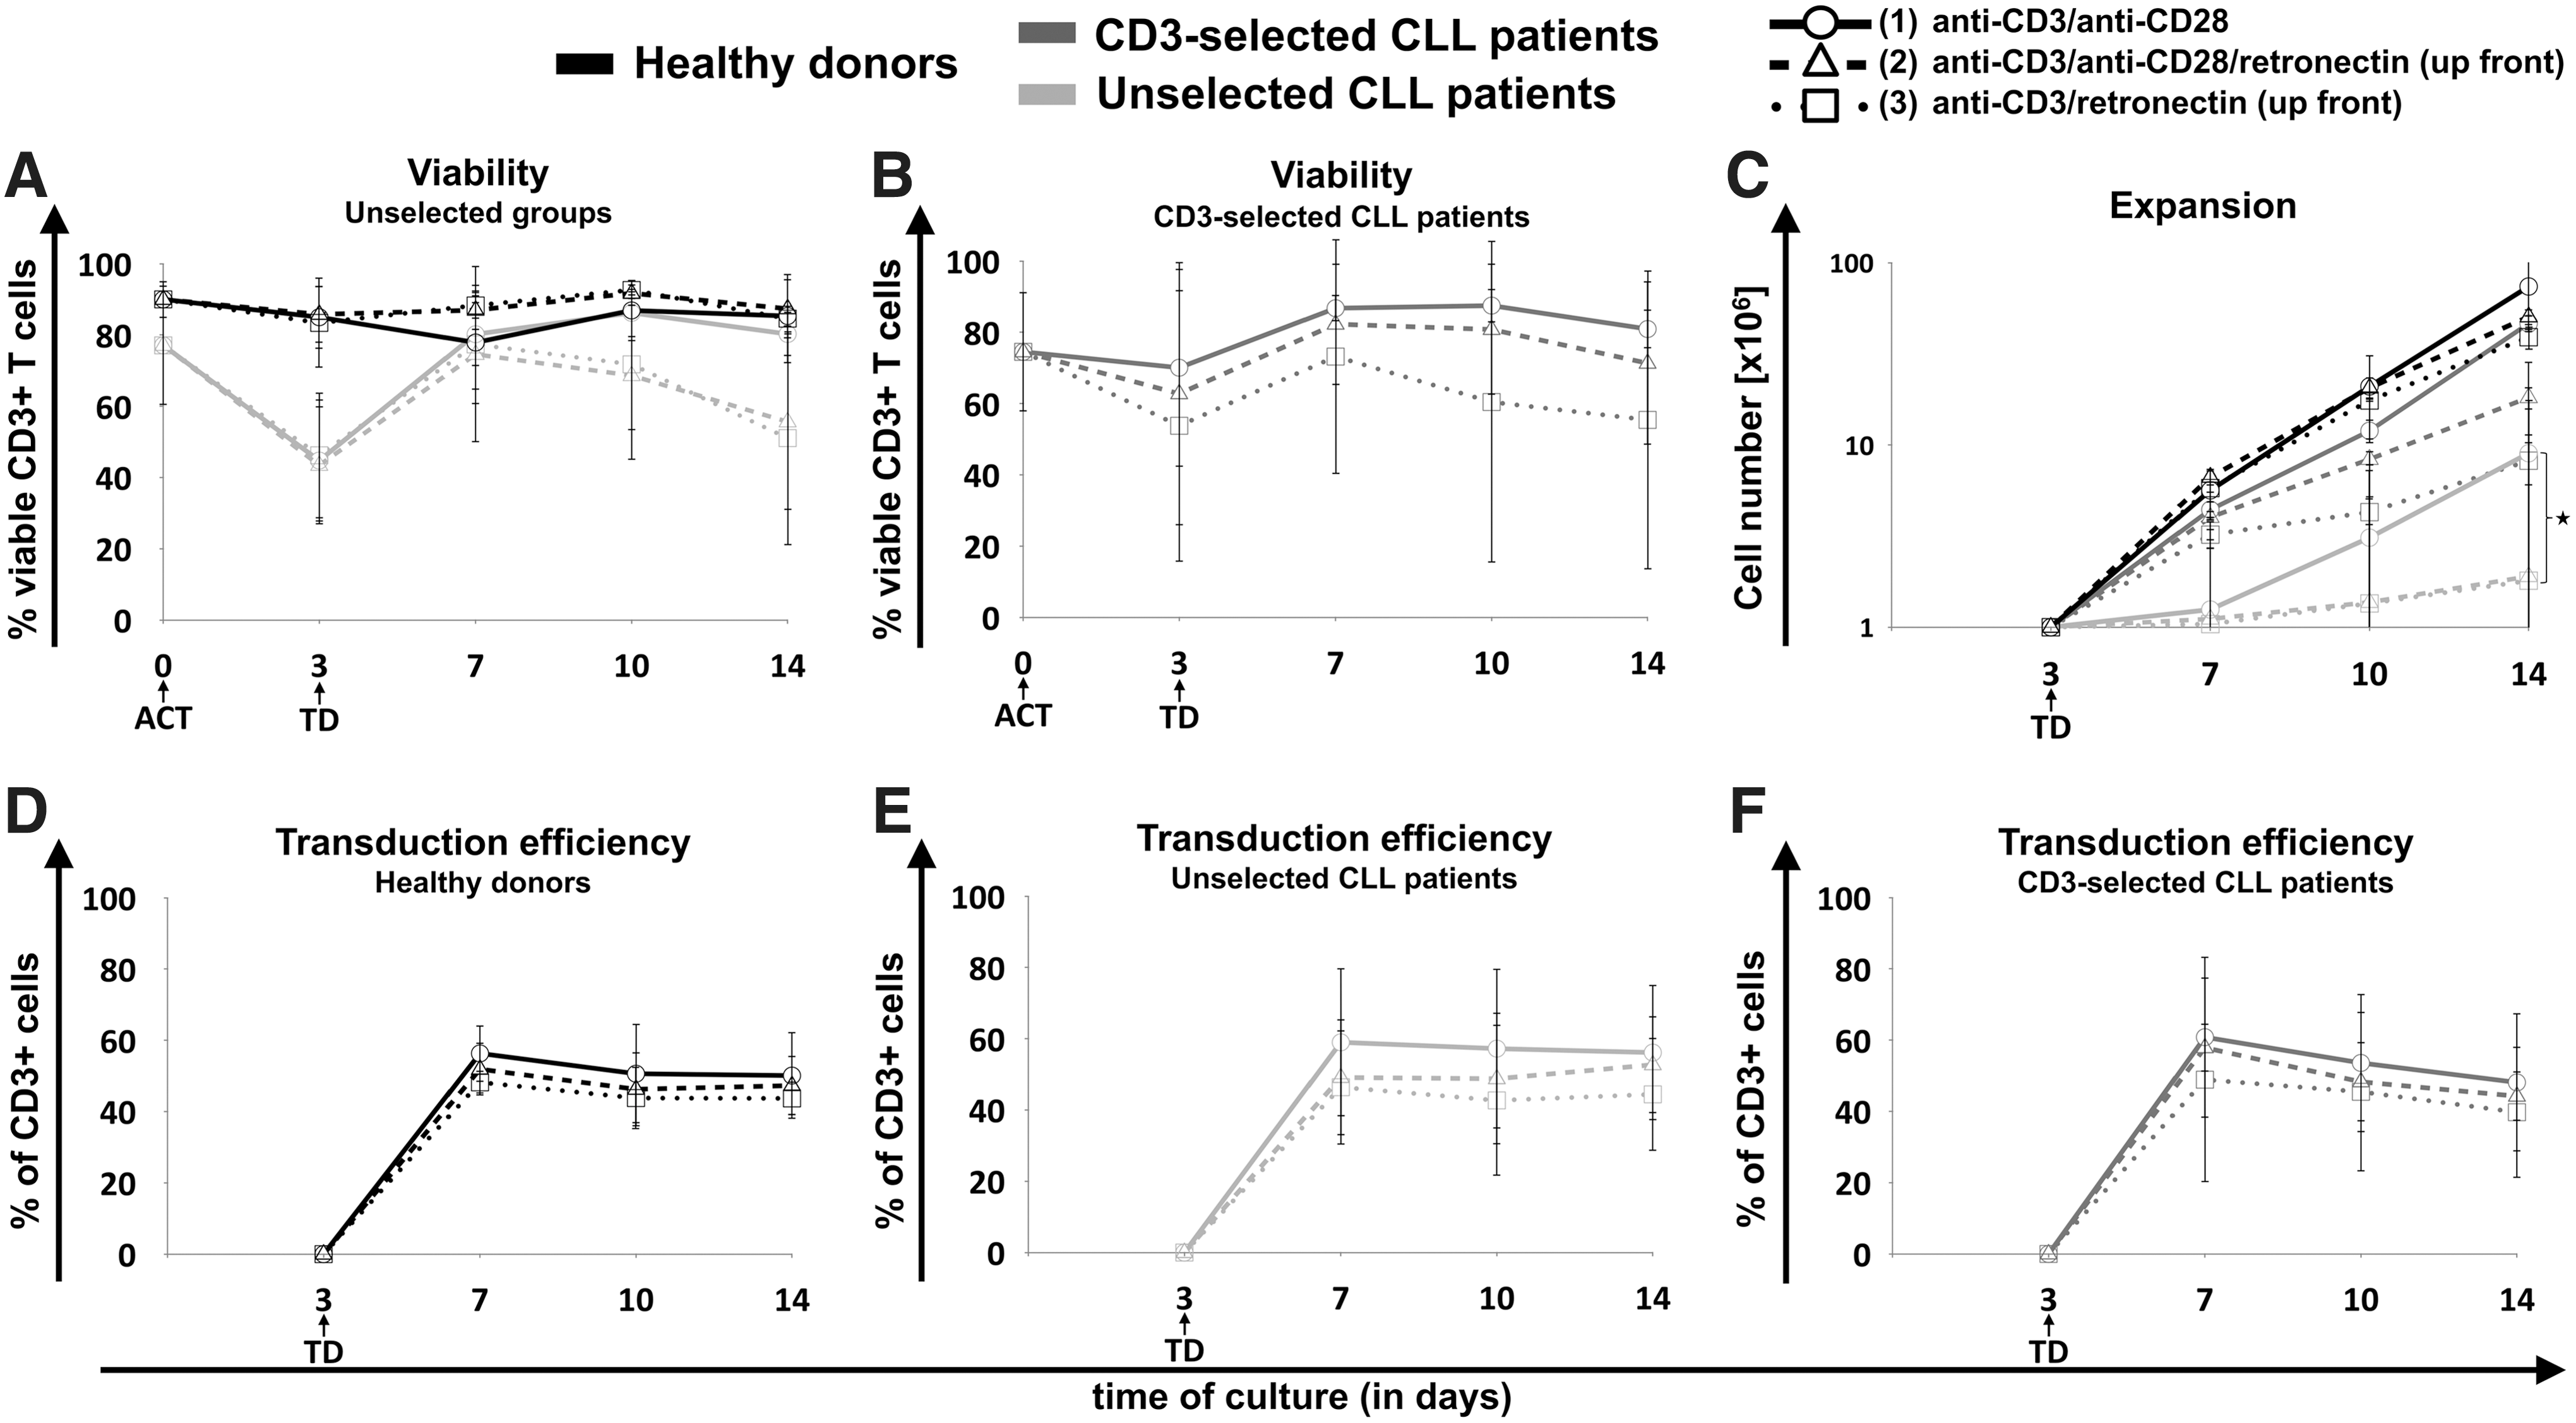
Influence of different activation protocols on viability, expansion, and transduction efficiency of chimeric antigen receptor T (CART) cells. Generation of CART cells was performed using cryopreserved peripheral blood mononuclear cells (PBMCs) from healthy donors (HDs; black lines) versus untreated chronic lymphocytic leukemia (CLL) patients with positive selection for CD3+ T cells (dark gray lines) and without preselection (light gray lines). PBMCs were activated (ACT) on day 0 for 3 days using three different activation (ACT) protocols: (1) CD3/CD28 (circles, solid lines), (2) CD3/CD28/retronectin (triangles, dashed lines), or (3) CD3/retronectin (squares, dotted lines). On day 3 retronectin-mediated retroviral transduction (TD) was performed. Viability of CD3+ T cells was assessed on days 0, 3, 7, 10, and 14 in
In contrast, in CLL patient-derived cells without preselection, the viability of cells decreased in the first days of culture independently of the applied activation. Despite an improvement of the viability in all three activation protocols after day 3, the viability of retronectin-activated cells decreased again from day 7 to day 14 of culture. In contrast, activation without retronectin increased continuously the viability of CD3+ T cells after day 7 of culture (viability on day 14 in protocol 1 vs. 2 vs. 3: 80 ± 6% vs. 56 ± 25% vs. 51 ± 30%).
CLL patient samples with positive selection for CD3+ T cells showed an improved viability on day 3 compared to unselected CLL patient samples (Fig. 1B). Additionally, the T-cell selection led to an increased viability in retronectin-activated cells at final expansion (viability on day 14 in protocol 1 vs. 2 vs. 3: 81 ± 5% vs. 71 ± 23% vs. 55 ± 42%). Accordingly, the viability of CD20+ malignant B cells continuously decreased in all activation protocols until day 14, particularly when activated with CD3/CD28 (Supplementary Fig. S3A).
Similarly, activation with CD3/CD28 mediated a significantly higher expansion of cultured cells compared to cells activated via retronectin in unselected CLL patient samples (p = 0.0024; Fig. 1C). A similar trend was seen in CD3-selected CLL patient samples (p = 0.055; Fig. 1C), whereas the cell expansion in HD-derived cells was only slightly decreased. The proliferative capacity of retronectin-treated unselected CLL samples was very low. CD3 selection significantly improved the expansion of CLL patient-derived CART cells in all activation protocols in comparison to unselected patient samples (p < 0.001). The maximum growth, accordingly the proliferative burst, of HD-derived CART cells was between days 3 and 7, followed by a diminishing proliferative capacity (Supplementary Fig. S4A). On day 14 retronectin-activated cells grew significantly slower than CD3/CD28 activated cells (p = 0.01).
Unselected CLL samples activated with CD3/CD28 showed a weaker growth in the first days of culture and reached the maximum proliferative capacity between days 10 and 14 (Supplementary Fig. S4B). In retronectin-treated CLL patient samples, the growth factor was very low during the whole production (Supplementary Fig. S4B) compared to CD3/CD28-activated cells, particularly on day 10 (p = 0.003) and on day 14 (p = 0.001). On day 17, the growth factor was in all donor types close to 1. Activation with CD3/CD28 resulted in a slight trend toward higher CD19-CAR expression in HDs (Fig. 1D) as well as unselected (Fig. 1E) and CD3-selected CLL patient cells (Fig. 1F) without reaching significance. Finally, the overall expansion of CART cells derived from HDs were significantly superior compared to unselected and CD3-selected CLL patient samples (p < 0.001 and p = 0.006).
Effect of retronectin on B cells in untreated CLL patients
At the start of culture, PBMCs of HDs contained >50% CD3+ T cells (Fig. 2A). Different activation protocols had no effect on CD3+ T cells, given that on day 3 of culture >80% of the viable cells remained CD3+. However, PBMCs from CLL patients without treatment or preselection for CD3+ T cells contained <5% CD3+ T cells within their PBMCs (Fig. 2A). Non-transduced T cells from unselected CLL patient samples revealed a similar evolution (Fig. 2A). The CD3 selection process increased the proportion of CD3+ T cells in CLL patient samples to >50% (Fig. 2B). More than 90% of collected cells were CD20+ B cells, for the most part malignant CLL cells in the unselected CLL patient samples (Fig. 2C), whereas the amount of CD20+ B cells was <40% in the CD3-selected samples (Fig. 2C). Before transduction on day 3, proportions of T cells and CLL cells remained similar to the initial PBMCs composition on day 0. After transduction, however, the cell composition started to change, and an increase of CD3+ cells and decrease of CD20+ cells was observed in unselected and CD3-selected CLL patient samples, particularly in cells activated with CD3/CD28. On day 10, approximately 30% less T cells (Fig. 2A and B) and 30% more CD20+ B cells (Fig. 2C) were observed in unselected CLL patient cells activated with retronectin compared to cells activated without retronectin. On day 14, the composition of these unselected CLL patient-derived CART cells activated with CD3/CD28 reached a similar subset composition as HD-derived CART cells. In contrast, CD3-selected patient-derived T cells activated with CD3/CD28 reached a similar subset composition as in HDs already on day 7. Retronectin-based activation, in contrast, mediated cell compositions comprising high levels of CD20+ B cells until the end of expansion on day 14. The T-cell selection process promoted lower levels of CD20+ B cells. However, malignant B cells were also persistent in retronectin-activated CLL patient samples until day 14. Non-transduced T cells of unselected CLL patients cultured under the same conditions showed similar development (Supplementary Fig. S3B).

Impact of retronectin-mediated activation on T cells and B cells. Development of CD3+ T cells as percentage of all viable cells was determined on day 0 in PBMCs, on days 2–3 in activated T cells (ATCs), and on days 7, 10, and 14 in transduced CART cells of HDs (n = 3; black lines) versus untreated CLL patients without preselection (n = 3; light gray lines)
Evolution of cytotoxic T cells and T helper cells during CART cell production
HD and CLL patient-derived CART cells displayed a different evolution of cytotoxic T cells (CD3+/CD8+) and T helper cells (CD3+/CD4+; Fig. 2D–F). CART cells derived from HDs showed a decrease in T helper cells after transduction and an increase in cytotoxic T cells, with a CD4:CD8 ratio of <1 on day 14. In contrast, the CD4:CD8 ratio of unselected CLL patient-derived CART cells remained >1 during culture with a higher T helper and lower cytotoxic T-cell proportion. Retronectin-mediated activation resulted in a slight trend toward an increased amount of cytotoxic CART cells and decreased amount of T helper CART cells in both HDs and unselected CLL patients (Fig. 2D and E) on day 14 of culture. This subtle effect was only prominent in retronectin-activated groups at the end of the production process. A stronger retronectin-mediated decrease of T helper cells (on day 10 in protocol 1 vs. 2 vs. 3: 78 ± 6% vs. 69 ± 9% vs. 53 ± 13%; p = 0.046) and increase of cytotoxic T cells (on day 10 in protocol 1 vs. 2 vs. 3: 20 ± 5% vs. 29 ± 9% vs. 43 ± 12%; p = 0.056) >20% was seen in CD3-selected CLL patient samples (Fig. 2F) at the end of the culture period. In contrast to unselected CLL patient samples, the activation with retronectin could bring the CD4:CD8 ratio closer to 1, particularly when activated with retronectin and CD3.
Evolution of T-cell subpopulations during CART cell production
The phenotype of PBMCs on day 0, of ATCs on days 2–3, and of CART cells on days 7, 10, and 14 was analyzed in order to assess the influence of different activation protocols on the development of different T-cell subpopulations. CD45RA and CCR7 were used for evaluation of the T-cell differentiation status: naïve-like T cells (TN) were defined as CD45RA+CCR7+, central memory-like T cells (TCM) as CD45RA–CCR7+, effector memory-like T cells (TEM) as CD45RA–CCR7–, and effector-like T cells (TEff) as CD45RA+CCR7– T cells. In particular, stem cell memory–like T (TSCM) cells have the capacity for self-renewal with stem cell-like properties and have been attributed to prolonged in vivo CART cell persistence. 25 –27 TSCM cells have a TN-like phenotype (CD45RA+CCR7+) with additional positivity for more memory-associated markers such as CD95. The evaluation of CD95 during CART cell production revealed that >95% of the cells at time of transduction were positive for CD95 and maintained the positivity during propagation (Supplementary Fig. S5). Therefore, cells with a TN-like phenotype can be considered as TSCM cells in the final CART cell product. Different T-cell activation protocols using anti-CD3 antibodies, anti-CD28 antibodies, and/or retronectin can have a significant impact on differentiation of T cells within the CART cell product. Figure 3 displays T-cell subpopulations from HD-derived cells, that is, CD3+ cells (Fig. 3A), cytotoxic T cells (CD3+/CD8+; Fig. 3B), and T helper cells (CD3+/CD4+; Fig. 3C). Following retroviral transduction, the proportion of TN-like cells dropped considerably, but started to increase after day 7 of culture. Activation with retronectin mediated significantly higher percentages of CD3+ TN cells (protocol 1 vs. 2 vs. 3: 19 ± 2% vs. 34 ± 4% vs. 36 ± 5%; p = 0.003) and of CD8+ TN cells (protocol 1 vs. 2 vs. 3: 19 ± 6% vs. 42 ± 1% vs. 46 ± 2%; p < 0.001) at final expansion on day 14. Moreover, a trend toward a lower proportion of TEff cells was shown, particularly in CD8+ TEff cells (protocol 1 vs. 2 vs. 3: 61 ± 12% vs. 43 ± 7% vs. 37 ± 11%; p = 0.06).
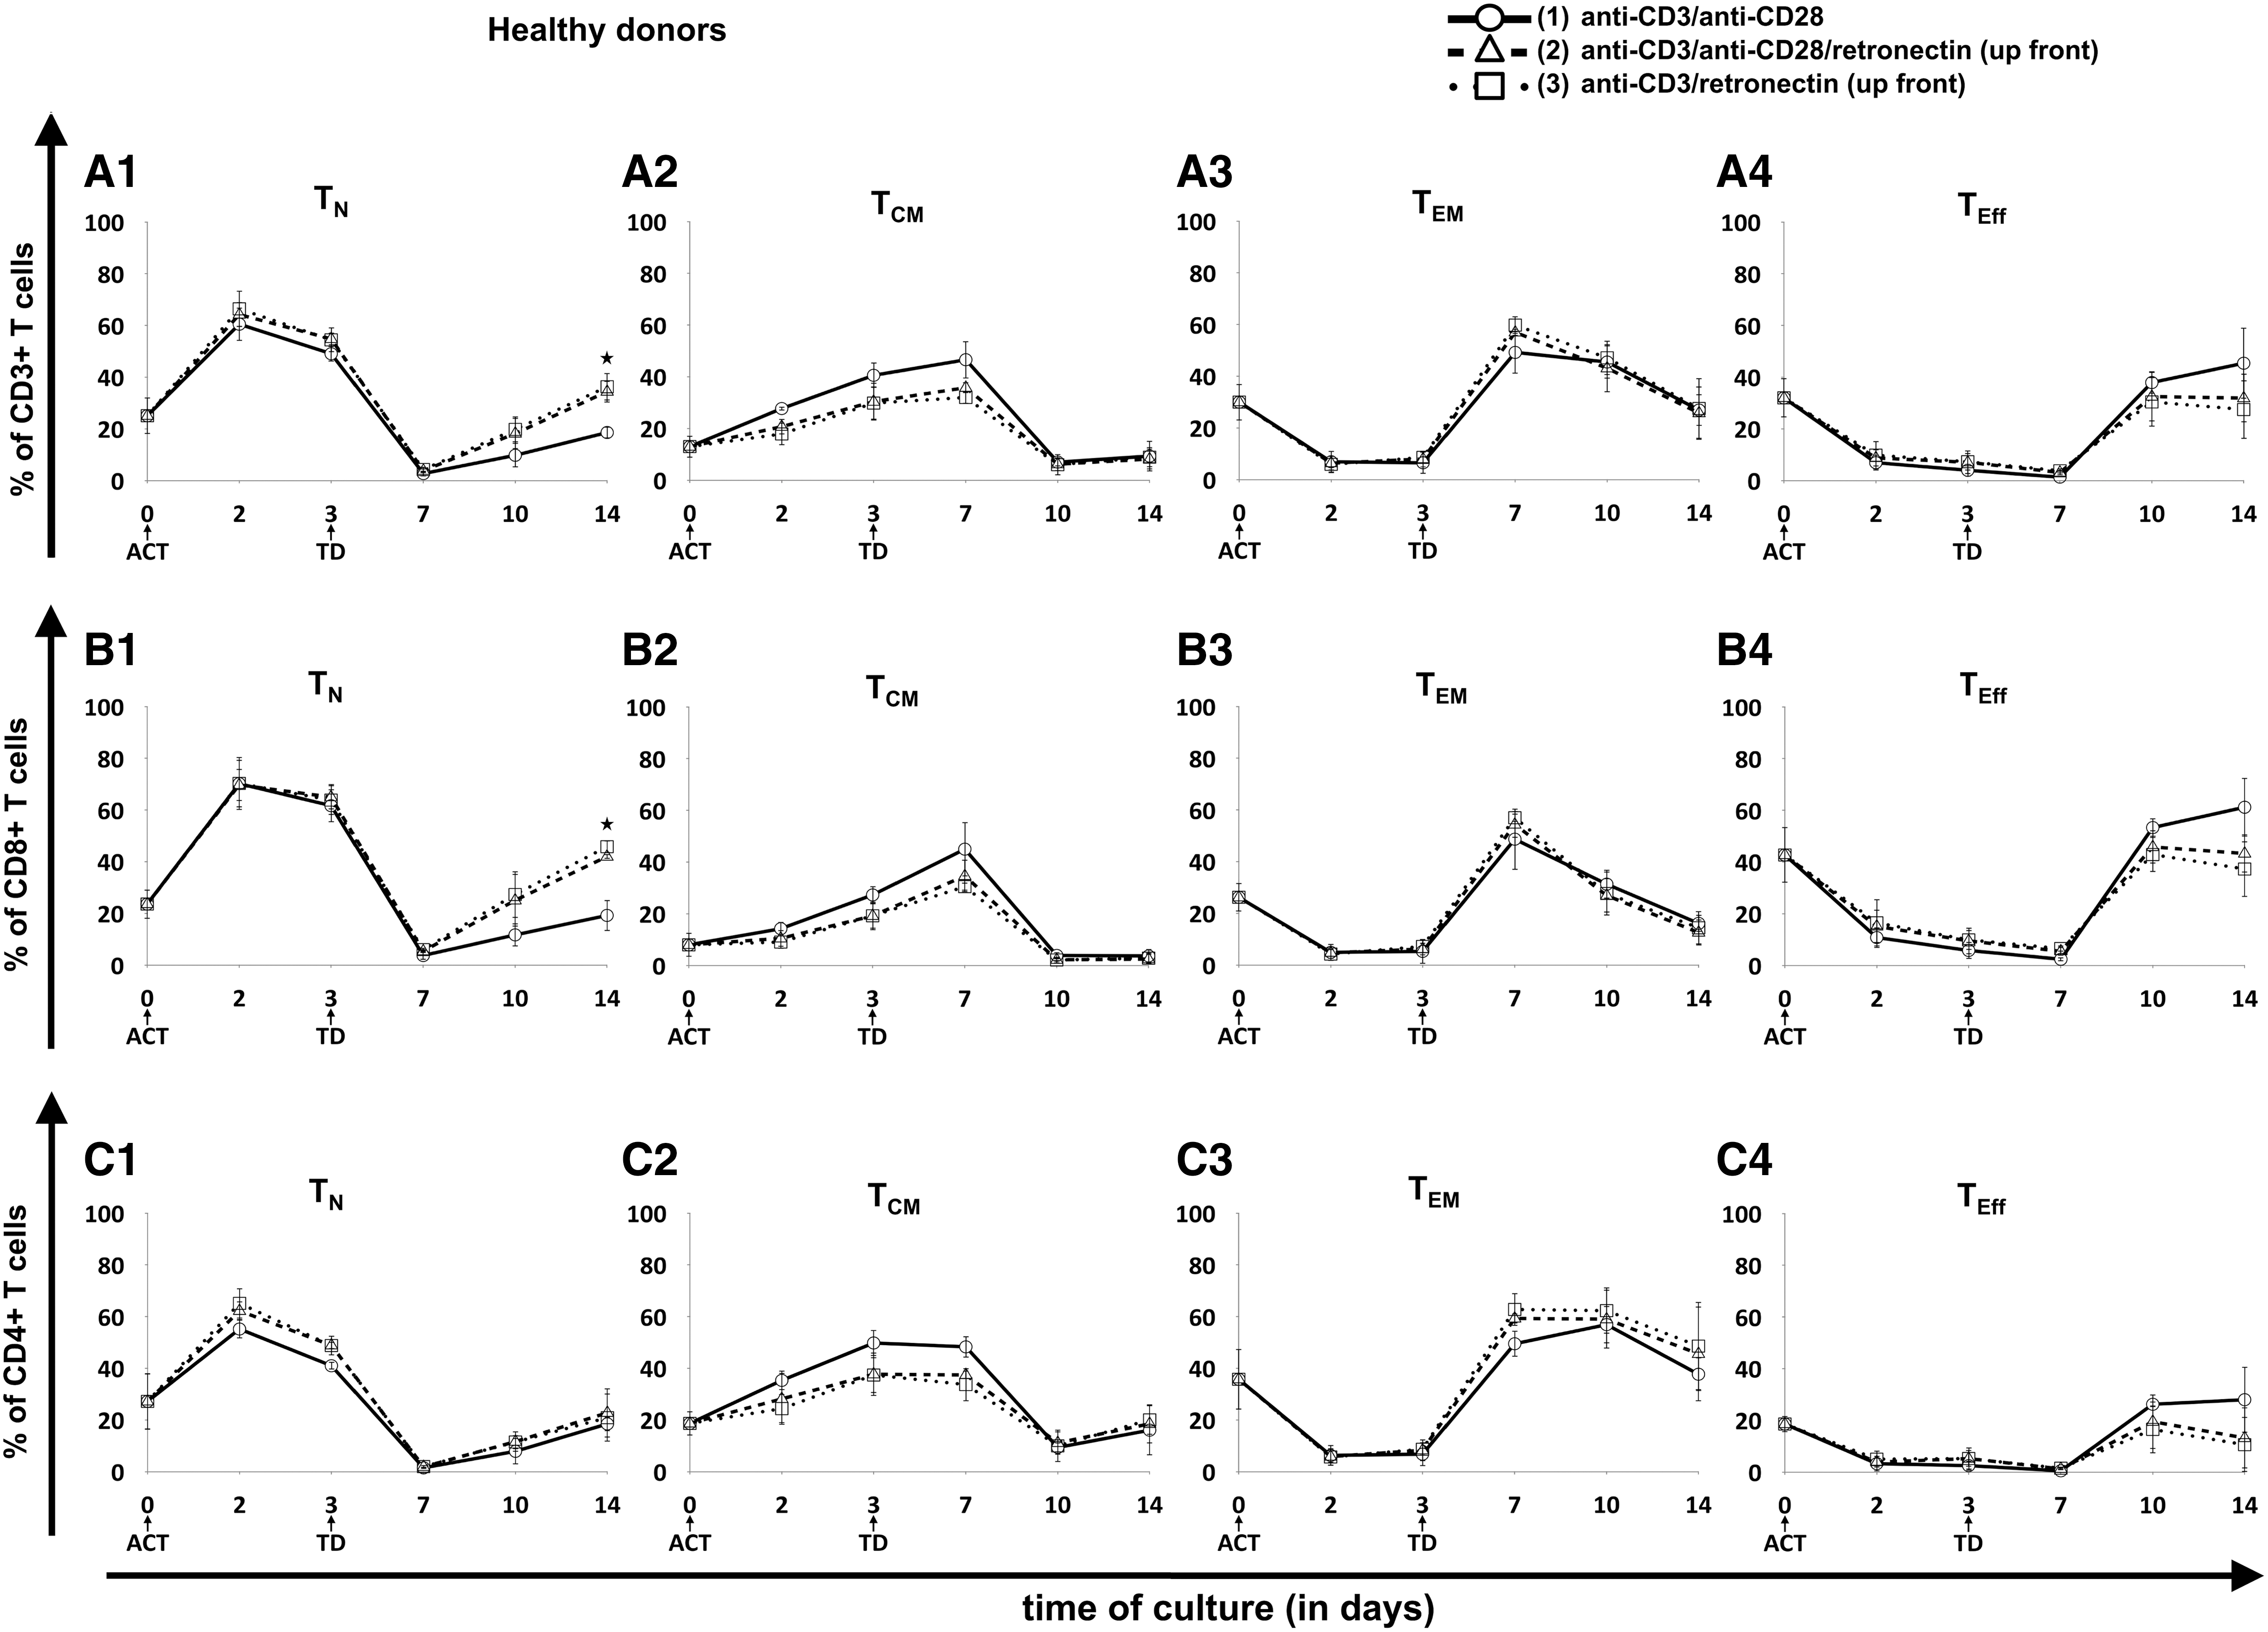
Evolution of T-cell subpopulations in healthy donor-derived CART cells. Three different T-cell ACT protocols were compared: (1) CD3/CD28 (circles, solid lines), (2) CD3/CD28/retronectin (triangles, dashed lines), and (3) CD3/retronectin (squares, dotted lines). Different subpopulations in
In contrast to HDs, CART cell production from unselected CLL patient-derived cells did not have an effect on the TN cell fraction after day 7, since TN cell levels remained <6% for all unselected patient samples (Fig. 4). Also, retronectin-based activation did not significantly influence the amount of TN cells. In CD3-selected patient samples, retronectin mediated a trend to slightly higher TN cell levels compared to unselected samples (Fig. 5), particularly in CD8+ cells on day 14 (protocol 1 vs. 2 vs. 3: 8 ± 5% vs. 16 ± 19% vs. 13 ± 15%; p = 0.068). Major differences for unselected CLL patient samples, however, were observed for the TCM cell fraction when T-cell activation lacked retronectin during the first week of cultivation, with significantly higher proportions in CD3+ (62 ± 17% vs. 41 ± 12% vs. 39 ± 15%; p = 0.03), CD4+ (64 ± 19% vs. 43 ± 16% vs. 41 ± 15%; p = 0.054), and CD8+ cells (57 ± 12% vs. 29 ± 9% vs. 30 ± 13%; p < 0.001) on day 7. A similar retronectin-mediated influence on the TCM cell fraction in the first culture days was seen in CD3-selected samples (Fig. 5), particularly in CD3+ cells (61 ± 8% vs. 37 ± 17% vs. 38 ± 3%; p = 0.068) and in CD4+ cells (62 ± 9% vs. 37 ± 19% vs. 34 ± 5%; p = 0.056) on day 7. In addition, T-cell activation with retronectin increased TEM cells on day 7 of CART cell culture in unselected and CD3-selected patient samples, particularly in CD8+ T cells (33 ± 12% vs. 60 ± 10% vs. 57 ± 11%; p = 0.001) of unselected samples. However, these effects in TCM and TEM cells nearly diminished up to day 14 of expansion. Retronectin increased TEff cells within the CART cell product on day of transduction, particularly in CD3+ T cells (13 ± 4% vs. 30 ± 12% vs. 37 ± 12%; p < 0.05) and in CD4+ T cells (10 ± 1% vs. 28 ± 8% vs. 34 ± 12%; p = 0.03) of T-cell selected samples, whereas on day 14, cells activated without retronectin showed higher TEff cell levels. These phenotypic differences were also observed to a lesser extent in cells derived from HDs.
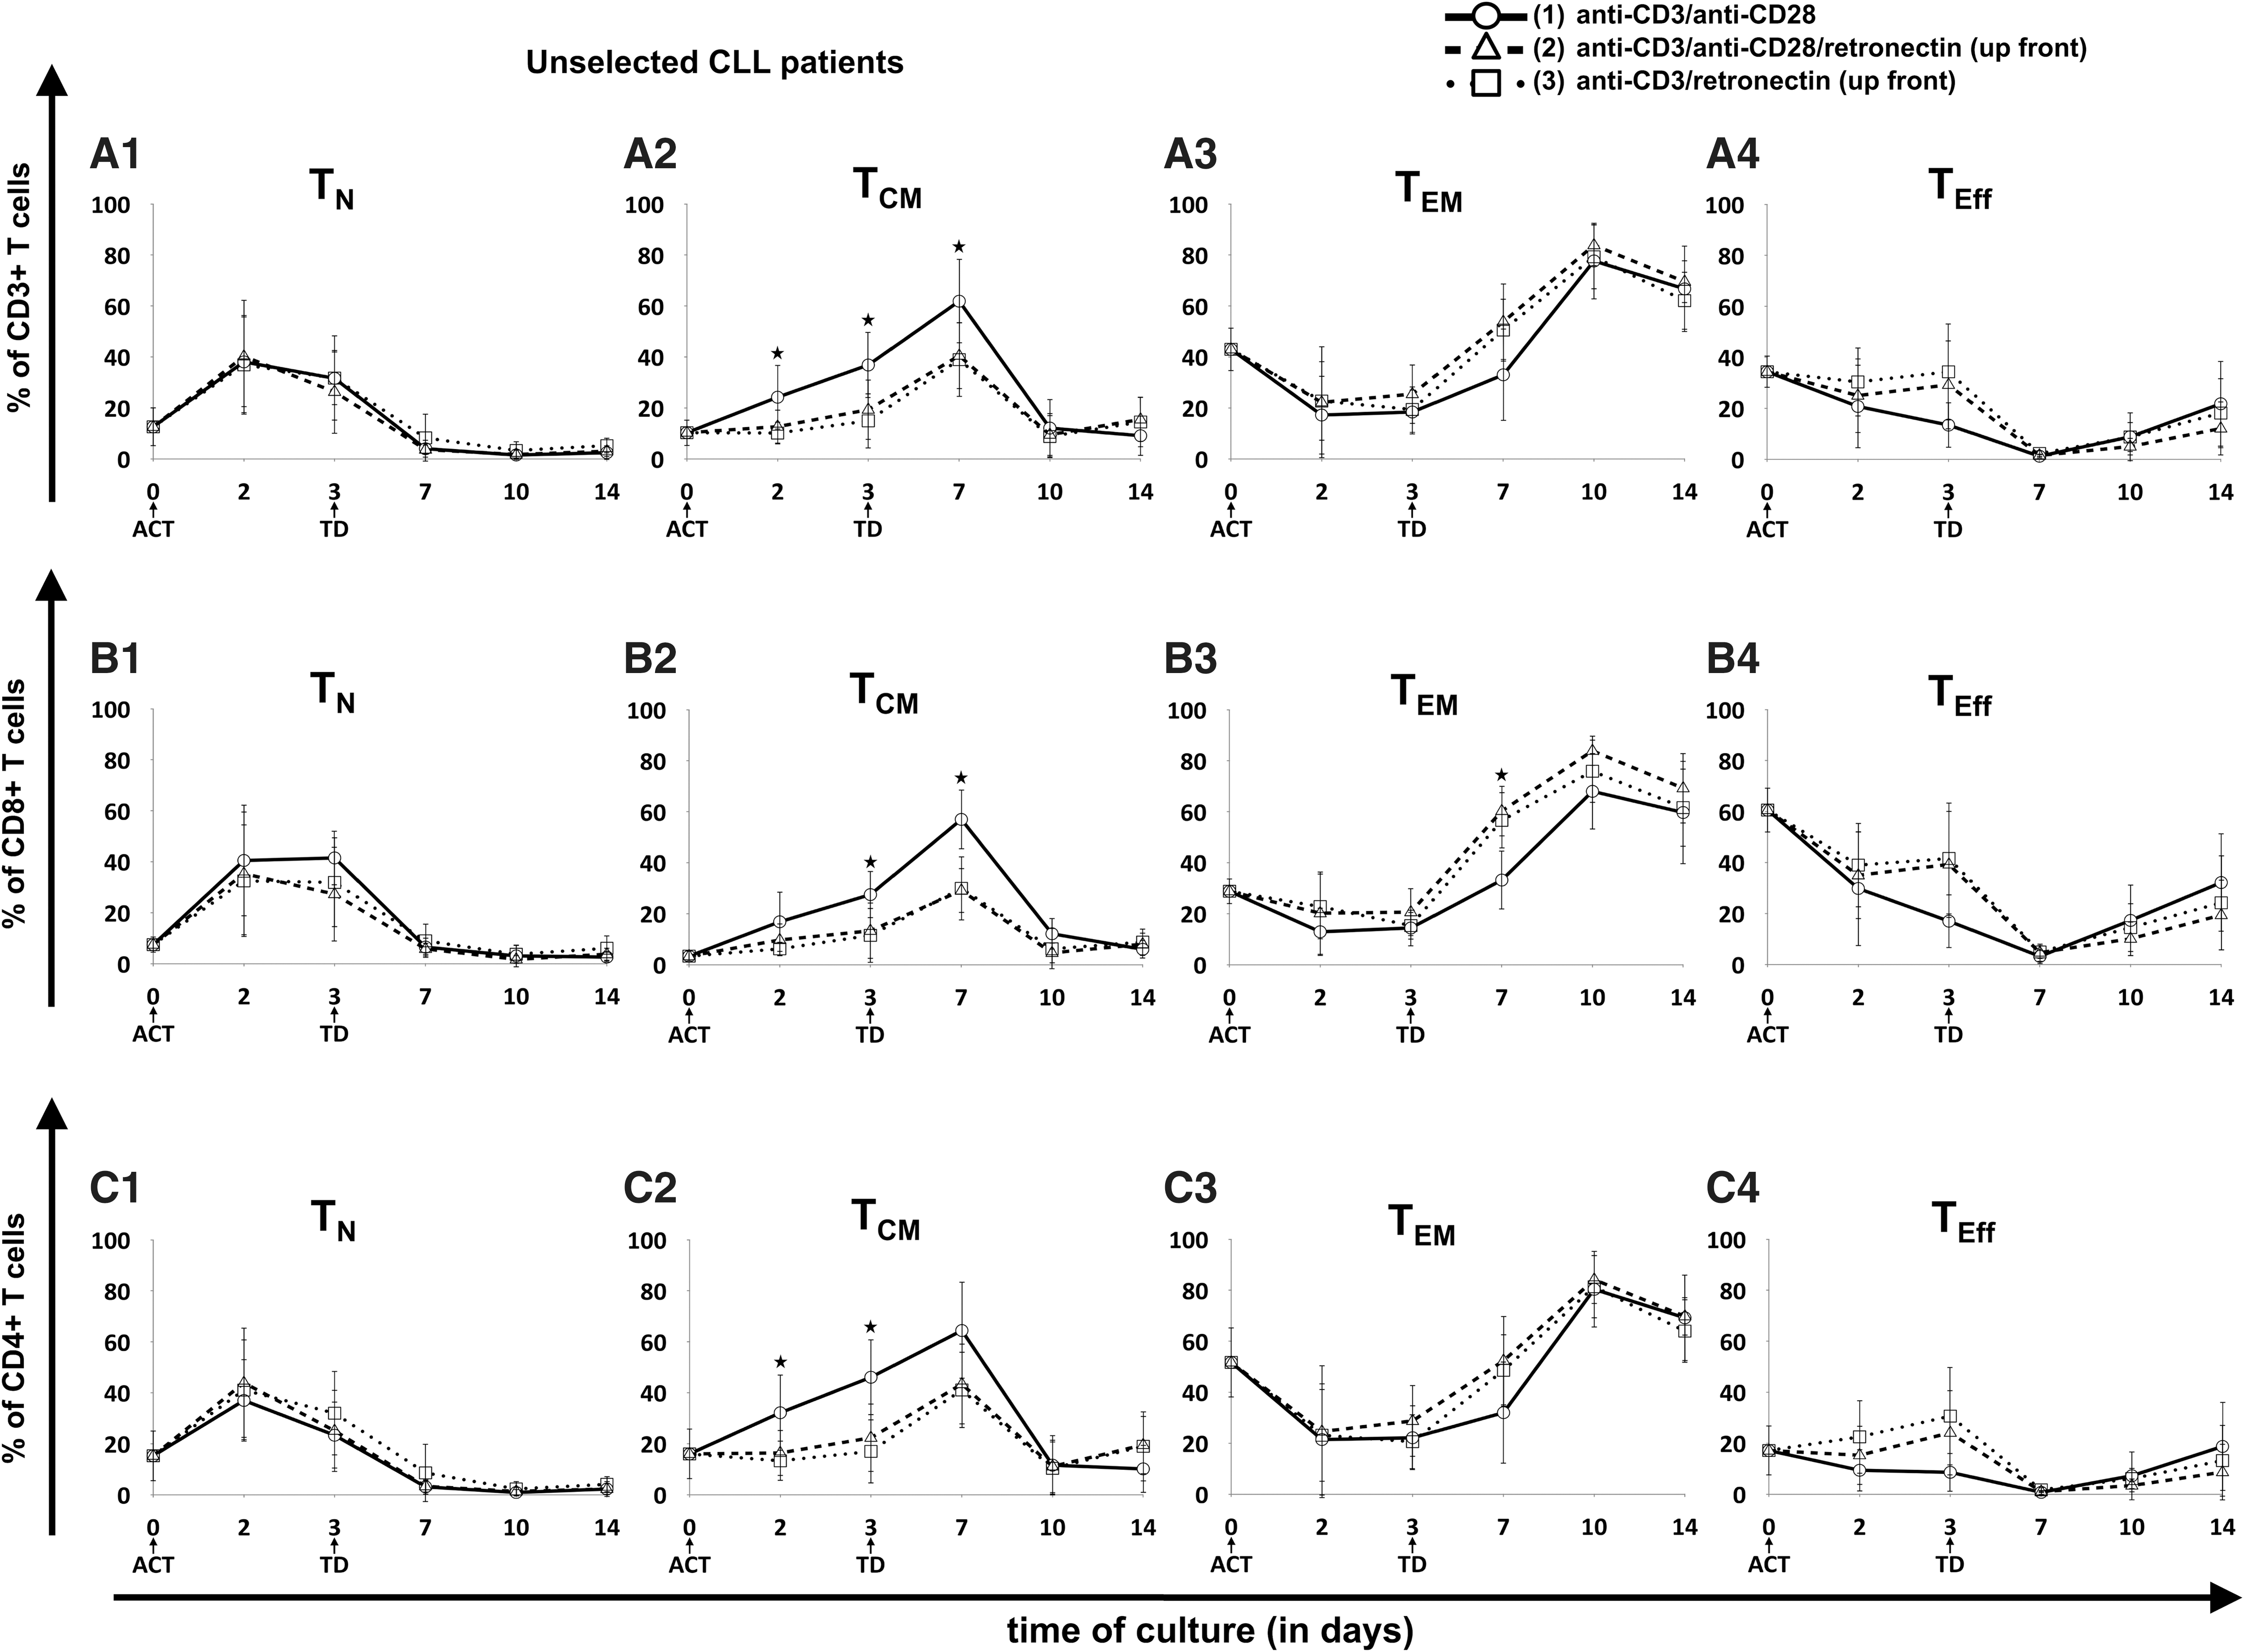
Evolution of T-cell subpopulations in patient-derived CART cells without T-cell selection. Three different T-cell ACT protocols were compared: (1) CD3/CD28 (circles, solid lines), (2) CD3/CD28/retronectin (triangles, dashed lines), and (3) CD3/retronectin (squares, dotted lines). Different subpopulations in
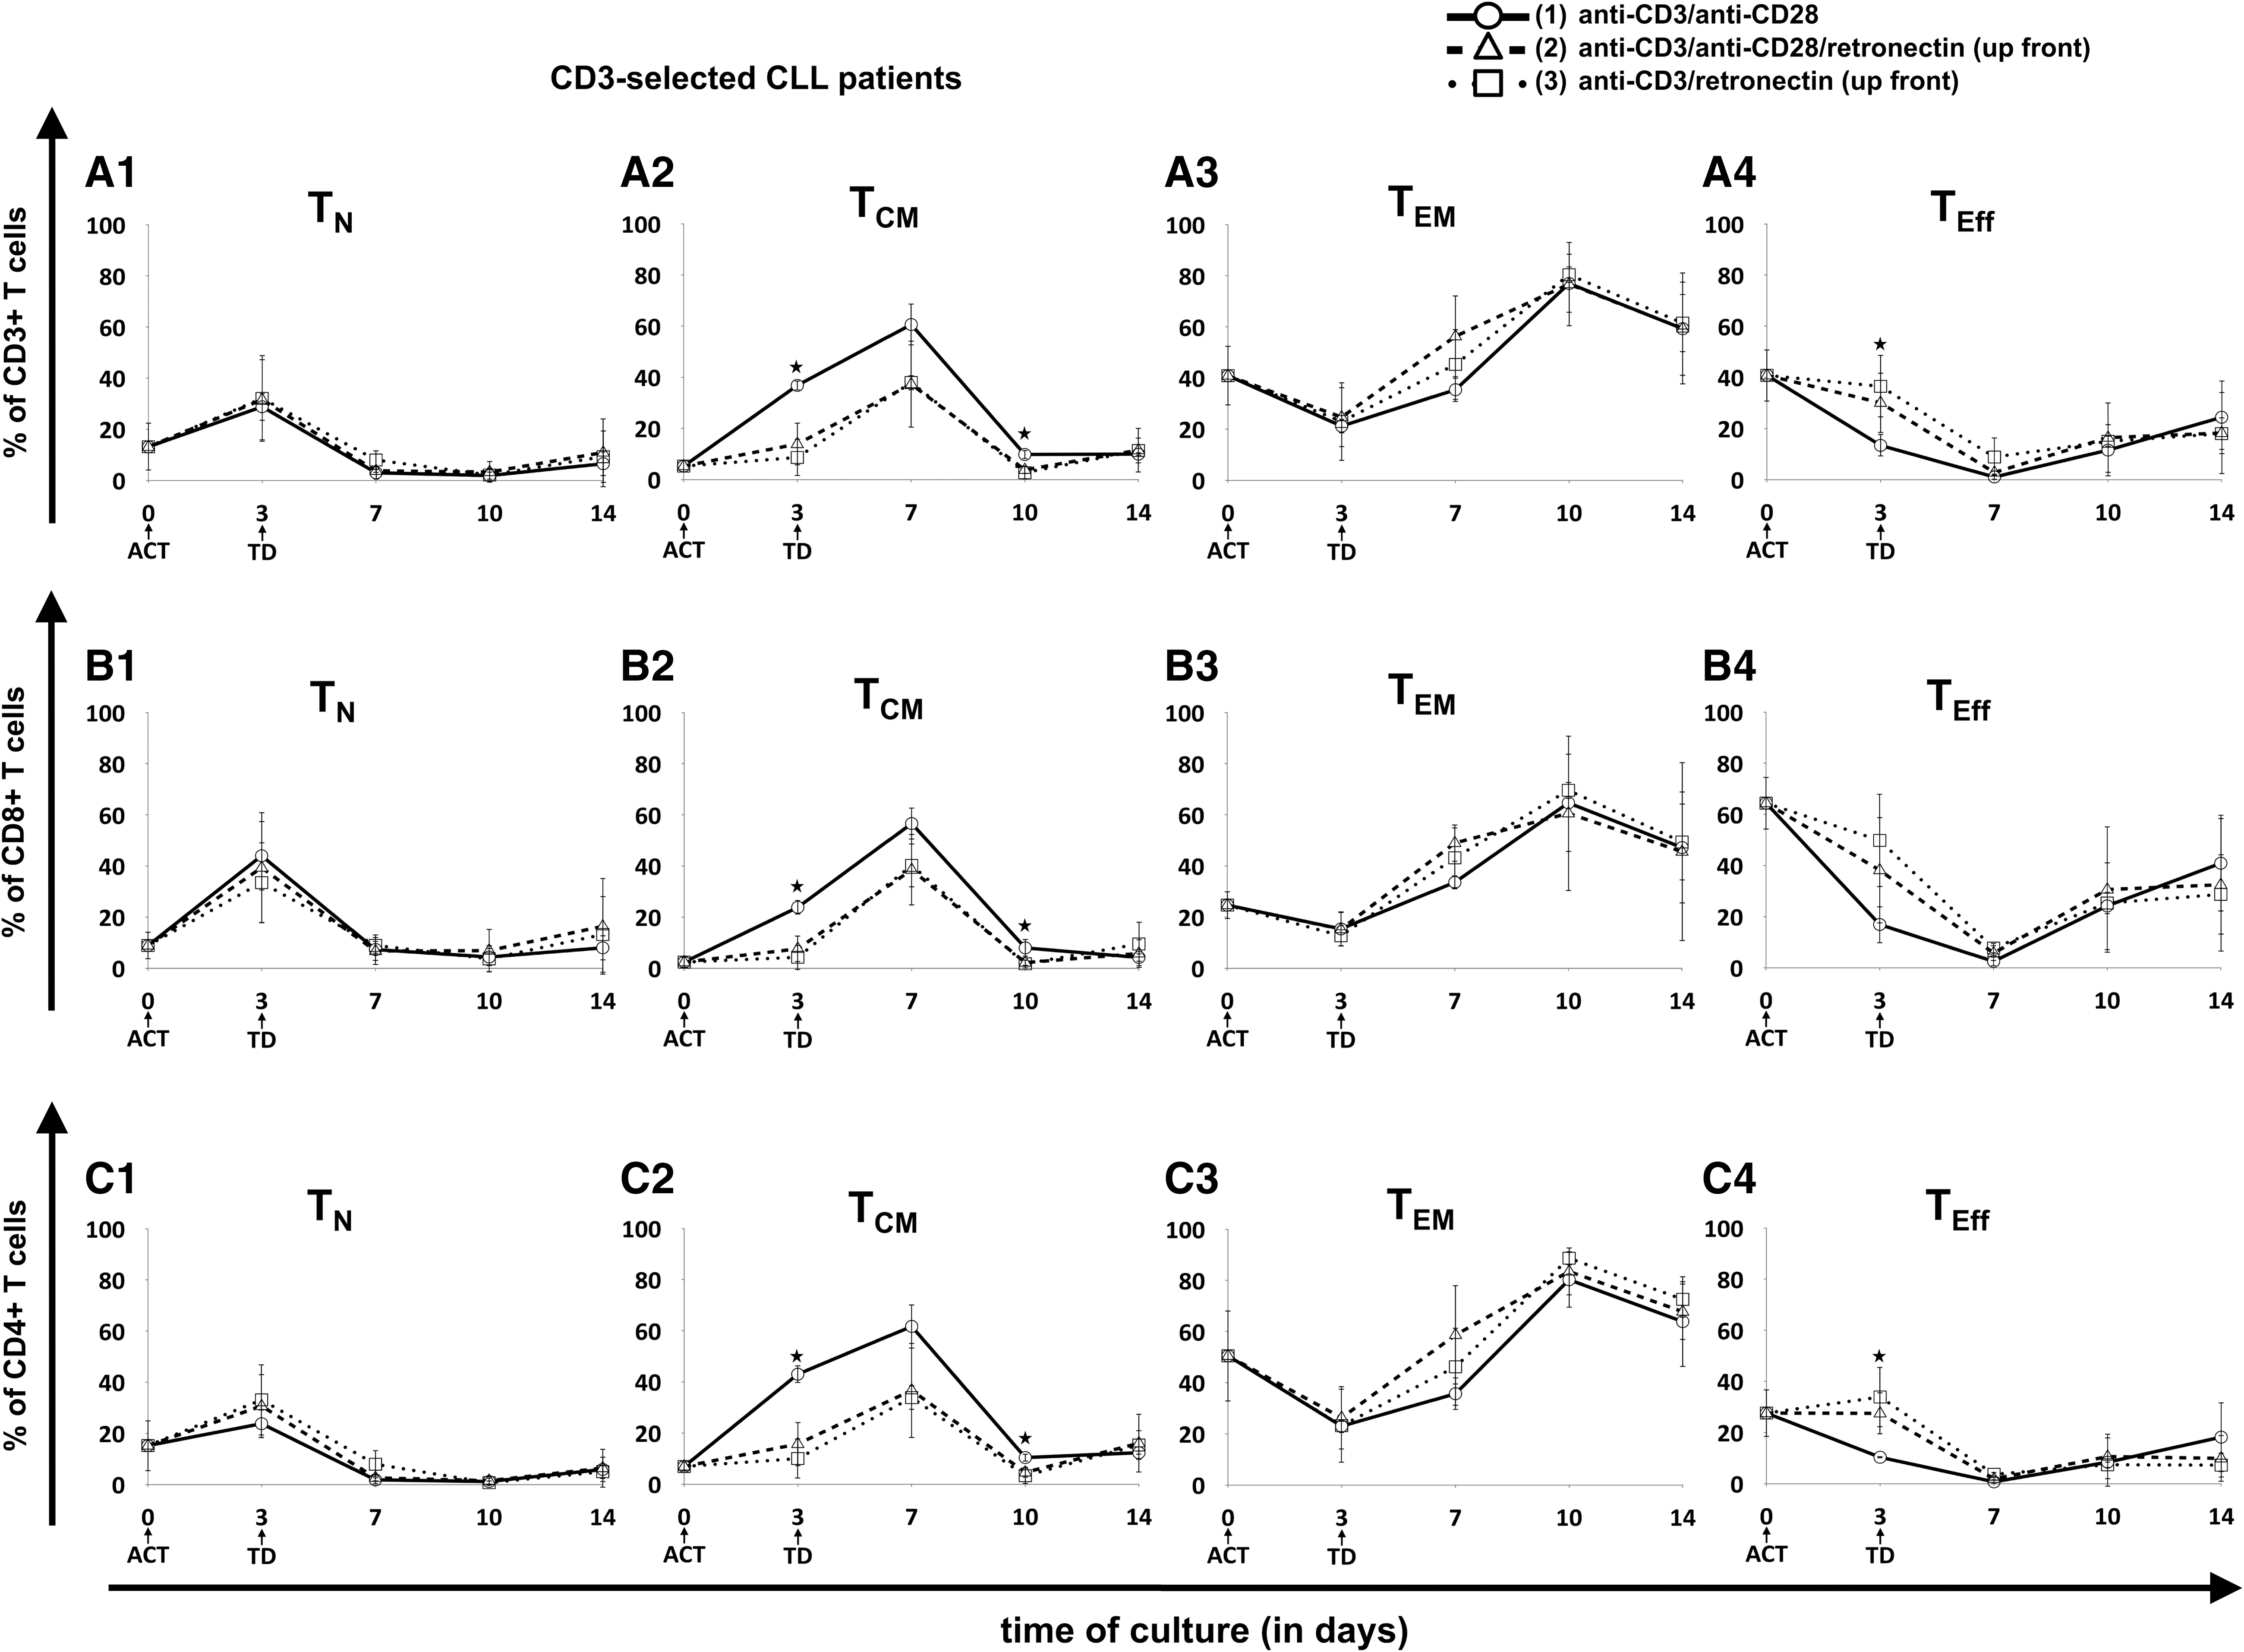
Evolution of T-cell subpopulations in patient-derived CART cells with prior positive selection for CD3+ T cells. Three different T-cell ACT protocols were compared: (1) CD3/CD28 (circles, solid lines), (2) CD3/CD28/retronectin (triangles, dashed lines), and (3) CD3/retronectin (squares, dotted lines). Different subpopulations in
Functional evaluation of CART cells
The CART cell effector functions were evaluated on CART cells derived from HDs. CART cells from CLL patients could not be evaluated due to insufficient expansion. The final GMP-grade CART cell product is cryopreserved before being administered to patients. According to this, functional analysis was performed of the CART cell products generated under the different stimulation protocols after cryopreservation. Activation without retronectin resulted in CART cells with lower lytic potential of CD19-positive Daudi cells when compared to retronectin-mediated activation (Fig. 6A). The increased lysis of cells propagated with retronectin-based activation may be attributed to the higher percentage of cytotoxic T cells (CD3+/CD8+) within the CART cell product (10% higher when compared to protocol 1; Fig. 2D). Baseline cytotoxicity after 4 h of stimulation with CD19-negative K-562 cells is displayed in Supplementary Fig. S6A.
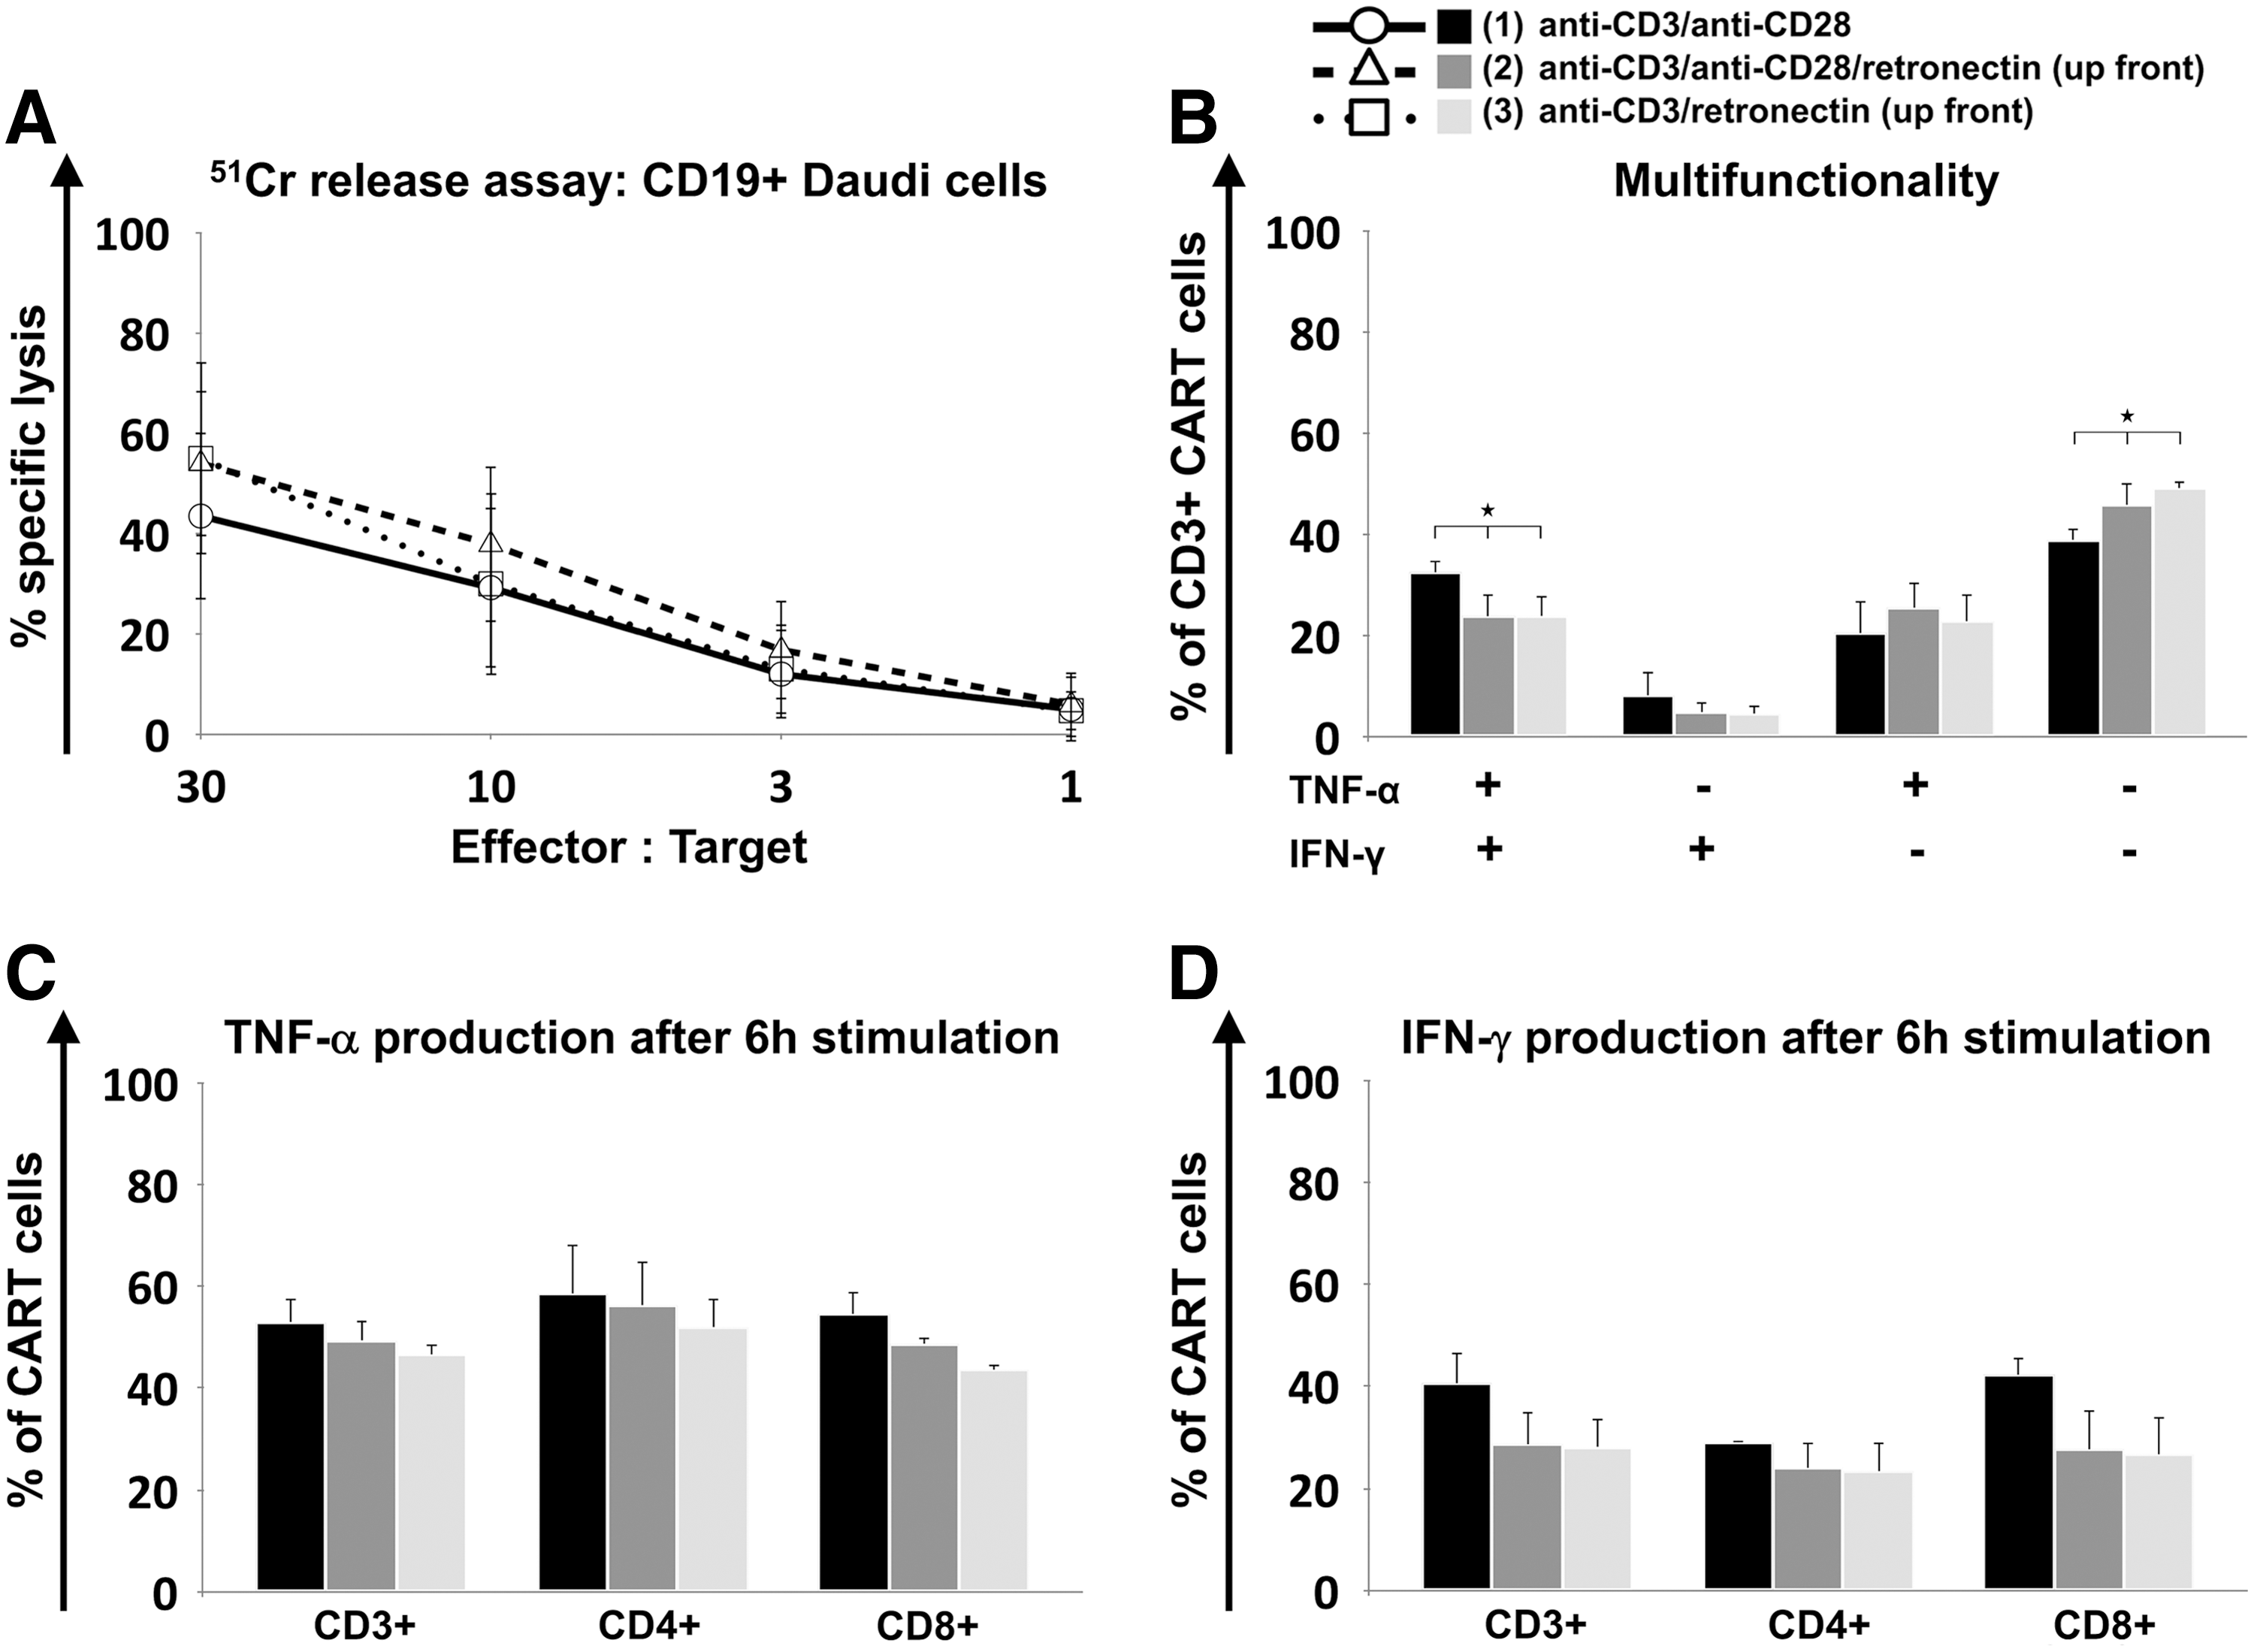
Functional characterization of CART cells. Cytotoxicity of cryopreserved CD19-specific CART cells derived from HDs (n = 3) was determined in three independent experiments by 51Cr release assay after co-culture with CD19+ Daudi target cells for 4 h
Intracellular production of TNF-α and IFN-γ was assessed on day 15 of CART cell culture. CART cells were incubated for 6 h with CD19-positive Daudi cells. CART cells generated without retronectin-based activation showed significantly higher levels of cells producing both cytokines (protocol 1 vs. 2 vs. 3: 33 ± 2% vs. 24 ± 4% vs. 24 ± 4%; p = 0.04) and significantly lower levels of T cells lacking TNF-α and IFN-γ production (39 ± 2% vs. 46 ± 4% vs. 49 ± 2%; p = 0.015; Fig. 6B). Separate analysis of TNF-α (Fig. 6C) and IFN-γ (Fig. 6D) production revealed a trend toward higher TNF-α (53 ± 4% vs. 49 ± 4% vs. 46 ± 2%) and IFN-γ (41 ± 6% vs. 29 ± 6% vs. 28 ± 5%) levels in CART cells activated without retronectin, particularly in cytotoxic T cells (TNF-α: 54 ± 4% vs. 49 ± 1% vs. 44 ± 1%; IFN-γ: 42 ± 3% vs. 28 ± 8% vs. 27 ± 7%). Baseline cytokine production after 6 h incubation in the absence of CD19-positive cells is depicted in Supplementary Fig. S6B–D.
T helper cell subsets
The influence of different activation protocols on the composition of T helper subsets was evaluated using CCR4 and CCR6 staining (Supplementary Fig. S7A and B): T helper 1 cells (Th1) were defined as CCR4–CCR6–, T helper 2 cells (Th2) as CCR4+CCR6–, T helper 9 cells (Th9) as CCR4-CCR6+, and T helper 17 cells (Th17) as CCR4+CCR6+ cells. T helper cell subtypes of HDs showed the highest proportion of Th1 cells and Th2 cells when activated without retronectin, whereas Th9 cells and Th17 cells increased when retronectin was used during the activation phase. The T helper subsets of the CLL patients showed significantly higher numbers of Th17 cells on day 14 (protocol 1 vs. 2 vs. 3: 8 ± 3% vs. 16 ± 2% vs. 15 ± 2%; p = 0.008) when compared to CART cell subsets derived from HDs.
Analysis of homing and exhaustion markers
Expression of homing markers CD62L (Supplementary Fig. S8A) and CXCR3 (Supplementary Fig. S8B) was assessed to evaluate if the activation protocols had an impact on the homing of CART cells. In unselected patient-derived CART cells, higher CD62L expression on day 14 of culture was observed when retronectin was lacking during the activation phase. No difference in CD62L expression was observed in CART cells derived from HDs or in CXCR3 expression of CART cells derived either from HDs or unselected CLL patients. In order to address exhaustion status induced by different protocols of T-cell activation, expression of PD-1 on cells derived from HDs (Supplementary Fig. S9A), unselected (Supplementary Fig. S9B) and CD3-selected CLL patient samples (Supplementary Fig. S9C) was assessed. In addition, the expression of Tim-3 on cells derived from HDs (Supplementary Fig. S9D), unselected (Supplementary Fig. S9E), and CD3-selected CLL patient samples (Supplementary Fig. S9F) was evaluated. Activation with retronectin increased PD-1 expression significantly in cells derived from HDs (protocol 1 vs. 2 vs. 3: 10 ± 3% vs. 15 ± 2% vs. 16 ± 2%; p = 0.04) and in cells derived from unselected CLL patient samples (protocol 1 vs. 2 vs. 3: 48 ± 16% vs. 70 ± 5% vs. 64 ± 9%; p = 0.01), and had a trend toward higher PD-1 expression in cells derived from CD3-selected CLL patient samples on day 14 (protocol 1 vs. 2 vs. 3: 40 ± 27% vs. 54 ± 27% vs. 53 ± 24%). For Tim-3, only a trend toward lower expression was seen in HD and unselected and CD3-selected CLL patient-derived CART cells activated with retronectin.
Discussion
The promising results of CD19-specific CART cell therapy in recent studies sparked new hope for relapsed or refractory patients with B-cell malignancies. Besides optimal vector design, the CART cell production process still requires improvement. Activation and stimulation are essential elements within CART cell manufacturing, influencing the final CART cell product and thereby therapeutic success. By analyzing the effects of retronectin-mediated activation on the CART cell product from HDs and CLL patients, this study aimed to define an activation resulting in sufficient expansion and an optimal phenotype for long-term in vivo CART cell persistence.
Retronectin is a well-established adjuvant for retroviral gene transfer. Furthermore, retronectin in combination with anti-CD3 antibodies has been positively associated with T-cell activation, since it can promote cell growth as well as efficient gene transfer, 21 leading to a product containing increased levels of T cells with low differentiation status. 20,21 However, retronectin-based activation with anti-CD3 antibodies has been mainly evaluated under addition of IL-2. 20,21 Data on the use of anti-CD3 and/or anti-CD28 antibodies as activating agents together with IL-7/IL-15 addition and up-front retronectin are currently lacking. The aim was to evaluate retronectin-mediated effects in the GMP protocol for CART cell generation that uses anti-CD3 and anti-CD28 antibodies for T-cell activation together with IL-7/IL-15 for T-cell culture. Hence, the present study compared the activation protocols CD3/CD28, CD3/CD28/retronectin, and CD3/retronectin with IL-7/IL-15 in HDs and CLL patient cells to fill this gap. Clear effects of retronectin-mediated T-cell activation on viability, expansion, and phenotype of the CART cell product were observed, despite a relatively low number of evaluated productions from HD and CLL patient-derived PBMCs.
A major focus of the study was on the retronectin-mediated effects on the T-cell subpopulations. An unfavorable T-cell subset composition with low TN cells results in insufficient in vivo effector function. 17 Transfusion of higher numbers of less-differentiated CART cells, in contrast, has shown to lead to an improved clinical outcome. 28 IL-7/IL-15 was used in this study as the cytokine cocktail for CART cell culture, as it has been demonstrated to be superior to IL-2 with regards to survival and maintenance of less-differentiated T cells, 22 –24 such as TN cells and TSCM cells defined by high self-renewal and proliferative capacity. 25 –27 Failure of treatment with CART cells can be at least partially explained by an inadequate ability of transfused cells to proliferate and persist in vivo and eventually mediate long-lasting effector function. 29 Additionally, it has been reported that TEff cells derived from TN cells can be more beneficial than TEff cells generated from TCM cells, since the latter tend to express more killer cell lectin-like receptor G1 (KLRG1) in vitro. 30 This causes not only senescence, but also reduced expansion and cytotoxicity in vivo. 30 Other strategies to increase TN cells and TSCM cells in the final cell product include IL-21 and signal pathway inhibition, particularly of Wnt. 31 –33 Moreover, it has been suggested that direct transduction of previously purified TN cells might be more beneficial for optimized CART cell therapy. 24,34,35 However, besides being a complex and expensive procedure that requires GMP compliance, TN amplification strategies with low starting numbers of TN cells would be necessary. Retronectin seems to have exerted a direct effect on augmenting less-differentiated T cells. In CART cells derived from HDs, the proportion of TN cells increased significantly by retronectin-mediated activation. In contrast, TN cells from CLL patients without pretreatment or T-cell selection stayed very low during the whole expansion period. In these donors, the presence of malignant CD19+ CLL cells may have stimulated and induced differentiation of anti-CD19 CART cells. The positive selection for CD3+ T cells reduced the presence of malignant B cells in CLL patient samples, particularly when activated without retronectin, and showed a similar but weaker retronectin-mediated effect on TN cells compared to HD-derived CART cells. As the persistence of malignant B cells remained in retronectin-activated cells, the positive influence on TN cells might still be hampered despite the T-cell selection. Moreover, it has to be considered that in HDs and unselected and CD3-selected CLL patient samples, the proliferative capacity of retronectin-treated samples was lower compared to activation with CD3/CD28. The observed effect on the TN cells could be either a true differentiation effect or a selective growth effect. However, cell growth was directly influenced by retronectin so that effects on differentiation may be at least an indirect impact of retronectin-mediated activation.
Although retronectin is used to improve retroviral transduction, retronectin-based activation of T cells tended to decrease gene transfer efficiency in HD and CLL patient-derived cells. Moreover, in the presence of retronectin, the expansion of both HDs and CLL patient cells decreased considerably during culture. This is in line with previous reports analyzing GD2-specific CART cells that observed lower expansion levels and a reduced number of transduced cells when CD3/retronectin in combination with IL-2 was used. 20 Since similar effects were observed with the addition of IL-7/IL-15, it is probably not possible to improve CART cell expansion and transduction efficiency under IL-2 stimulation, and limited effects are more likely related to up-front retronectin. According to the lower viability of T cells and expansion in the presence of retronectin, the slight decrease in transduction efficiency is more likely related to lower proliferation and is merely an indirect effect of retronectin-mediated activation. Moreover, the presence of the malignant B cells probably also hampered cell expansion, as the positive selection for CD3+ T cells in CLL patient samples led to improved expansion. Without selection for CD3, the CART cell production failed for retronectin-treated CLL patient samples, as the proliferative capacity was very low and did not mediate adequate numbers of CART cells at the end of the culture period.
Retronectin-mediated activation hampered TN cell amplification and expansion as well as viability, particularly of cells derived from CLL patients. The proportion of viable cells derived from HDs remained stable, whereas unselected and CD3-selected CLL patient cells showed diminishing numbers of viable cells with retronectin-mediated activation. Given the fact that overall lower viability and slower growth of CART cells derived from CLL patients were observed, particularly when cultivated without positive selection for T cells, cell expansion for these donors failed in the presence of retronectin. Activation with retronectin resulted in prolonged persistence of malignant CLL cells in patients, probably due to additional retronectin-mediated stimulation. The availability of cytokines for CLL patient-derived T cells differs markedly from HD-derived T cells due to large B-cell numbers that consume cytokines. It has been reported that endogenous cellular elements can be a sink for cytokines, which can influence the functionality of T cells. 36 Therefore, retronectin-mediated B-cell persistence decreased stimulating effects of the cytokines on CLL patient-derived T cells, particularly decreased IL-7/IL-15-mediated enhancement of TN cells. 22 –24 In CD3-selected CLL patient samples, TN cell levels increased slightly when activated with retronectin. However, malignant B cells were still persistent. Although levels of leukemia cells were lower compared to unselected CLL patient samples, the presence of malignant B cells may still have hampered the influence of cytokines. Less availability of cytokines may have influenced the viability and expansion of the CART cells. According to this, preselection for CD3+ T cells or pretreatment may be necessary for ALL and CLL patients containing tumor cells in the PB. Nonetheless, this results in a more complex CART cell generation process. Direct depletion of malignant B cells during CART cell production may be an easier strategy, though retronectin-mediated activation might hamper this process due to co-activation of malignant CLL cells during culture. These effects have to be investigated further on CART cells derived from patients comprising tumor cells in their PB.
The assessment of cytotoxic and T helper cells revealed differences regarding subtype distribution depending on donor type and activation protocol: HD-derived CART cells showed decreased levels of CD4+ cells and increased levels of CD8+ cells, whereas in CLL patient-derived cells, the proportion of CD4+ and CD8+ cells remained more stable during culture. Activation with retronectin led to about 10% more cytotoxic T cells in both donor types at final expansion. This subtle effect was only prominent in both donor types at the end of the culture period. However, particularly in CD3-selected CLL patient samples, cytotoxic T cells increased up to 20% when activated with retronectin and anti-CD3 antibodies. Consequently, CLL patient cells were brought closer to a 1:1 CD4:CD8 ratio, this being considered to be most beneficial with regards to cancer eradication. 17 It is assumed that CD4+ cells are crucial for CART cell persistence and required for secondary expansion as well as for memory of CD8+ T cells. 37,38 Previous reports demonstrated that retronectin-mediated activation with anti-CD3 antibodies can augment cytotoxic T cells, whereas CD3/CD28 activation preferentially increases T helper cells within the genetically modified T-cell product. 20,21,39 The effect was sustained, even after administration of the cells to the patient. 21 This study confirmed that these effects are related to a retronectin-mediated T-cell activation independently of the applied cytokines and the type of genetically modified T cells. The strongest retronectin-mediated effect on cytotoxic T cells was seen in CD3-selected CLL patient samples. Therefore, the presence of high amounts of malignant B cells may be responsible for a decreased retronectin-mediated shift between CD4+ and CD8+ T cells. More efficient B-cell depletion or additional CD4/CD8 selection might further increase this beneficial retronectin-mediated effect in CLL patient-derived samples.
Retronectin-mediated T-cell activation showed decreased Th1 cells and Th2 cells and increased Th9 cells and Th17 cells in HD-derived CART cells. A similar trend for Th17 cells was seen for CLL patient cells. Th1 cells primarily producing IFN-γ, TNF-α, and IL-2 are involved in autoimmunity and other chronic inflammatory diseases. Th2 cells producing IL-4, IL-5, IL-10, and IL-13 are important in allergy. Th9 cells, in turn, are linked to immune-mediated diseases. 40 IL-17 producing Th17 cells are considered to be an effective anticancer weapon due to the resistance to senescence and the ability to mediate potent tumor destruction. 41 For further evaluation and detailed quantification of retronectin-based effects on the Th17 cell fraction, analysis of IL-17 producing CART cells by intracellular staining may be necessary. The role of different T helper cells on CART cell function is not defined yet and remains to be elucidated.
CART cells activated with retronectin showed better lysis of CD19-positive cell lines, probably due to a higher proportion of cytotoxic cells within the CART cell product. It remains unclear whether higher in vitro lysis can be correlated to an increased clinical outcome. Furthermore, retronectin-mediated T-cell activation yielded lower IFN-γ and TNF-α levels. This may be partly explained by the lower numbers of Th1 cells and Th2 cells contained within the CART cell product, given that Th1 cells primarily produce IFN-γ and TNF-α. Moreover, retronectin-activated cytotoxic T cells showed higher levels of TN cells and TSCM cells, which represent low producers of IFN-γ and TNF-α. 42 It has been previously shown that activation with CD3/CD28 with either IL-2 or IL-7/IL-15 can result in higher cytokine secretion than activated with CD3/retronectin with IL-2, although activation with CD3/CD28 with IL-7/IL-15 is considered to have superior tumor antigen-specific cytotoxicity in GD2-specific CART cells. 20 The impact of ex vivo cytotoxicity and cytokine production on in vivo effector functionality remains unclear and requires further investigation.
T-cell exhaustion is a complex process, leading to decreased T-cell functionality. 43 High PD-1 expression of T cells derived from unselected and CD3-selected CLL patient samples in this study is in line with previous reports. 44,45 Retronectin-mediated T-cell activation further increased PD-1 expression in CART cells. To the authors' knowledge, retronectin-induced PD-1 expression has not been described in anti-CD19 CART cells before. T cells acquire exhaustion-related characteristics that reduce proliferation capacity during the early phase of tumorigenesis. 46,47 Continuous T-cell stimulation due to persisting CLL cells might have induced higher PD-1 levels, thus negatively influencing the expansion of CART cells in this study. This is in line with reduced PD-1 levels observed in CD3-selected CLL patient samples compared to unselected samples in all three activation protocols. Consequently, inhibition of PD-1 may constitute a promising treatment strategy in combination with CART cells. 48,49 Tim-3 expression was similar in HDs and CLL patient cells with a trend toward lower expression with retronectin-mediated activation.
In conclusion, retronectin-mediated T-cell activation for CART cell production is a promising method to propagate less-differentiated T-cell subsets that may be beneficial for long-term in vivo CART cell persistence. However, activation with retronectin should be performed with caution in leukemic patients. CD3 selection prior to T-cell activation may be an option in patients with CLL to overcome retronectin-mediated B-cell persistence. Further investigations of retronectin-mediated T-cell activation for CART cell production are warranted.
Footnotes
Acknowledgments
This work was funded in part by the government of Baden-Württemberg (Anschubfinanzierung zur Etablierung eines Netzwerks “Brückeninstitutionen für die Regenerative Medizin in Baden-Württemberg,” Kapitel 1403
Author Disclosure
No competing financial interests exist.
References
Supplementary Material
Please find the following supplemental material available below.
For Open Access articles published under a Creative Commons License, all supplemental material carries the same license as the article it is associated with.
For non-Open Access articles published, all supplemental material carries a non-exclusive license, and permission requests for re-use of supplemental material or any part of supplemental material shall be sent directly to the copyright owner as specified in the copyright notice associated with the article.