




Abstract
Hepatoblastoma (HB) usually occurs in infants and toddlers. Although long non-coding RNAs (lncRNAs) in various human cancers have been widely studied, the role of lncRNAs in HB remains unclear. This study aimed to investigate the biological role of the lncRNA lung cancer associated transcript 1 (LUCAT1) in HB. Analysis of data from The Cancer Genome Atlas indicated that upregulation of lncRNA LUCAT1 was closely associated with poor overall survival of HB patients. Quantitative reverse transcription polymerase chain reaction analysis showed that LUCAT1 was highly expressed in both HB tissues and cell lines. Loss-of function assays to identify the biological function of LUCAT1 in HB showed that LUCAT1 knockdown inhibited cell proliferation, migration, and invasion but reversed epithelial–mesenchymal transition. Luciferase assays indicated that STAT3 was a transcription activator of LUCAT1 and that LUCAT1 could increase STAT3 expression by competitively binding to miR-301b. In conclusion, it was found that LUCAT1 was activated by STAT3 and promoted cell proliferation, migration, and invasion in HB through modulation of the miR-301b/STAT3 axis.
Introduction
Hepatoblastoma (HB) is a type of liver tumor that commonly occurs in infants and toddlers. HB typically originates from primary liver precursor cells and on a histological basis can be divided into epithelial or epithelial/mesenchymal mixed tissues. 1 –3 The available therapeutic methods for HB include surgical resection, chemotherapy, and liver transplantation. To enhance therapeutic efficiency, further understanding of the underlying mechanisms of HB progression is needed. In particular, dysregulation and mutation of several molecules is reported to contribute to HB progression. 4 –6
Long non-coding RNAs (lncRNAs) are a group of non-coding transcripts that are >200 nucleotides and have various functions. For instance, lncRNAs can control muscle differentiation, 7 regulate reprogramming of induced human pluripotent stem cells, 8 and modulate cell apoptosis and invasion. 9 Increasing amounts of evidence indicate that mutation or dysregulation of lncRNAs can induce aberrant gene expression that contributes to tumorigenesis and tumor progression. 10 –15 Several reports have shown that lncRNAs are crucial cis- or trans-regulators of genes. LncRNAs can also participate in the formation of ribonucleoprotein complexes in the nucleus by acting as scaffolds that recruit proteins and chromatin-modifying complexes to their target genes. 16 –18 In the cytoplasm, lncRNAs can function as competitively endogenous RNAs (ceRNAs) by binding and reducing the amount of free miRNAs available to upregulate expression of their target mRNAs. 19,20
LncRNA lung cancer associated transcript 1 (LUCAT1) is a newly identified lncRNA that acts as an oncogene in esophageal squamous cell carcinoma 21 and clear cell renal cell carcinoma. 22 However, whether LUCAT1 functions in HB is not known.
This study investigated whether LUCAT1 plays a role in the molecular mechanisms of HB progression. It was found that LUCAT1 expression was correlated with the overall survival of liver cancer patients in The Cancer Genome Atlas (TCGA) database. Since HB is a subtype of liver cancer, the role of LUCAT1 in HB was investigated. Quantitative reverse transcription polymerase chain reaction (qRT-PCR) was used to assess LUCAT1 expression patterns in HB tissues and cell lines, and Kaplan–Meier analyses were also performed to analyze the correlation between LUCAT1 expression and overall survival of HB patients enrolled in this study. Based on the upregulation of LUCAT1 expression in HB, loss-of-function assays were designed and conducted in HB cells, and the study also analyzed whether transcription activators upregulated LUCAT1 expression. The ceRNA network centered around LUCAT1 was assessed mechanistically, and both rescue assays and in vivo experiments were carried out to validate the function of the STAT3–LUCAT1–miR-301b–STAT3 feedback loop in HB progression. Together, these findings provide a better understanding of the molecular mechanisms involved in HB progression.
Methods
Tissue specimens and cell lines
Human HB tissues and adjacent non-tumor tissues were collected from 96 patients undergoing HB resection at the PLA General Hospital (Beijing, P.R. China). The age of patients ranges from 10 months to 3 years old. Patients that had been diagnosed with other diseases were excluded from this study. Informed consent was obtained from each patient or his/her parent or guardian prior to enrollment in the study. This study was approved by the Ethics Committee of the PLA General Hospital.
HB cell lines (HepG2, HuH-6, and SMMC-7221) and normal human hepatocytes (L-02) obtained from the American Type Culture Collection (Manassas, VA). were cultured in Dulbecco's modified Eagle's medium (DMEM; Invitrogen, Carlsbad, CA) supplemented with 10% fetal bovine serum (FBS) in a humidified incubator with 5% CO2 at 37°C.
Transfection
Short hairpin RNA (shRNA) targeted to LUCAT1 (sh-LUCAT1) and the corresponding control shRNA (sh-NC) were designed and synthesized by Genepharma (Shanghai, P.R. China). MiR-301b mimics and inhibitors and a corresponding negative control miRNA (miR-NC) were all synthesized by Ribobio (Guangzhou, P.R. China). Cell transfections were performed using Lipofectamine 2000 (Invitrogen).
Real-time PCR
Trizol reagent (Invitrogen) was used to extract total RNA from HuH-6 and HepG2 cells according to the manufacturer's instructions. For reverse transcription, 1 μg of RNA was treated with HiScript II Q RT SuperMix for qPCR (+gDNA wiper; Vazyme, Nanjing, P.R. China). Real-time PCR was conducted using AceQ qPCR SYBR GreenMaster Mix (Vazyme). The reaction conditions for PCR were: 95°C for 15 s followed by 40 cycles of 95°C for 5 s and 60°C for 30 s. The expression levels of LUCAT1 and STAT3 were normalized to GAPDH, whereas miR-301b expression was normalized to U6. The quantification of gene expression was carried out using the 2–ΔΔCt method.
Cell proliferation assays
After transfection, HepG2 and HuH-6 cells were seeded on 96-well plates at 5 × 10³ cells/well. The culture medium was regularly changed. MTT dye (20 μL; Solarbio, Beijing, P.R. China) was added to each well 24, 48, 72, and 96 h after seeding, and the cells were incubated for 4 h at 37°C before 150 μL dimethyl sulfoxide (Sigma–Aldrich, San Francisco, CA) was added to each well. The cells were then incubated for around 10 min, and the absorbance was measured at 570 nm with a Universal Microplate Spectrophotometer (Bio-Tek Instruments, Inc., Winooski, VT).
For the colony formation assay, transfected HB cells were treated with trypsin (Solarbio, Beijing, P.R. China). Cells were seeded on six-well plates at a density of 200 cells per well and cultured in DMEM (Invitrogen) supplemented with 10% FBS (Gibco, Grand Island, NY; Bio-Rad, Hercules, CA) at room temperature for about 14 days. The cells were then treated with methanol and 0.5% crystal violet (Sigma–Aldrich), and visible colonies were manually counted.
Migration and invasion assay
Both migration and invasion were measured with Transwell chambers (BD Biosciences, Franklin Lakes, NJ). To detect migratory ability, 5 × 10⁴ cells were placed in the top chamber of each insert with an uncoated membrane. To test cell invasion activity, 8 × 10⁴ cells were plated in the upper chamber of each insert that was coated with Matrigel. Next, the cells were incubated for 18 h at 37°C. The migrating or invading cells were fixed and stained with dye solution mixed with 0.1% crystal violet and 20% methanol. The number of migratory cells or invasive cells was calculated and imaged using an IX71 inverted microscope (Olympus Corp., Tokyo, Japan).
In vivo experiments
HB cells (5 × 10⁴) transfected with different plasmids were implanted into 6-week-old female nude mice with sterile 28-gauge needles. Tumors were removed 1 month after transplantation, and the tumor volume and tumor weight were calculated. The nude mice were divided into four different groups (n = 4 each group) in accordance with the transfections. Animal experiments were conducted in accordance with the Guide for the Care and Use of Laboratory Animals and approved by the review board of the PLA General Hospital.
Chromatin immunoprecipitation
The EZ-ChIP kit (Millipore, Billerica, MA) was used for chromatin immunoprecipitation (ChIP) assay according to the manufacturer's instructions. HuH-6 and HepG2 cells were treated with 4% formaldehyde to form DNA-protein cross-links at 37°C for 10 min. Subsequently, cells at a final concentration (0.14 M) were incubated with glycine for 30 minutes at room temperature. After washing with ice-cold PBS, cells were harvested and lysed in 400 μL lysis buffer (150 mM NaCl, 50 mM Tris-HCl (pH 7.5), 5 mM EDTA, 0.5% NP-40, 1.0% Triton X-100) containing 8 μL protease inhibitor. Following centrifugation at 12,000 g for 1 min at 4°C, cells were re-suspended in lysis buffer and sonicated for 10 pulses at 20 seconds per pulse, with 30 seconds on ice between the pulses. The antibodies used to immunoprecipitate crosslinked protein–DNA complexes were: rabbit anti-STAT3 (10253-2-AP; Proteintech, Rosemont, IL) and normal rabbit immunoglobulin G (IgG; 12-370; Millipore, Darmstadt, Germany). QRT-PCR was used to quantify the immunoprecipitated DNA.
Subcellular fractionation
NE-PER Nuclear and Cytoplasmic Extraction Reagents (Thermo Fisher Scientific, Waltham, MA) were used to carry out subcellular fractionations. RNAs isolated from the nucleus or cytoplasm of HuH-6 or HepG2 cells were analyzed by RT-qPCR using U6 and GAPDH, respectively, as controls.
RNA pull-down assay
Biotinylated miRNA was transfected into HuH-6 and HepG2 cells. Two days after transfection, cells were collected. Cell lysates were incubated with M-280 streptavidin magnetic beads (Invitrogen). TRIzol reagent (Invitrogen) was used to purify the bound RNAs for RT-qPCR analysis.
RNA immunoprecipitation
RNA immunoprecipitation (RIP) assay was conducted with a Magna RIP™ RNA-Binding Protein Immunoprecipitation Kit (Millipore, Billerica, MA) and an AGO2 antibody (04-642; Millipore). Total RNAs and IgG were assayed simultaneously to confirm that the detected signals represented specific binding of RNAs to AGO2. Co-precipitated RNAs were measured by real-time PCR.
Luciferase reporter assay
HuH-6 and HepG2 cells were seeded on 96-well plates at 5 × 10³ cells/well. Twenty-four hours after seeding, the cells were transiently transfected using a mixture of pRL-CMV Renilla luciferase reporter (5 ng), firefly luciferase reporter (50 ng), and miRNA mimics (5 pmol). After 48 h, the relative luciferase activity was assessed using a dual-luciferase reporter assay system (Promega, Madison, WI).
Western blot analysis
Proteins isolated from cell lysates were preserved in 1 × sodium dodecyl sulfate buffer and separated by sodium dodecyl sulfate-polyacrylamide gel electrophoresis before transfer to a nitrocellulose membrane (Bio-Rad). The membranes were then blocked in 5% nonfat milk and incubated with the anti-E-cadherin (1:1,000; ab40772), anti-β-catenin (1:1,000; ab32572), anti-N-cadherin (1:1,000; ab18203), anti-vimentin (1:1,000; ab92547), and anti-GAPDH (1:1,000; ab9485) followed by the secondary antibody (1:2,000; ab6728). Antibodies used in this study were all purchased from Abcam (Cambridge, MA). Antigen–antibody complexes were detected with enhanced chemiluminescence reagents (Pierce, Rockford, IL).
Statistical analysis
All independent experiments were performed at least twice. Experimental results are presented as the mean ± standard deviation. Data were analyzed using Student's t-test (two-tailed) or one-way analysis of variance. SPSS Statistics for Windows v16.0 (SPSS, Inc., Chicago, IL) was used to perform all statistical analyses. Correlation between gene expression levels in HB tissues was assessed using Spearman's analysis method. p-Values <0.05 indicated statistical significance.
Results
LUCAT1 upregulation in HB and positive correlation between LUCAT1 expression and unfavorable prognosis of HB patients
Liver cancer samples in TCGA database were divided into two groups in accordance with the mean value for LUCAT1 expression. Kaplan–Meier analysis revealed that upregulated levels of lncRNA LUCAT1 were negatively correlated with the overall survival of liver cancer patients (Fig. 1A). Next, the expression level of LUCAT1 in HB tissues and adjacent non-tumor tissues was examined, and it was found that LUCAT1 was markedly upregulated in HB tissues (Fig. 1B). Testing of LUCAT1 expression levels in three HB cell lines (HepG2, HuH-6, and SMMC-7221) and the normal human hepatocyte cell line L-02 revealed consistently higher relative expression of LUCAT1 in HB cells relative to the normal hepatocyte cell line (Fig. 1C). These data suggest that LUCAT1 plays a role in HB progression.

Upregulation of long non-coding RNA (lncRNA) lung cancer associated transcript 1 (LUCAT1) expression in hepatoblastoma (HB) and positive association with unfavorable prognosis of HB patients.
LUCAT1 expression knockdown suppressed proliferation, migration, and invasion of HB cells
Previous data indicated that LUCAT1 was expressed at high levels in HuH-6 and HepG2 cells. Accordingly, HuH-6 and HepG2 cells were transfected with LUCAT1-specific shRNA (sh-LUCAT1) and control shRNA (sh-NC). qRT-PCR performed 48 h after transfection showed that LUCAT1 levels were significantly decreased in cells transfected with sh-LUCAT1 (Fig. 2A). MTT and colony formation assays with sh-LUCAT1-transfected HuH6 and HepG2 cells had markedly suppressed cell proliferation relative to untreated cells (Fig. 2B and C). Additionally, Transwell assay results suggested that LUCAT1 knockdown efficiently suppressed cell migration and invasion in HuH-6 and HepG2 cells (Fig. 2D and E). A Western blot of the levels of epithelial–mesenchymal transition (EMT) marker proteins (E-cadherin, β-catenin, N-cadherin, vimentin) was also performed in lysates of sh-LUCAT1-transfected HB cells, which showed that levels of epithelial markers (i.e., E-cadherin and β-catenin) were increased relative to untreated cells. Meanwhile, the levels of mesenchymal markers (i.e., N-cadherin and vimentin) were significantly decreased (Fig. 2F), indicating a positive effect of LUCAT1 on EMT.
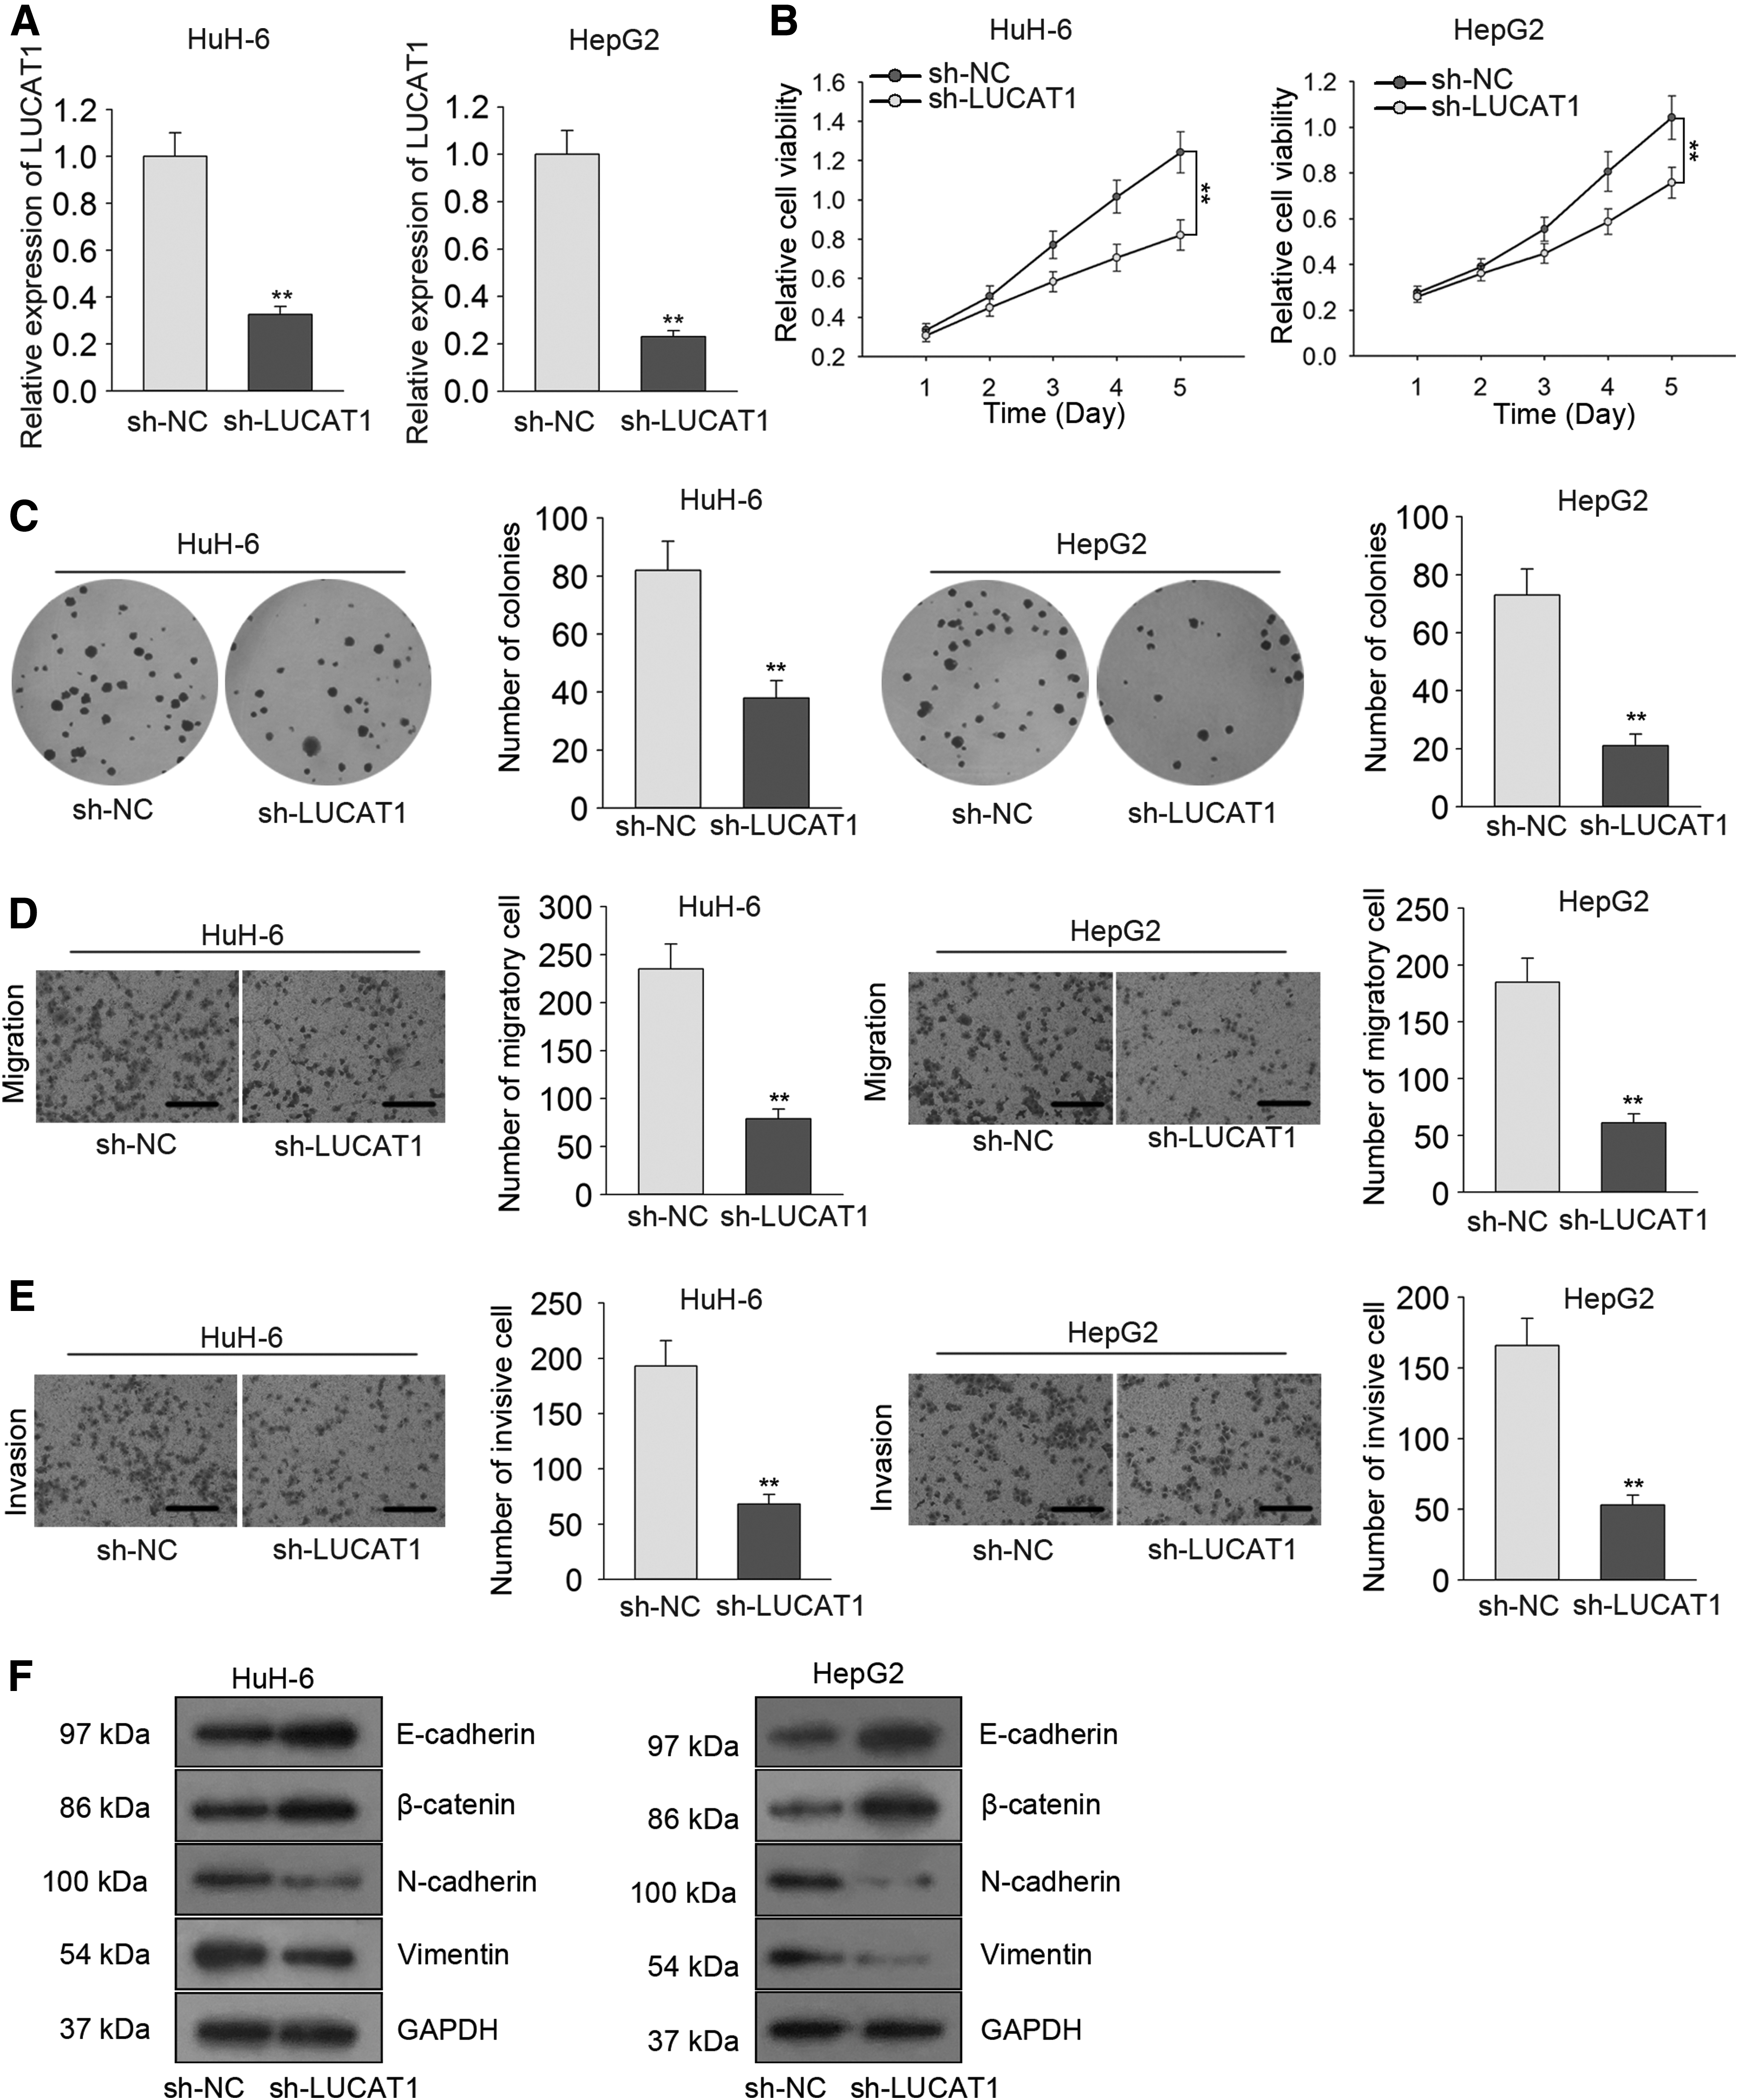
LUCAT1 knockdown suppressed cell proliferation, migration, and invasion in HB.
Contribution of STAT3 to the transcriptional activation of LUCAT1
Previous studies revealed that lncRNA expression can be upregulated by transcription factors. 23,24 This study hypothesized that upregulation of LUCAT1 might be induced by an upstream transcription factor. According to a search of the UCSC database, STAT3 is a potential upstream transcription factor of LUCAT1. As such, the top five STAT3 binding sites in the LUCAT1 promoter region of LUCAT1 were predicted using the online bioinformatics tool JASPAR. The binding motif in Fig. 3A and B shows the STAT3 response elements in the LUCAT1 promoter region. A ChIP assay conducted in HuH-6 and HepG2 cells revealed that STAT3 could bind to Part 1 (P1) of the LUCAT1 promoter region (Fig. 3C). However, a luciferase reporter assay demonstrated that STAT3 did not affect the luciferase activity of Site 2 when the binding sequence was mutated (Fig. 3D), suggesting that Site 2 is the functional binding site for STAT3 in the LUCAT1 promoter. Consistent with these results, STAT3 expression levels were higher in HB tissues (Fig. 3E), and STAT3 expression was positively correlated with LUCAT1 expression in HB tissues (Fig. 3F). Taken together, these findings show that STAT3 could act as a transcription activator of LUCAT1 in HB.
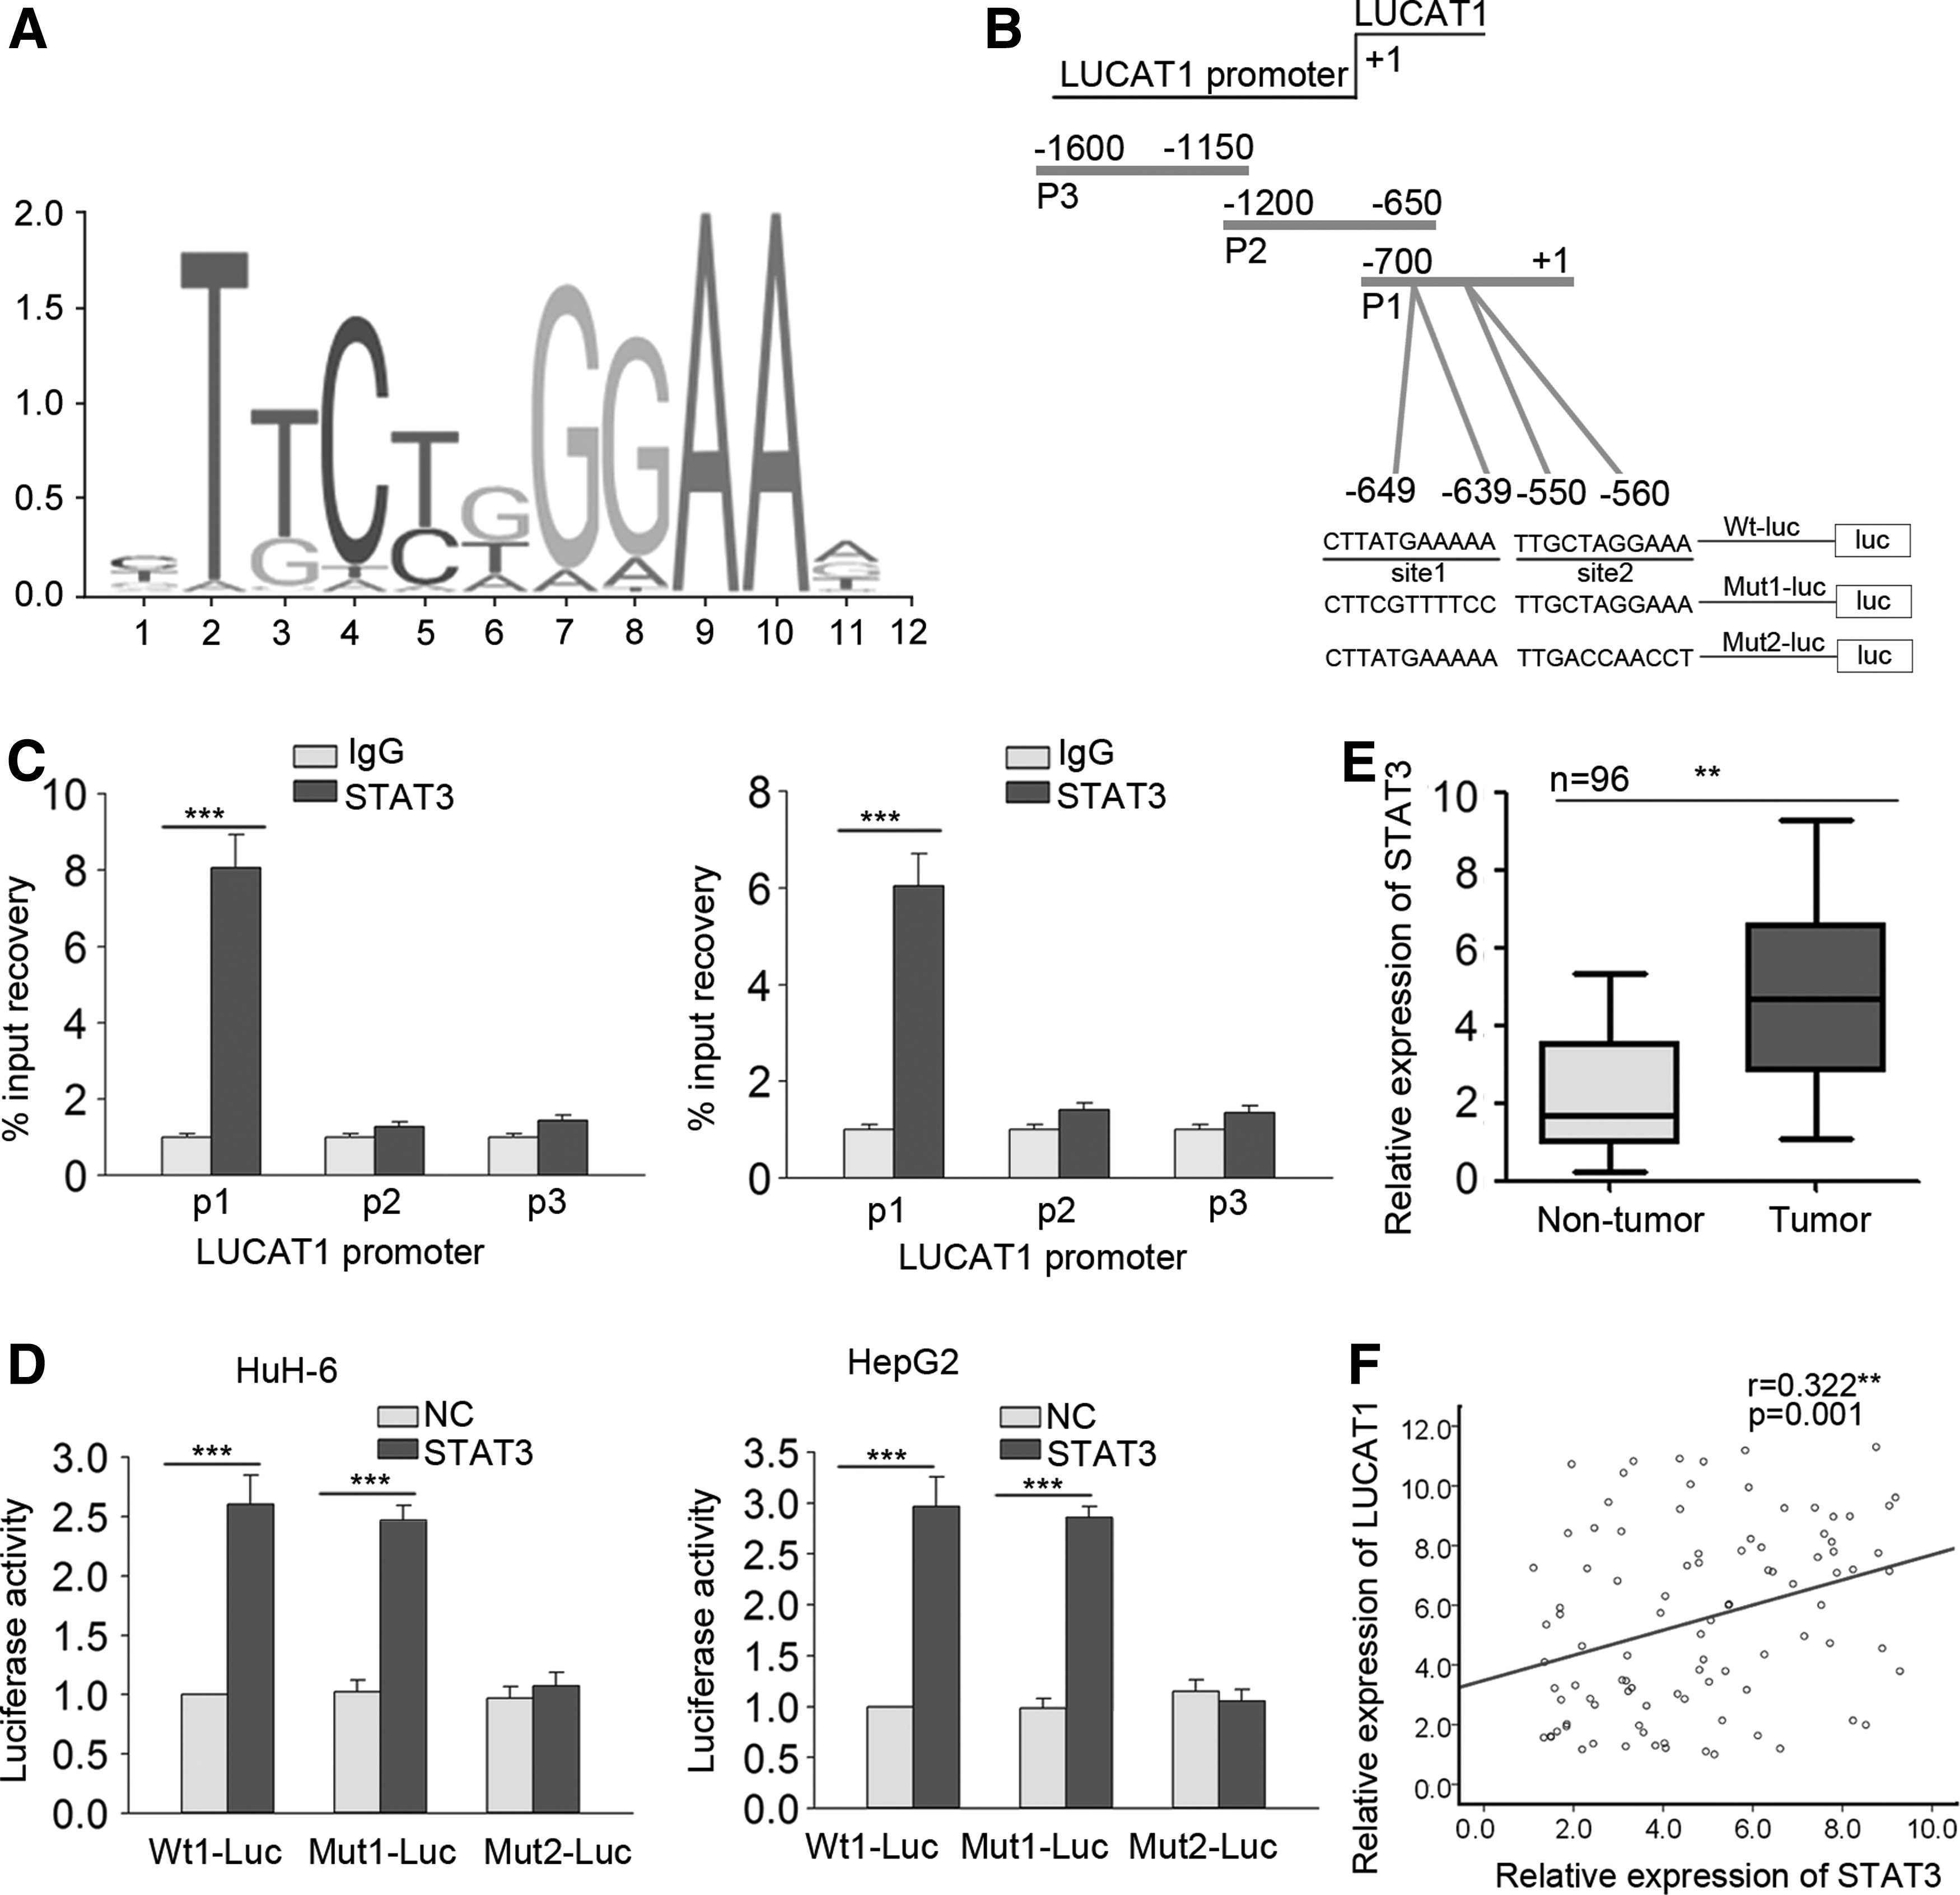
Contribution of STAT3 to LUCAT1 transcriptional activation.
Targeting of STAT3 by miR-301b
Previous studies revealed that STAT3 is a target of miRNAs. 25,26 This study attempted to find a miRNA that regulates STAT3 in HB. Using the bioinformatic tools targetScan and miRanda, 22 miRNAs were found that could target STAT3 (Fig. 4A). Among these, miR-301b has not been reported to function in liver cancer. To determine whether miR-301b might play a role in HB, the sequence of STAT3 bound to miR-301b were predicted using TargetScan version 7.2 (Fig. 4B). A luciferase reporter assay performed in Huh-6 and HepG2 cells transfected as described in the Methods showed that miR-301b mimics efficiently decreased the luciferase activity of wild-type STAT3 3′ UTR (STAT3-WT) but not that of mutated STAT3 3′ UTR (STAT3-MUT; Fig. 4C). A pull-down assay performed using lysates from Huh-6 and HepG2 cells transfected with biotinylated miRNA further demonstrated that STAT3 could be pulled down with Bio-miR-301b-WT but not with Bio-miR-301b-MUT or Bio-NC (Fig. 4D). The level of miR-301b was decreased in HB tissues and cell lines compared to that in non-tumor tissues and L-02 cells (Fig. 4E). A negative correlation between miR-301b and STAT3 in HB tissues was demonstrated in a Spearman's correlation analysis (Fig. 4F). Taken together, these results suggested that miR-301b may indeed play a role in HB.
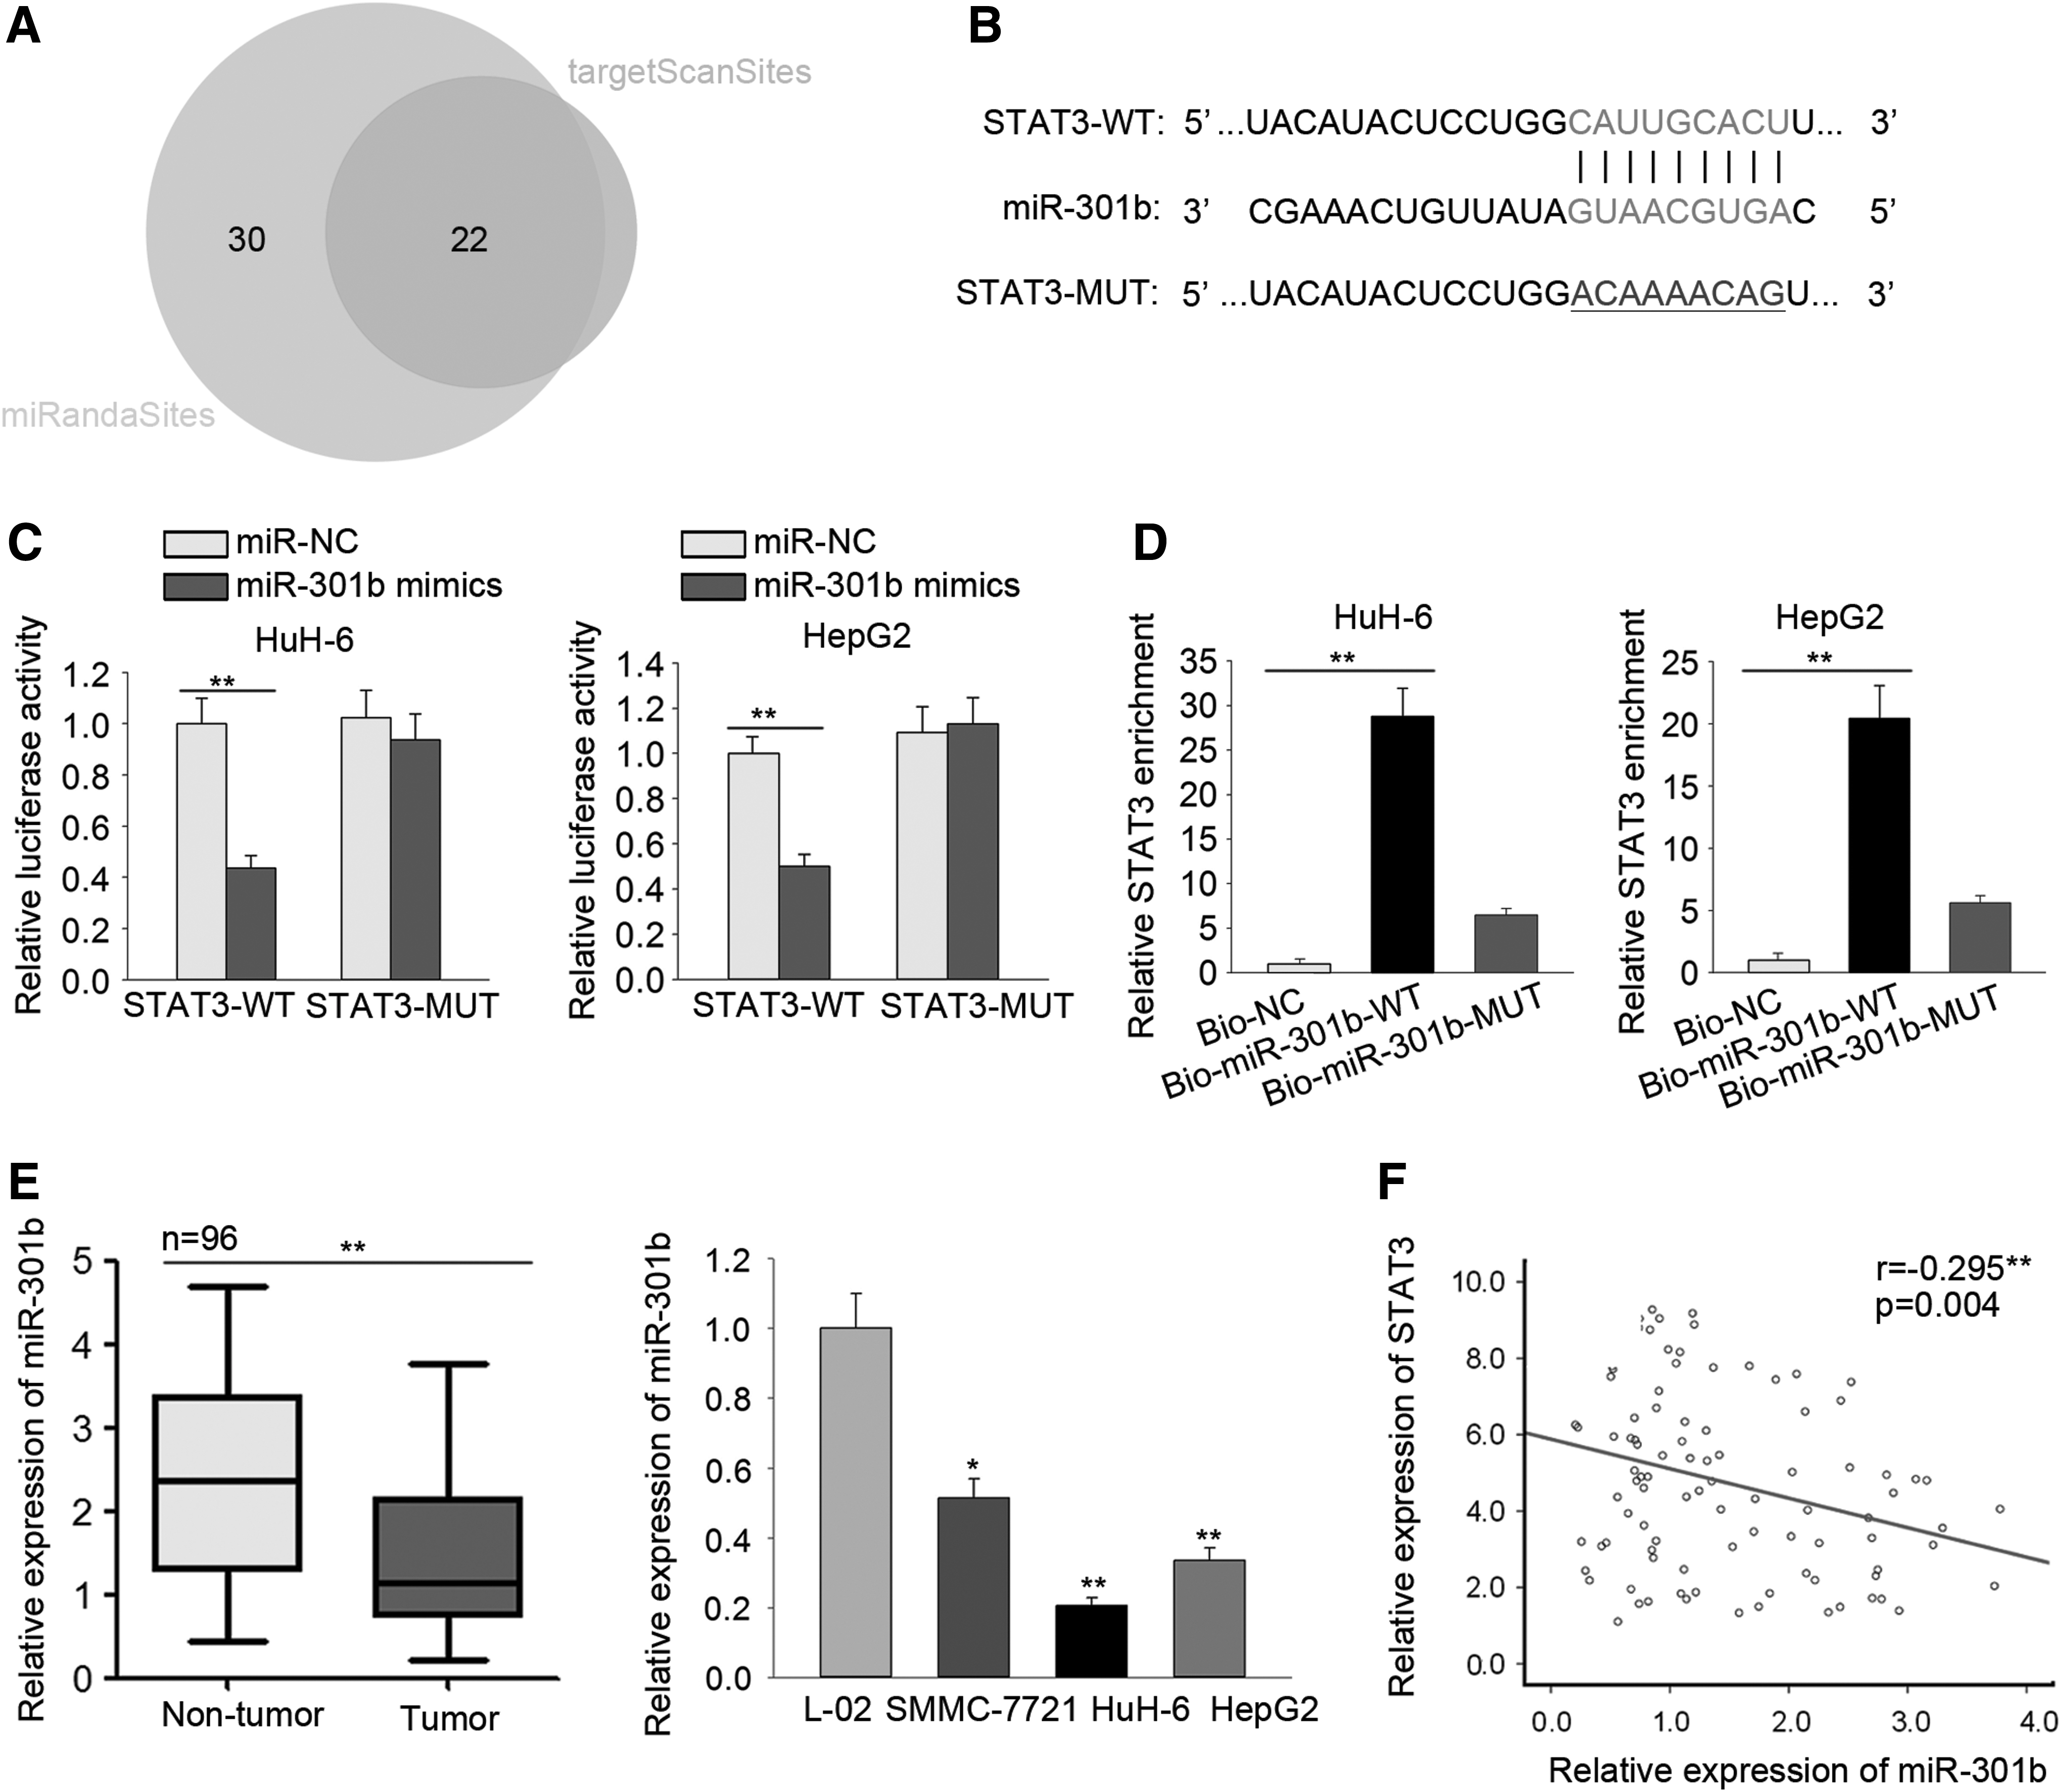
miR-301b targets STAT3.
miR-301b as a tumor suppressor in HB
To determine the role of miR-301b in HB, gain-of-function assays were performed using HuH-6 and HepG2 cells transfected with miR-301b mimics. As shown by qRT-PCR, miR-301b expression was higher in cells transfected with miR-301b mimics compared to cells transfected with control miRNA (miR-NC; Fig. 5A). In addition, cell proliferation was substantially inhibited by miR-301b upregulation (Fig. 5B and C), whereas cell migration and invasion were both inhibited by miR-301b mimics (Fig. 5D and E). miR-301b mimics could also induce a change from the EMT phenotype to mesenchymal– epithelial transition (Fig. 5F). These data support a role for miR-301b as a tumor suppressor in HB.

Tumor suppressor action of miR-301b in HB.
LUCAT1 acted as a ceRNA in HB cells by competitively binding to miR-301b
A subcellular fractionation assay and qRT-PCR to assess the cellular localization of LUCAT1 in HB cells showed that LUCAT1 mainly had a cytoplasmic distribution in HB cells (Fig. 6A). In human cancers, lncRNAs are widely reported to function as ceRNAs. Based on the present results, it was hypothesized that LUCAT1 might act as a ceRNA to regulate the miR-301b/STAT3 axis and in turn form a feedback loop. To examine this hypothesis, first putative miR-301b binding sites were identified in LUCAT1 using a public bioinformatics Web site (DIANA Tools; Fig. 6B). A RIP assay was also performed to demonstrate the interaction between LUCAT1 and miR-301b. Both LUCAT1 and miR-301b were enriched in beads carrying the RNA-induced silencing complex component Ago2 (Fig. 6C). A pull-down assay showed that LUCAT1 could be pulled down by Bio-miR-301b-WT but not by Bio-miR-301b-MUT or Bio-NC (Fig. 6D). In a dual-luciferase reporter assay, miR-301b efficiently decreased the luciferase activity of wild-type LUCAT1 (LUCAT1-WT) in transfected Huh-6 and HepG2 cells, whereas the luciferase activity of mutant type LUCAT1 (LUCAT1-MUT) was not changed (Fig. 6E). After statistical analysis, we determined the negative correlation between LUCAT1 and miR-301b expression (Fig. 6F).

LUCAT1 acted as a ceRNA in HB cells by competitively binding miR-301b.
LUCAT1–miR-301b–STAT3 axis function in HB proliferation
The above data support the activation of LUCAT1 expression by STAT3 and subsequent oncogenic functions of LUCAT1 in HB that modulate the miR-301b-STAT3 axis. To explore this relationship further, rescue assays were carried out in which STAT3 mRNA and protein levels were examined in HB cells transfected with sh-NC, sh-LUCAT1, and a miR-301b inhibitor. Inhibition of STAT3 expression induced by sh-LUCAT1 could be attenuated by an miR-301b inhibitor (Fig. 7A and B). Moreover, the inhibitory effect of sh-LUCAT1 on cell proliferation was partially abolished in the presence of the miR-301b inhibitor or pcDNA-STAT3 (Fig. 7C and D). The migration and invasion activity that was inhibited by sh-LUCAT1 were partly recovered by the miR-301b inhibitor or pcDNA-STAT3 (Fig. 7E and F). Finally, EMT progression that was reversed by sh-LUCAT1 was recovered in the presence of a miR-301b inhibitor or pcDNA-STAT3 (Fig. 7G).

Function of the LUCAT1–miR-301b–STAT3 axis in HB proliferation.
LUCAT1–miR-301b–STAT3 axis regulated HB cell growth in vivo
To confirm the function of the LUCAT1–miR-301b–STAT3 axis in HB, processed HB cells (5 × 10⁴) were implanted into nude mice. One month after implantation, the tumors were removed and analyzed. Tumors from mice implanted with cells with LUCAT1 knockdown were smaller. This growth inhibition could be partially attenuated by miR-301b knockdown or STAT3 overexpression (Fig. 8A) as evidenced by changes in tumor volume and tumor weight (Fig. 8B and C).
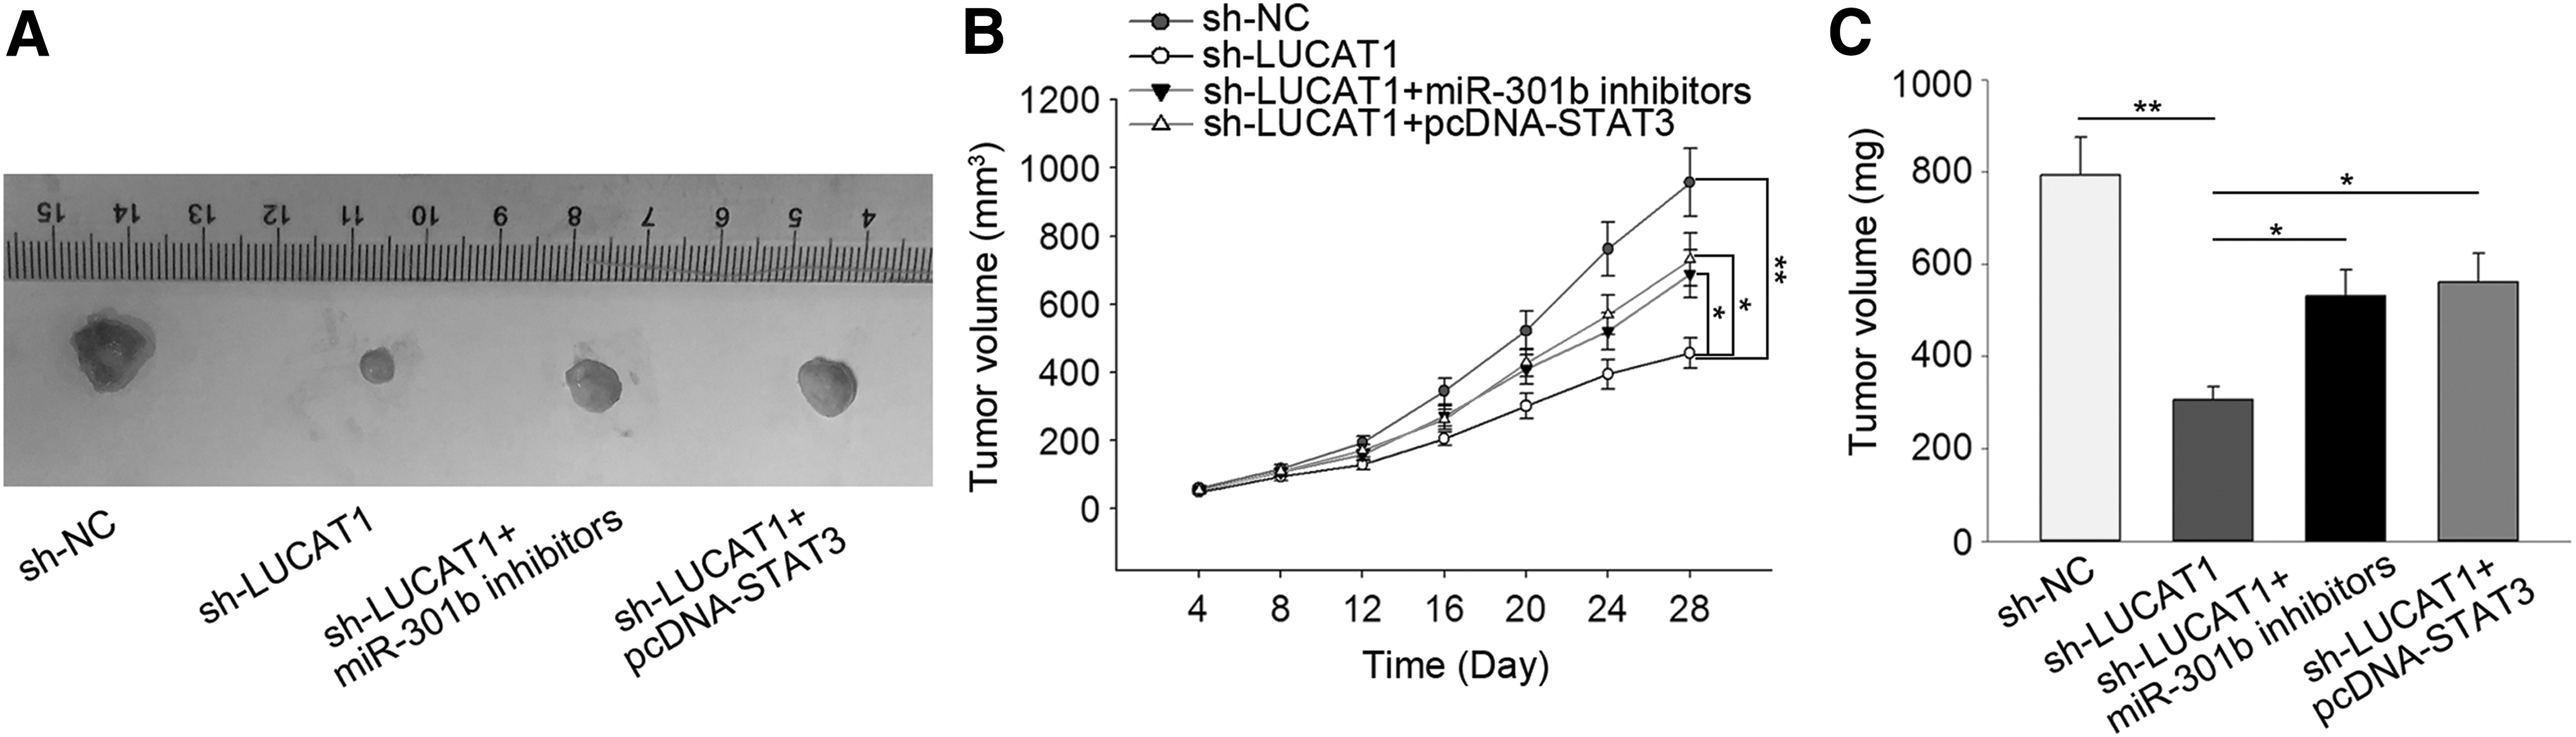
Regulation of HB cell growth in vivo by the LUCAT1–miR-301b–STAT3 axis.
Discussion
Numerous studies have revealed that lncRNA dysregulation is closely correlated with cancer patient prognosis. 27 –30 This study found that upregulation of LUCAT1 was positively correlated with poor overall survival of liver cancer patients in TCGA database. Previous reports have elucidated that LUCAT1 can act as an oncogene in other human cancers. For instance, LUCAT1 promoted the progression of non–small cell lung cancer by epigenetically silencing p21 and p57 expression. 31 Moreover, LUCAT1 can act as a ceRNA in osteosarcoma and ovarian cancer by regulating miRNA/mRNA axes. 32,33 This study investigated the role of LUCAT1 in HB, a subtype of liver cancer.
The upregulation of LUCAT1 was first demonstrated in HB tissues and cell lines. In loss-of-function assays, knockdown of LUCAT1 efficiently suppressed proliferation, migration, invasion, and the EMT process of HB cells, indicating an oncogenic role for LUCAT1 in HB. Mechanistically, lncRNAs can be regulated by the upstream transcription factors. 34,35 Bioinformatics analyses found that STAT3 was a potential transcription activator of LUCAT1. Previous studies demonstrated that STAT3 can promote the transcription of lncRNAs by binding to their promoter region. 36,37 This showed that STAT3 can bind to the LUCAT1 promoter region to enhance LUCAT1 transcription.
STAT3 is targeted by miRNAs in several human cancers. 38,39 This study found 22 potential miRNAs that could target STAT3. The focus was on miR-301b, which has not been previously explored in the context of HB, and luciferase reporter assay and pull-down assays were performed to demonstrate the interaction between miR-301b and STAT3.
By targeting miRNA/mRNA axes, lncRNAs can act as ceRNAs to regulate various biological processes of human malignant tumors. 40 –43 LUCAT1 has been reported to act as a ceRNA in several human malignant tumors. Moreover, previous studies have shown that STAT3 participates in a ceRNA pathway. 44,45 Therefore, this study investigated whether LUCAT1 could act as a ceRNA in HB by upregulating STAT3 to form a feedback loop. The cytoplasmic localization of LUCAT1 in HB cells, together with mechanistic experiments showing that LUCAT1 could bind with miR-301b, suggest that LUCAT1 could indeed act as a ceRNA in HB and regulate the miR-301b/STAT3 axis. Finally, rescue assays carried out in LUCAT1-downregulated HB cells indicated that STAT3 overexpression or miR-301b downregulation promoted cell proliferation, invasion, and migration. Thus, both STAT3 and miR-301b could modulate LUCAT1-mediated HB progression. Taken together, these findings suggest that the STAT3-activated lncRNA LUCAT1 exerts an oncogenic function in HB by acting as a ceRNA of the miR-301b/STAT3 axis. These findings suggest several potential therapeutic targets for HB.
Footnotes
Acknowledgments
This study was supported by the China Postdoctoral Science Foundation (Projects 20080441310 and 201003781) and the Shandong Province Key Research and Development Plan (2016GSF201132).
Author Disclosure
There are no conflicts of interest to disclose.