
Abstract
A fusion protein (C1C2) constructed by fusing the intracellular C1 and C2 segments of adenylyl cyclase type 6 (AC6) retains beneficial effects of AC6 expression, without increasing cyclic adenosine monophosphate generation. The effects of cardiac-directed C1C2 expression in pressure overload is unknown. Left ventricular (LV) pressure overload was induced by transverse aortic constriction (TAC) in C1C2 mice and in transgene negative (TG–) mice. Four weeks after TAC, LV systolic function and diastolic function were measured, and Ca2+ handling was assessed. Four weeks after TAC, TG– animals showed reduced LV peak +dP/dt. LV peak +dP/dt in C1C2 mice was statistically indistinguishable from that of normal mice and was higher than that seen in TG– mice 4 weeks after TAC (p = 0.02), despite similar and substantial cardiac hypertrophy. In addition to higher LV peak +dP/dt in vivo, cardiac myocytes from C1C2 mice showed shorter time-to-peak Ca2+ transient amplitude (p = 0.002) and a reduced time constant of cytosolic Ca2+ decline (Tau; p = 0.003). Sarcomere shortening fraction (p < 0.03) and the rate of sarcomere shortening (p < 0.02) increased in C1C2 cardiac myocytes. Myofilament sensitivity to Ca2+ was increased in systole (p = 0.02) and diastole (p = 0.04) in C1C2 myocytes. These findings indicate enhanced Ca2+ handling associated with C1C2 expression. Favorable effects on Ca2+ handling and LV function were associated with increased LV SERCA2a protein content (p = 0.015) and reduced LV fibrosis (p = 0.008). Cardiac-directed C1C2 expression improves Ca2+ handling and increases LV contractile function in pressure overload. These data provide a rationale for further exploration of C1C2 gene transfer as a potential treatment for heart failure.
Introduction
Heart failure (HF) has a prevalence of nearly 6 million in the United States and >23 million worldwide. 1,2 Hypertension is a prevalent problem and a major cause of HF, and is important in both HF with preserved ejection fraction (HFpEF) and HF with reduced ejection fraction (HFrEF). Agents that increase contractile function—a laudable goal in HF—have not met with much success, and in addition, new treatments for HF, which are very much needed, have not been resplendent in recent years. New treatments are necessary.
Adenylyl cyclase (AC), a membrane protein in cardiac myocytes and other cells, is the effector molecule in the β-adrenergic receptor (βAR) signaling pathway, catalyzing conversion of ATP to cyclic adenosine monophosphate (cAMP). Mammalian AC consists of two transmembrane domains and two cytoplasmic domains (C1 and C2). The C1 and C2 domains form the catalytic core of AC. Many of the beneficial effects of AC6 that have previously been described are independent of cAMP generation and appear instead to involve intracellular AC6–protein interactions. 3,4 By removal of the two transmembrane domains of AC6 and fusing the two cytoplasmic domains (Fig. 1), a smaller protein was generated with an intact catalytic core that is not responsive to membrane-associated βAR stimulation, but with increased likelihood for interactions with intracellular signaling proteins. Its smaller size (compared to AC6) and its solubility in cytoplasm 5 would facilitate such intracellular interactions. The smaller size would also facilitate expression in adeno-associated virus vectors for future clinical studies. C1C2 retains binding sites for Gα, forskolin, ATP, Mg2+, as well as for some important regulatory proteins, such as snapin, A-kinase-anchoring protein (AKAP), PH domain leucine-rich protein phosphatase 2 (PHLPP2), and the phosphorylation or dephosphorylation sites for protein kinase A (PKA). 6
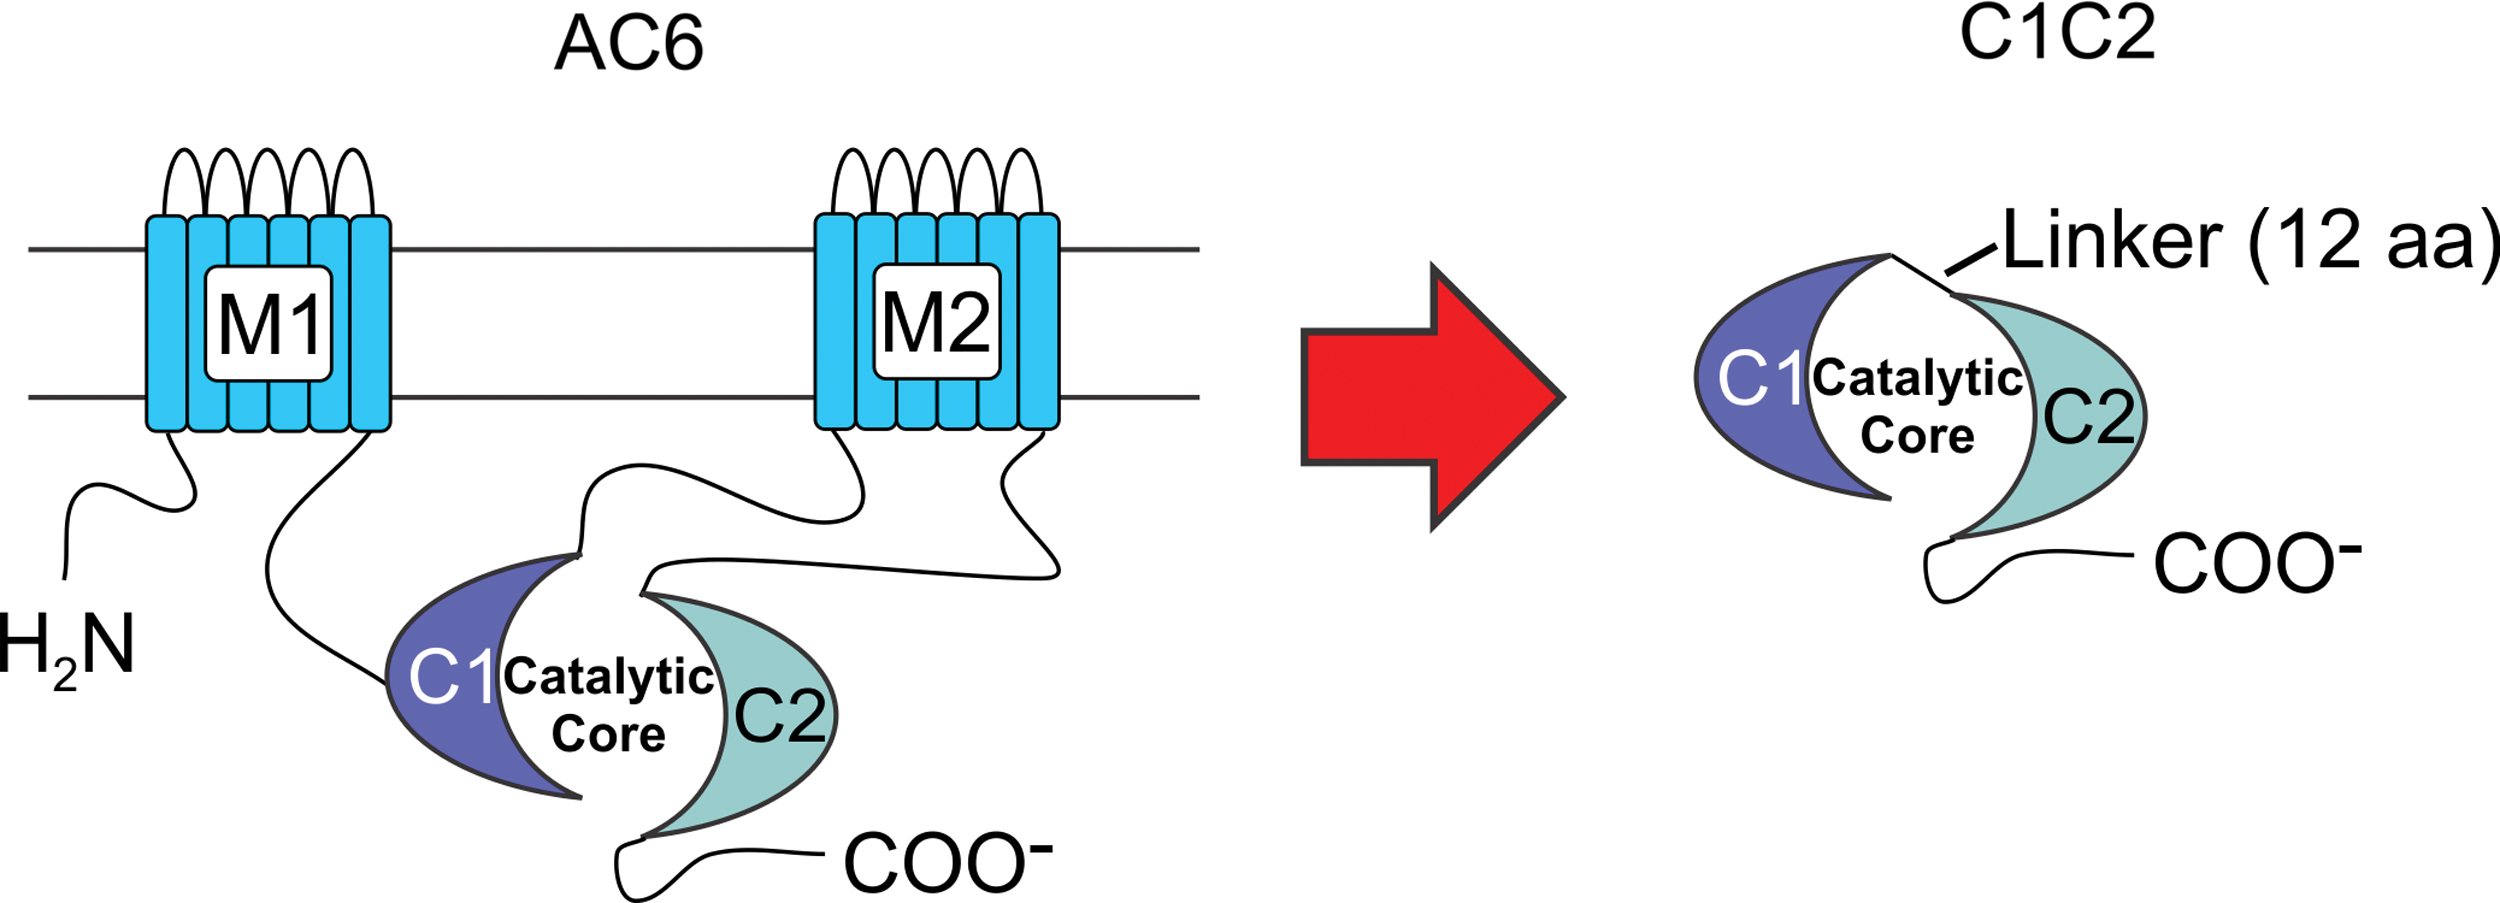
C1C2 design. The diagram depicts the C1C2 construct that forms the catalytic core. M1 and M2, transmembrane domains of AC6; C1 and C2, cytoplasmic domains of AC6; Linker, 12 amino acids. Color images are available online.
These characteristics of C1C2—small size, solubility, retention of regulatory binding sites, and disengagement from cell-surface βAR stimulation—make it an attractive way to increase the function of the failing heart safely and effectively. A Phase II randomized clinical trial in patients with symptomatic HF showed that AC6 gene transfer is safe and potentially effective, and not associated with increased cardiac arrhythmias. 7 However, a modified AC6 that circumvents production of cAMP could have advantages and is a motivation for the current studies. Indeed, it was recently shown that in mice with cardiac-directed expression of C1C2, sustained isoproterenol infusion increases rather than decreases left ventricular (LV) function, despite attenuated cAMP generation. 8
Although the isoproterenol infusion model of cardiomyopathy is useful and mimics aspects of clinical HF, to obtain a more complete picture of the potential benefits of LV C1C2 expression, studies in pressure overload—a major cause of clinical HF—were conducted. Indeed, before advancing a new therapy to clinical trials, it is imperative to be certain that the strategy is safe and effective in more than a single model of disease. There are striking differences between sustained isoproterenol infusion versus pressure overload, especially when using a transgene expected to reduce cAMP generation, which would not be expected to influence response to pressure stress. The present study tested the hypothesis that cardiac-directed expression of C1C2, through adaptations in cytosolic Ca2+ handling, would preserve LV contractile function in the setting of severe pressure stress.
Methods
Generation of C1C2 fusion protein
The C1C2 fusion protein was generated from a DNA construct containing the cytoplasmic domain 1 (C1 encoding amino acids 349-576) and the cytoplasmic domain 2 (C2 encoding amino acids 939-1157) of the mouse AC type 6 (AC6) gene linked by a DNA segment encoding 12 amino acids (AAAGGIPPAAAM). The 3′ of the C2 gene was also linked with 18 nucleotides encoding AU1 epitope tag (DTYRYI) to facilitate detection. 8
Generation of C1C2 transgenic mice
Mice (C57BL/6) were used with approval by the Institutional Animal Care and Use Committee of VA San Diego Healthcare System. The generation and characterization of the cardiac-directed C1C2 murine lines have been described previously. 8 Variable transgene mRNA expression in two lines was documented, and a line with a 23-fold increase in C1C2 mRNA expression (vs. endogenous AC6) was used in this study. C1C2 protein was increased by 13-fold relative to that of the AU1 signal in transgene negative (TG–) mice. Ninety-two mice (45 male, 47 female) with a mean age of 9 ± 0.1 months and a mean weight of 31 ± 0.5 g were used. All mice used were C57BL/6 background. To determine mortality, 34 mice (17 per group) were set aside and underwent no interventions after TAC.
TAC
Mice were anesthetized with 5% isoflurane in oxygen (1 L/min), intubated, and ventilated (pressure controlled). Anesthesia was maintained with 1% isoflurane in oxygen. The chest was entered at the second intercostal space at the left upper sternal border, and a segment of the aortic arch between the innominate and left carotid arteries dissected. A 7-0 silk suture was tied against a 26-gauge needle, which yields a substantial aortic constriction. Collaborators at the authors' institution using these methods documented mean pressure gradients across the constriction of >45 mmHg. 9
Study design
Three groups of mice were studied: (1) control mice that did not receive TAC; (2) mice with cardiac-directed C1C2 expression that were studied 4 weeks after TAC; and (3) TG– mice that were studied 4 weeks after TAC. For immunoblotting, a fourth group was included (C1C2, no TAC).
Echocardiography
Echocardiography was performed 28 ± 1 days after TAC using a Vevo 3100 system with a MX550s (32–55 MHz) transducer (FUJIFILM VisualSonics, Inc., Toronto, Canada), as previously described. 8 TG– mice with no TAC (n = 7) served as controls. Previously, no baseline echocardiographic differences were shown in C1C2 versus TG– mice. 8 For anesthesia, 5% isoflurane at a flow rate of 1 L/min oxygen was used, and this was maintained with 1% isoflurane in oxygen.
LV systolic and diastolic function
Mice were anesthetized by intraperitoneal injection of sodium pentobarbital (80 mg/kg). A 1.4 F micromanometer catheter (SPR 839; Millar Instruments, Houston, TX) was advanced via the right carotid artery across the aortic valve and into the LV to measure the LV pressure. The data were recorded and analyzed using IOX v2.9 (Emka Technologies, Christchurch, VA), as previously reported. 10
Cardiac myocyte isolation
Cardiac myocytes were isolated with the use of modified methods, as previously reported. 10,11
Ca2+ transients and sarcomere shortening
Cytosolic Ca2+ transients in isolated cardiac myocytes were measured using indo-1 AM, as previously described 12 with modifications. Cardiac myocytes were plated onto laminin precoated glass cover slips and loaded with indo-1 AM (5 μM; Life Technologies, Carlsbad, CA) and dispersing agent, pluronic F-127 (0.02 mg/mL; Life Technologies) for 20 min. After dye loading, cover slips were placed in a field stimulation superfusion chamber and then mounted on an inverted microscope (Nikon TMD, Tokyo, Japan) equipped with a photomultiplier tube-based fluorescence imaging system (PTI, Edison, NJ). During the measurements, cardiac myocytes were continuously perfused with KRH solution (125 mM NaCl, 5 mM KCl, 1.2 mM NaH2PO4, 6 mM glucose, 1.2 mM MgCl2, and 25 mM HEPES, pH 7.37–7.38) containing 2 mM CaCl2. Cardiac myocytes were field stimulated at 0.3 Hz with amplitude of 10 V and a pulse width of 10 ms. Excitation wavelength was set to 365 nm via a monochromator. Fluorescence emission was slit and directed to two photomultiplier tubes through 20 nm band-pass filters centered at 405 and 485 nm, respectively. The ratio F405/485 represents a measure for (Ca2+)i, and EC50 for sarcomere shortening is calculated based on this ratio. Focusing on a region including several consecutive sarcomeres, simultaneous fractional shortening of sarcomere length was measured using a video edge camera (Flare 2M360-CL; IO Industries, London, Canada) attached to the fluorescence imaging system. Ca2+ transients and sarcomere length shortening data were analyzed using FelixGX software (PTI) and Clampfit software (Molecular Devices, Sunnyvale, CA).
Reverse transcription polymerase chain reaction
Quantitative reverse transcription polymerase chain reaction (RT-PCR) was conducted to detect the expression level of mRNA of hypertrophy and fibrosis related proteins, as previously described. 13
Immunoblotting
Western blots were performed to assess the expression of total or phosphorylated proteins from frozen LV samples. The following antibodies were used: SERCA2a (1:500 dilution; ENZO, Exeter, United Kingdom); p16-PLB (1:5,000 dilution; Badrilla, Leeds, United Kingdom); p17-PLB (1:5,000 dilution; Badrilla); p-TnI (1:500 dilution; Cell Signaling Technology, Danvers, MA); p-CaMKII (1:200 dilution; Santa Cruz Biotechnology, Dallas, TX); p-PKA (1:1,000 dilution; Cell Signaling Technology); p-PKC (1:1,000 dilution; Cell Signaling Technology); p-Akt (1:1,000 dilution; Cell Signaling Technology); and GAPDH (1:20,000 dilution; Fitzgerald, Acton, MA). Protein quantification was conducted using Image Lab software (Bio-Rad, Hercules, CA).
Necropsy and histology
Body, liver, lung, and LV weights (including interventricular septum) were recorded. Transmural sections of the LV were fixed in 10% formalin (Sigma–Aldrich, St. Louis, MO), paraffin-embedded, sliced into 5 μm sections, mounted, and then counterstained with picrosirius red (to evaluate fibrosis) and hematoxylin and eosin. The slides were scanned using an Axio Scan Z1 slide scanner (Carl Zeiss, Oberkochen, Germany). Quantitative assessment of fibrosis, conducted on picrosirius red-stained sections, was performed using ImageJ software (NIH, Bethesda, MD). The remaining LV was frozen in liquid nitrogen and stored (−80°C).
Statistical analysis
Data acquisition and analysis were done without knowledge of group identity. Group sizes were determined by power calculations, and male and female mice were used in equal proportions. The hypothesis was that cardiac-directed expression of C1C2, through adaptations in cytosolic Ca2+ handling, would preserve LV contractile function in the setting of severe pressure stress. Therefore, the key statistical comparison was between C1C2 and TG– mice 4 weeks after TAC, and group differences were tested via Student's t-test (unpaired and two-tailed). In order to confirm that the intervention (TAC) was successful in inducing the expected alterations in LV structure and function, an age- and sex-matched control group of TG– mice that did not undergo TAC was also included. Immunoblotting was performed in four groups: TG– and C1C2 mice without TAC, and TG– and C1C2 mice 4 weeks after TAC. Differences in response to TAC versus C1C2 were assessed by Student's t-test (unpaired and two-tailed). Analyses were performed using GraphPad Prism, version 7.0 (GraphPad Software, Inc., San Diego, CA). The null hypothesis was rejected when p < 0.05.
Results
LV function and dimensions
Echocardiography
Results of the echocardiography (Table 1) show that EF fell and LV ESD increased 4 weeks after TAC to similar degrees in TG– and C1C2 mice. End diastolic thickness of the posterior wall (p = 0.0002) increased 4 weeks after TAC, with no between-group differences (TG– vs. C1C2).
Echocardiography
Echocardiographic measures of LV dimension and function. Values are the mean ± standard error (SE). p-Values are from Student's t-test (unpaired and two-tailed) comparing TG– mice to C1C2 mice 4 weeks after TAC. To confirm expected changes after TAC, Student's t-test was used to compare No TAC to TG– TAC.
p < 0.001; b p = 0.06; c p < 0.04; d p = 0.0002 (p-values corrected for multiple comparisons with Bonferroni correction).
No TAC, transgene negative (TG–) and no transverse aortic constriction (TAC); TG–, mice without C1C2 expression that underwent TAC; C1C2, transgenic mice with cardiac-directed C1C2 expression that underwent TAC; EF, ejection fraction; EDD, end diastolic diameter; ESD, end systolic diameter; PW, posterior wall thickness (end diastole); IVS, interventricular wall thickness (end diastole); HR, heart rate.
LV pressure development and decay
It was important to obtain a measure of LV function less load-dependent than EF, especially in the setting of LV obstruction to ejection imposed by transverse aortic constriction. Therefore, using micromanometer catheters, peak LV pressure development was measured, which is less load-sensitive than ejection phase indexes of LV function such as EF. Four weeks after TAC, compared to control mice (no TAC), TG– animals showed reductions in LV peak +dP/dt (p = 0.04), while C1C2 mice showed no such reductions (Table 2). These results indicate that C1C2 expression enabled the LV to maintain normal function despite marked pressure overload and LV hypertrophy. Consequently, LV peak +dP/dt was 19% higher than that in TG– mice (p = 0.02; Table 2). LV peak −dP/dt showed no group differences, although it tended to be lower after TAC in TG– mice than in C1C2 mice (p = 0.09). C1C2 mice tended to have higher LV developed pressure than TG– mice after TAC (p < 0.06; Table 2). There was no group difference in mortality 4 weeks after TAC placement: TG–, 3/17 died; C1C2, 4/17 died (p = 0.76). The deaths were unwitnessed and likely were cardiac in nature, with pleural fluid observed in most mice.
LV function
The No TAC group is TG– mice. C1C2 expression did not alter pre-TAC values.
LV function was superior in C1C2 mice compared to TG– mice: LV peak +dP/dt and LV developed pressure were increased, and LV peak −dP/dt tended to increase, reaching normal levels. Values are the mean ± SE. p-Values are from Student's t-test (unpaired and two-tailed). To determine changes after TAC, Student's t-test was used to compare no TAC and TG– TAC.
p = 0.04; b p = 0.02 (p-values corrected for multiple comparisons with Bonferroni correction).
LV, left ventricular; +dP/dt, peak rate of LV pressure development; −dP/dt, peak rate of LV pressure decline.
Ca2+ handling
Ca2+ transients
To investigate the underlying Ca2+ handling changes, Ca2+ transients were measured in cardiac myocytes isolated 4 weeks after TAC from C1C2 and TG– mice and from TG– mice that had not undergone TAC. Four weeks after TAC cardiac myocytes from C1C2 mice showed superior Ca2+ handling compared to TG–mice. Ca2+ transient amplitude was higher (Fig. 2A and B; p = 0.047), time-to-peak Ca2+ transient amplitude was shorter (Fig. 2C; p = 0.002 vs. TG–), and the time constant of cytosolic Ca2+ decline (Tau) was more rapid (Fig 2D; p = 0.003 vs. TG–). These favorable effects of cardiac-directed C1C2 indicate superior Ca2+ handling after TAC.
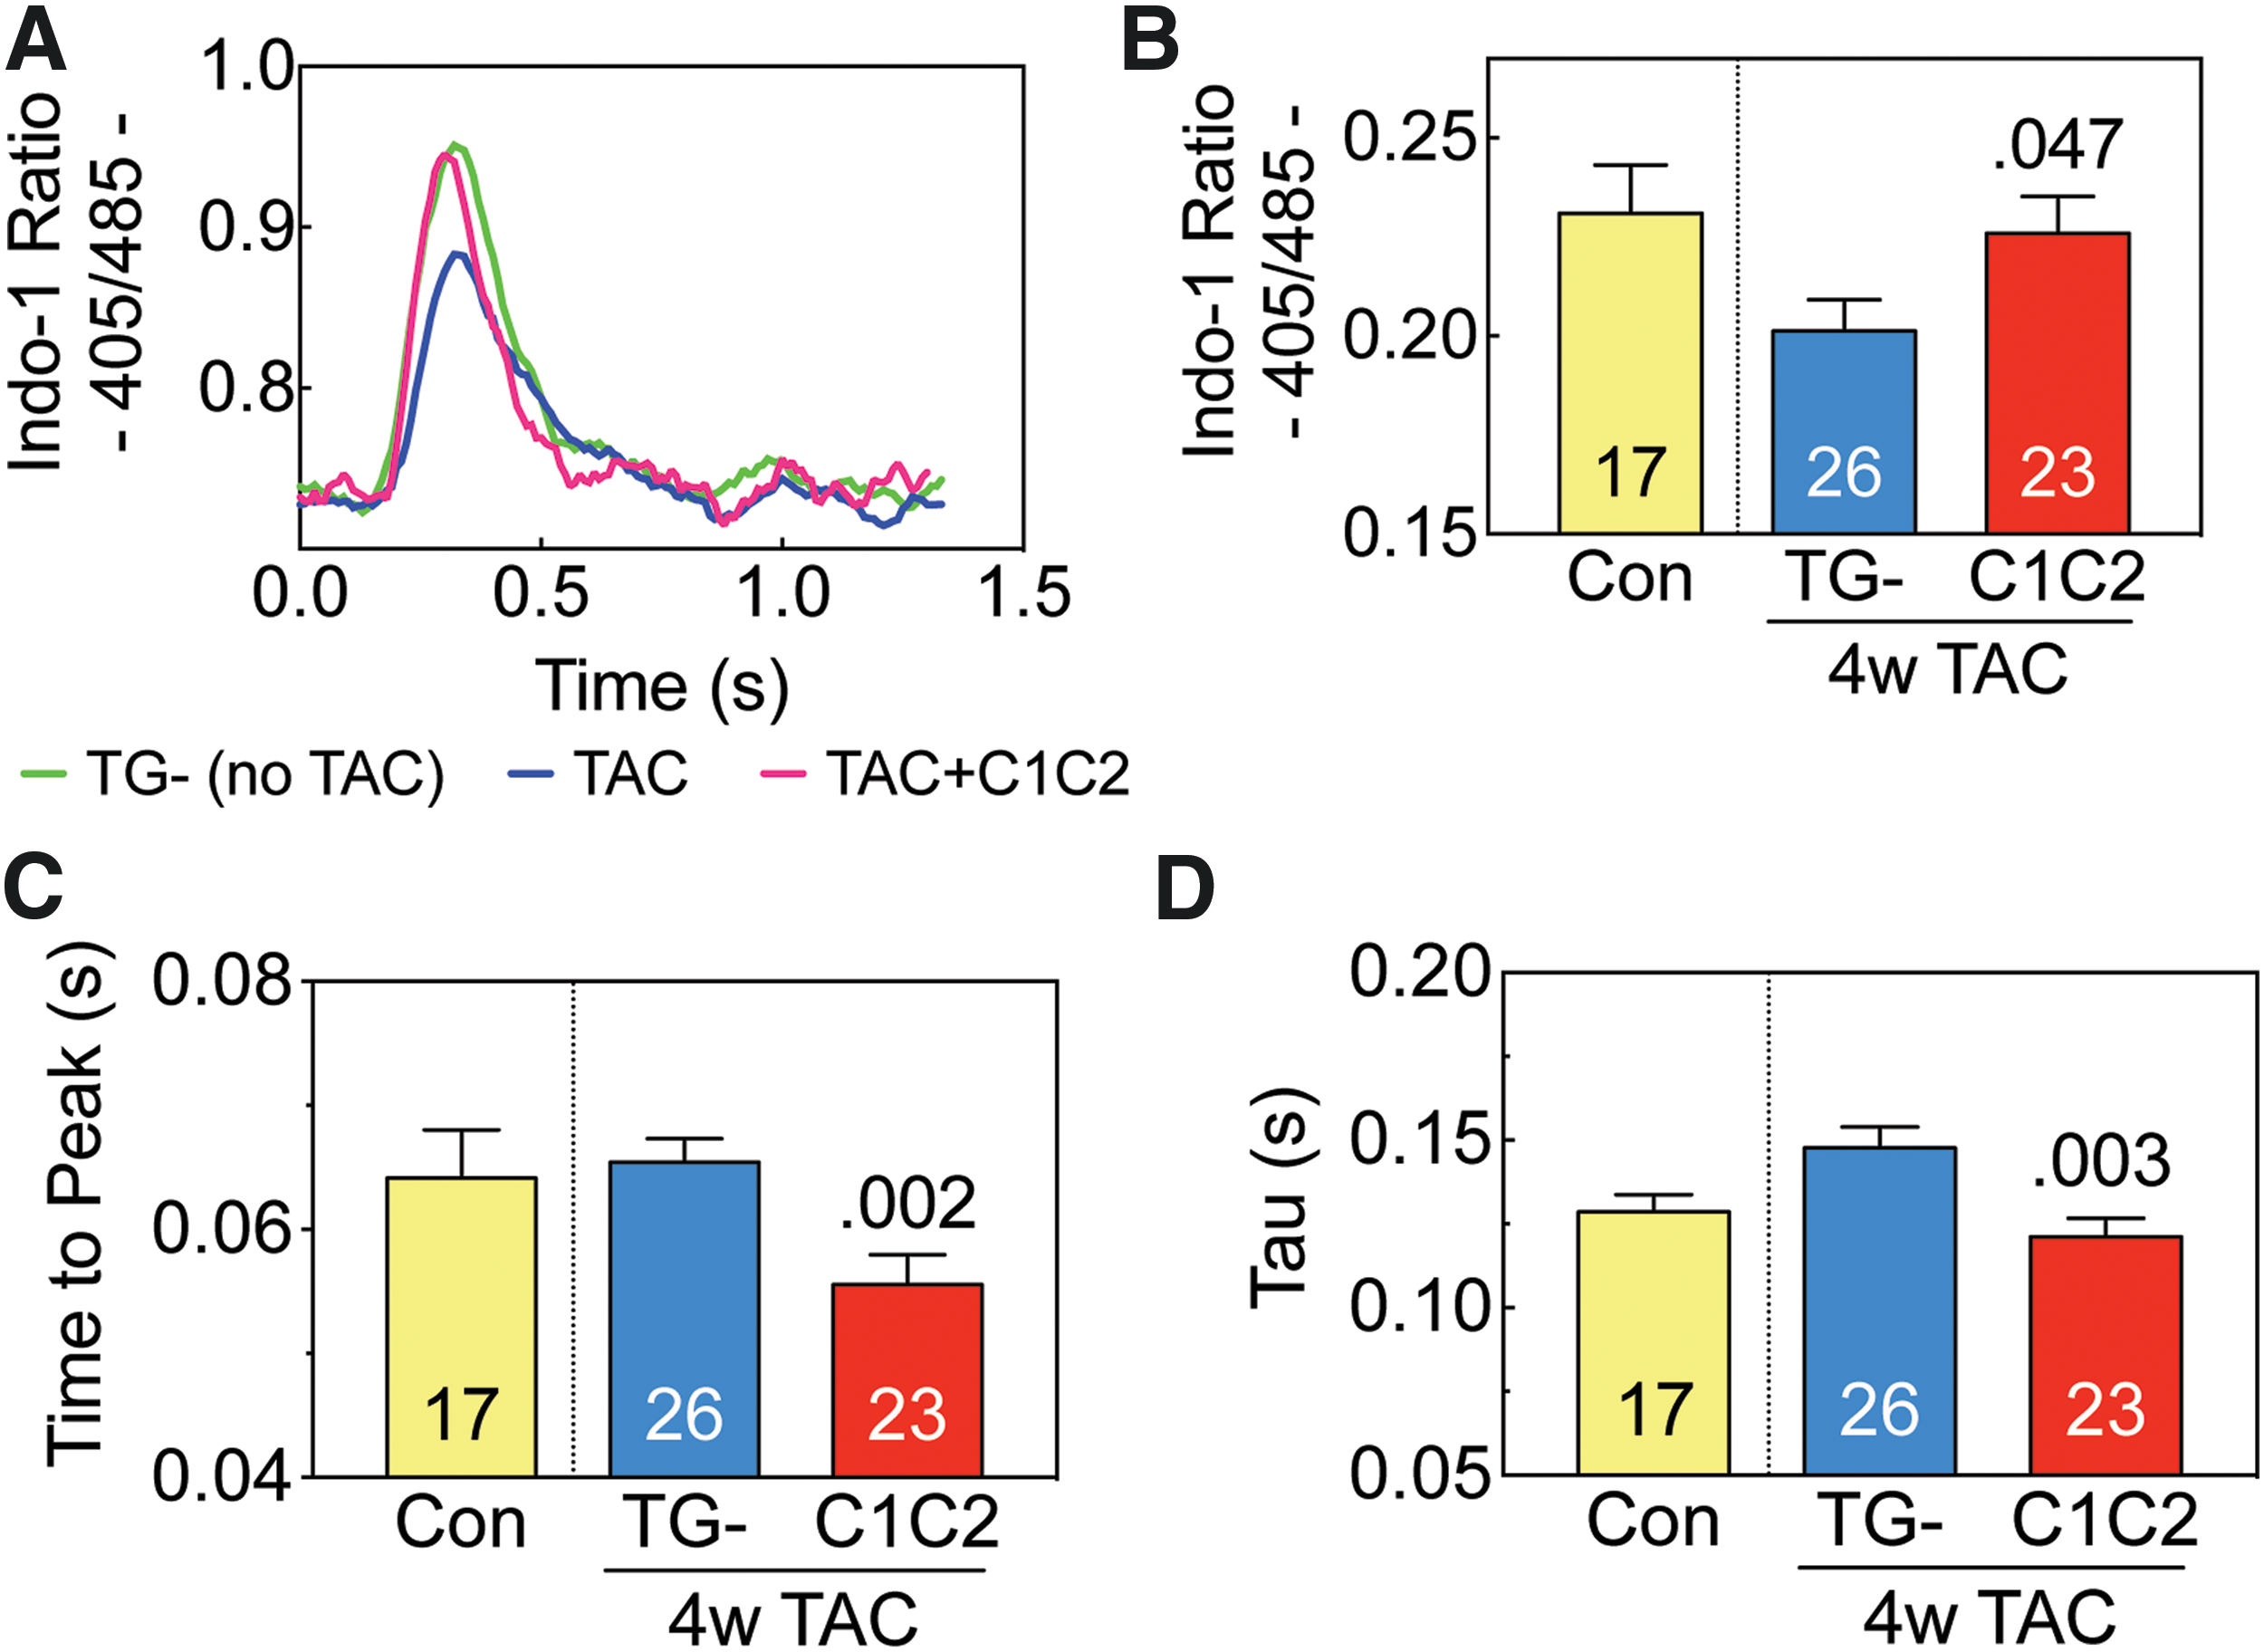
Ca2+ transients. Cardiomyocytes were isolated from control mice (Con: no transverse aortic constriction [TAC], no C1C2 expression) and from transgene negative (TG–) and C1C2 mice 4 weeks after TAC. Cytosolic Ca2+ transients were measured with a fluorescence microscope using the Ca2+ indicator, Indo-1 AM.
Sarcomere shortening
As an additional means to assess cardiac function, sarcomere shortening in cardiac myocytes was measured 4 weeks after TAC (Fig. 3). Cardiac myocytes isolated from mice with cardiac-directed C1C2 expression showed less deterioration in performance versus TG– mice. Sarcomere fractional shortening (Fig. 3A and B; p = 0.03) and the peak rate of sarcomere shortening (+dL/dt; Fig. 3C; p < 0.02) were both higher. The peak rate of sarcomere lengthening (-dL/dt) tended to be more rapid in cardiac myocytes from C1C2 mice (Fig. 3D; p = 0.08). These favorable effects of cardiac-directed C1C2 indicate superior cardiac myocyte function after TAC.

Sarcomere shortening. Cardiomyocytes were isolated from control mice (Con: no TAC or C1C2 expression) and from TG– and C1C2 mice 4 weeks after TAC. Sarcomere length and shortening were measured using edge detection.
Myofilament sensitivity to Ca2+
Using Ca2+ transient measurements and sarcomere shortening, myofilament sensitivity to Ca2+ was analyzed. Indo-1 F405/485 ratio was used as an estimate of (Ca2+)i. Cardiac myocytes from mice with cardiac-directed C1C2 expression showed higher Ca2+ sensitivity, defined as reduced Ca2+ concentration required to attain 50% of maximal sarcomere shortening (EC50). In cardiac myocytes isolated from C1C2 mice 4 weeks after TAC, EC50 for Ca2+ was lower during contraction (Fig. 4A and B; p = 0.02) and relaxation (Fig. 4A and C; p = 0.04) compared to TG– mice.
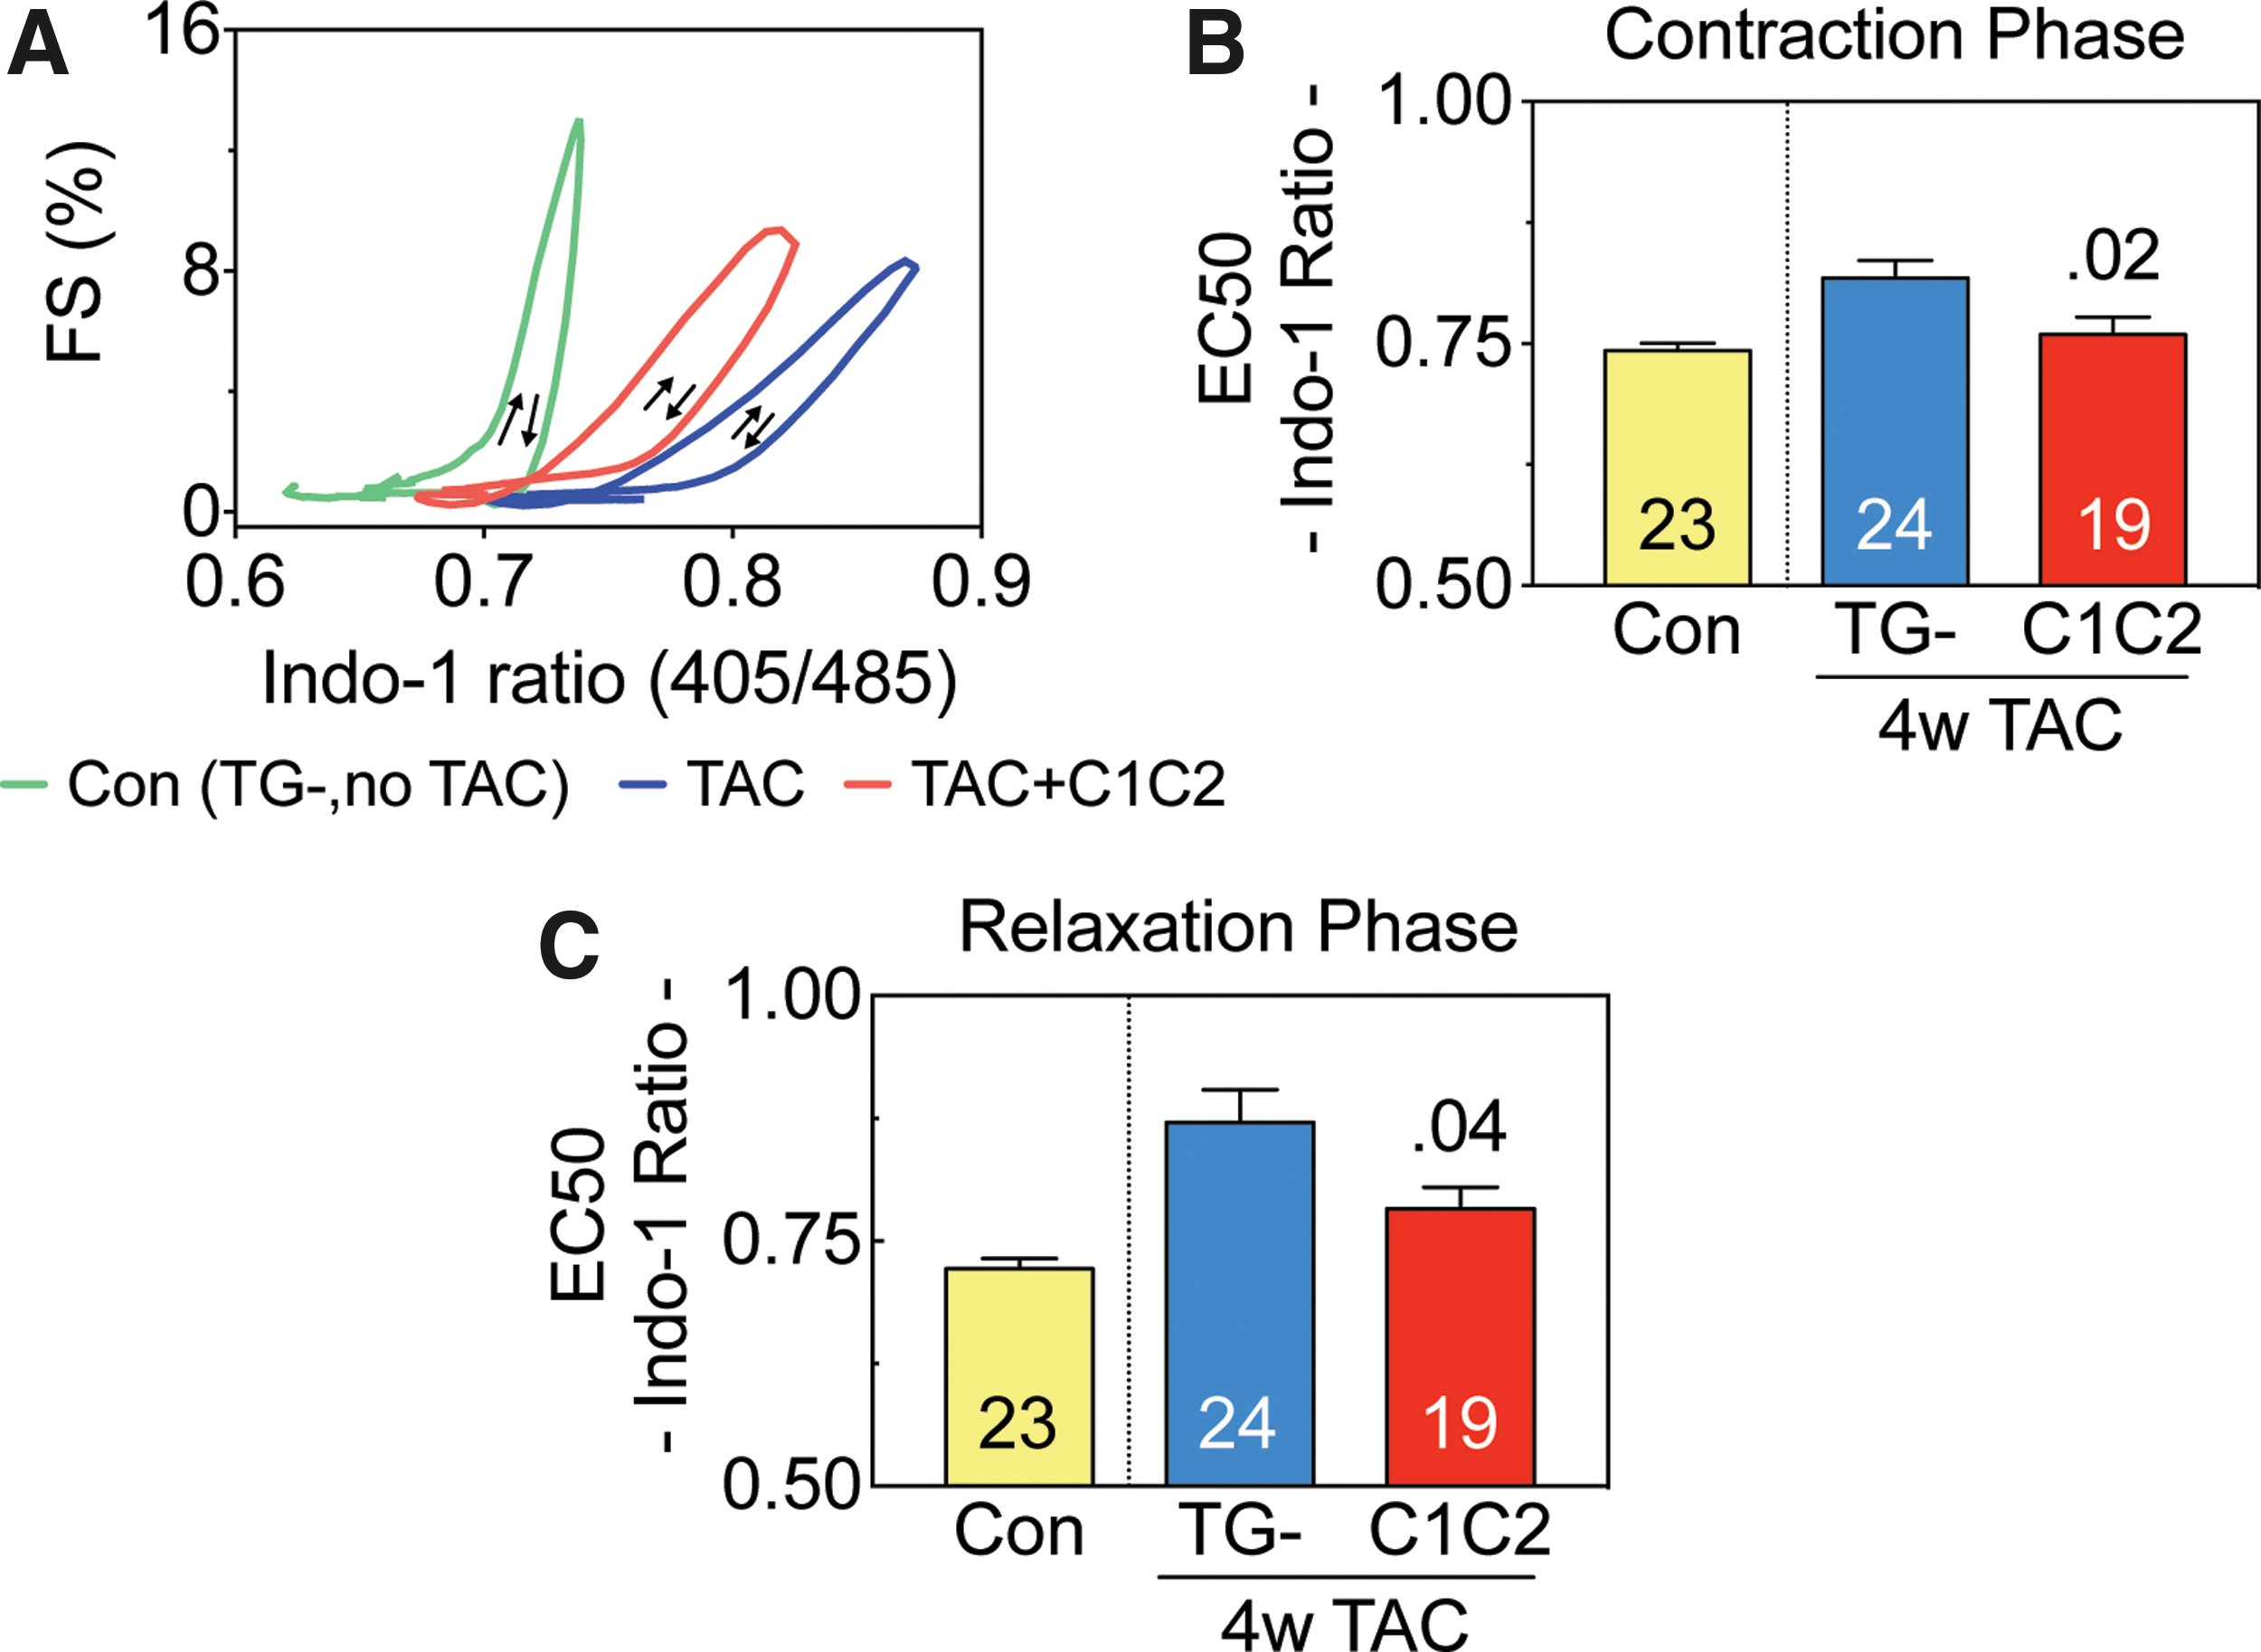
Myofilament sensitivity. Myofilament sensitivity to Ca2+ was analyzed based on Ca2+ transients and simultaneous sarcomere shortening in cardiomyocytes from C1C2 mice and TG– mice 4 weeks after TAC.
LV Ca2+ handling protein expression
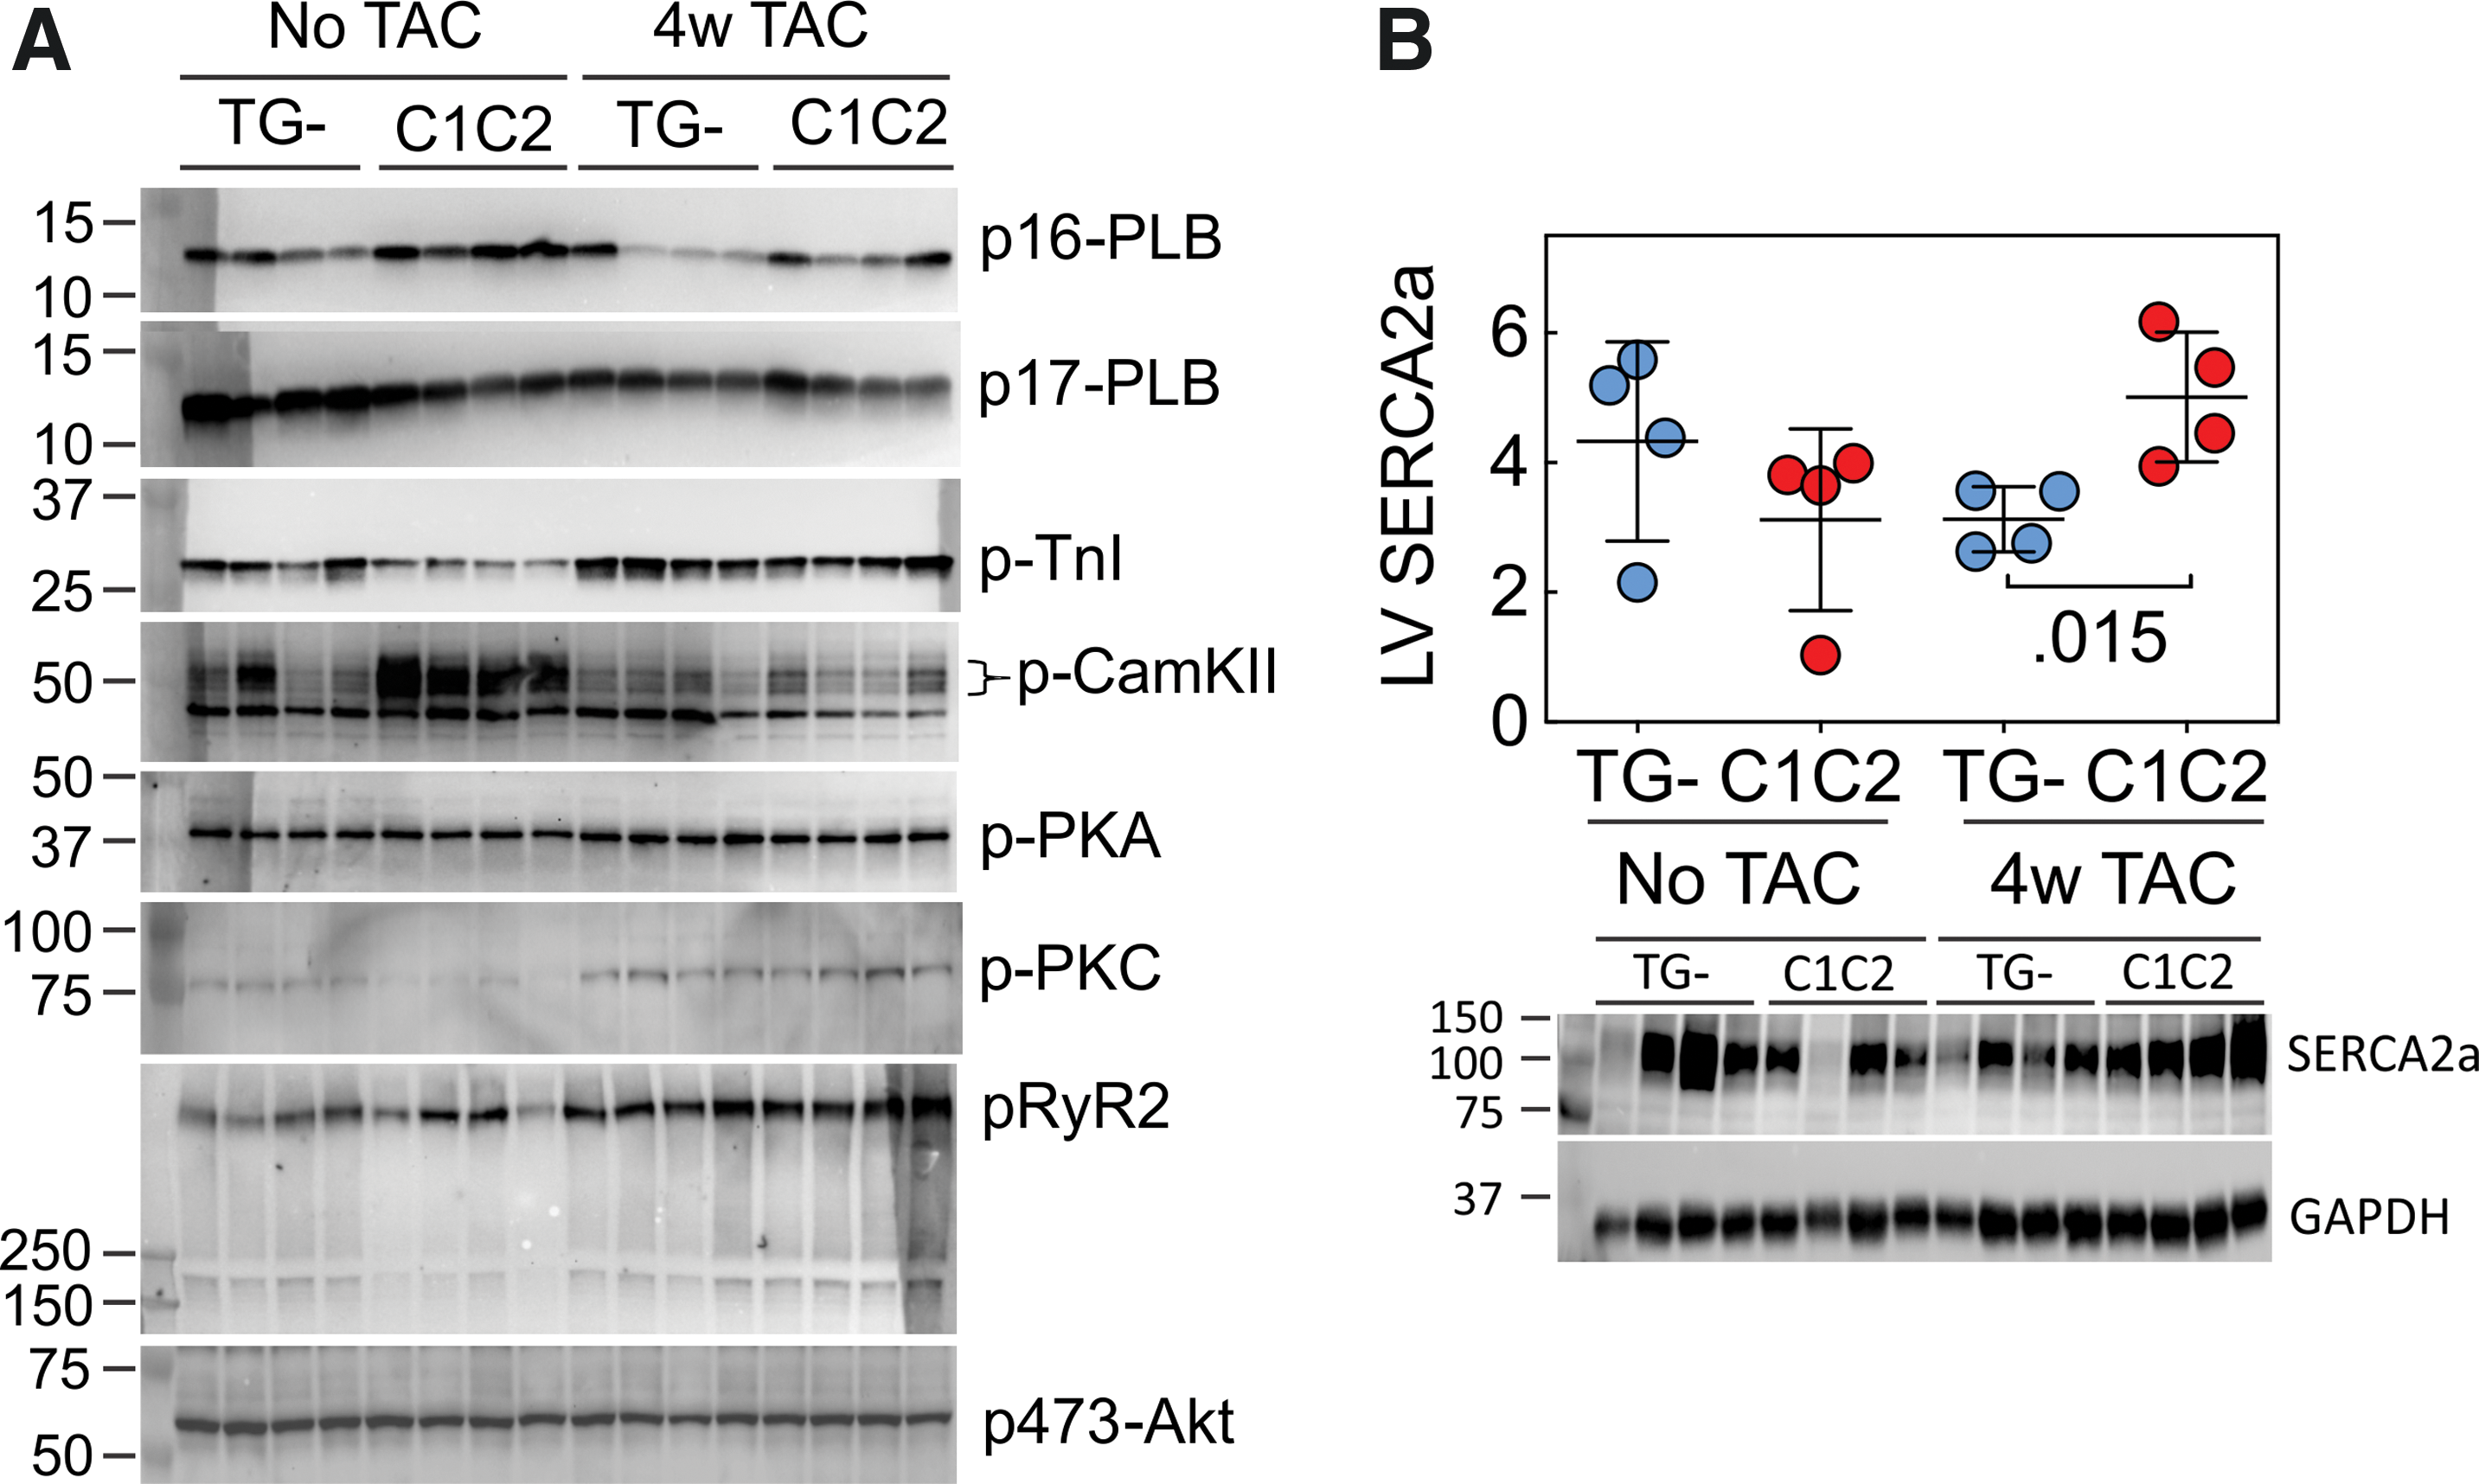
To determine potential mechanisms underlying the favorable effects of cardiac-directed C1C2 expression in the setting of pressure overload, immunoblotting was used to assess key signaling proteins. Four weeks after TAC (but not prior to TAC), LV samples from C1C2 mice showed a 1.6-fold higher sarco/endoplasmic reticulum Ca2+-ATPase (SERCA2a) protein content compared to TG–mice (p = 0.017; Fig. 5 and Table 3). There were no group differences in LV expression of phosphorylated forms of phospholamban (PLB), troponin I, PKA, PKC, RyR2, or Akt in LV samples from TG– mice compared to mice with cardiac-directed C1C2 expression either without TAC or 4 weeks after TAC. LV CaMKII content was higher in C1C2 mice compared to TG– mice without TAC (2.6-fold; p < 0.006), but there was no group difference in LV CaMKII 4 weeks after TAC (Fig. 5 and Table 3).
Immunoblotting.
Ca2+ handling and related proteins
Values are the mean ± SE (arbitrary densitometric units) and reflect relative expression versus GAPDH or vinculin (RyR2). p-Values are from Student's t-test (unpaired and two-tailed). See Fig. 5 for immunoblots.
PLB, phospholamban; TnI, troponin I; CaMKII, Ca2+/Calmodulin-dependent protein kinase-II; PKA, protein kinase A; PKC, protein kinase C; RyR2, ryanodine receptor-2.
LV mRNA expression of markers of hypertrophy and fibrosis
As anticipated, there were increases in LV mRNA expression of multiple markers of LV stress 4 weeks after TAC (Table 4): atrial natriuretic factor (p = 0.05), brain natriuretic peptide (p = 0.02), β-myosin heavy chain (β-MHC; p = 0.003), α-skeletal actin (p = 0.015), collagen1α1 and collagen3α1 (p = 0.002 for both). However, there were no group differences between C1C2 vs TG- after TAC (Table 4).
LV mRNA expression of markers of hypertrophy and fibrosis
Values are relative expression from LV samples. These data were normalized to expression of the housekeeping gene, hypoxanthine guanine phosphoribosyl transferase (HPRT). Values are the mean ± SE and reflect relative expression versus the control gene. p-Values are from Student's t-test (unpaired and two-tailed).a p = 0.05; b p = 0.02; c p = 0.003; d p = 0.015 (corrected for multiple comparisons with Bonferroni correction).
Histology
Transmural LV samples from C1C2 mice 4 weeks after TAC showed less fibrosis in C1C2 compared to TG– mice (Fig. 6; p = 0.008).
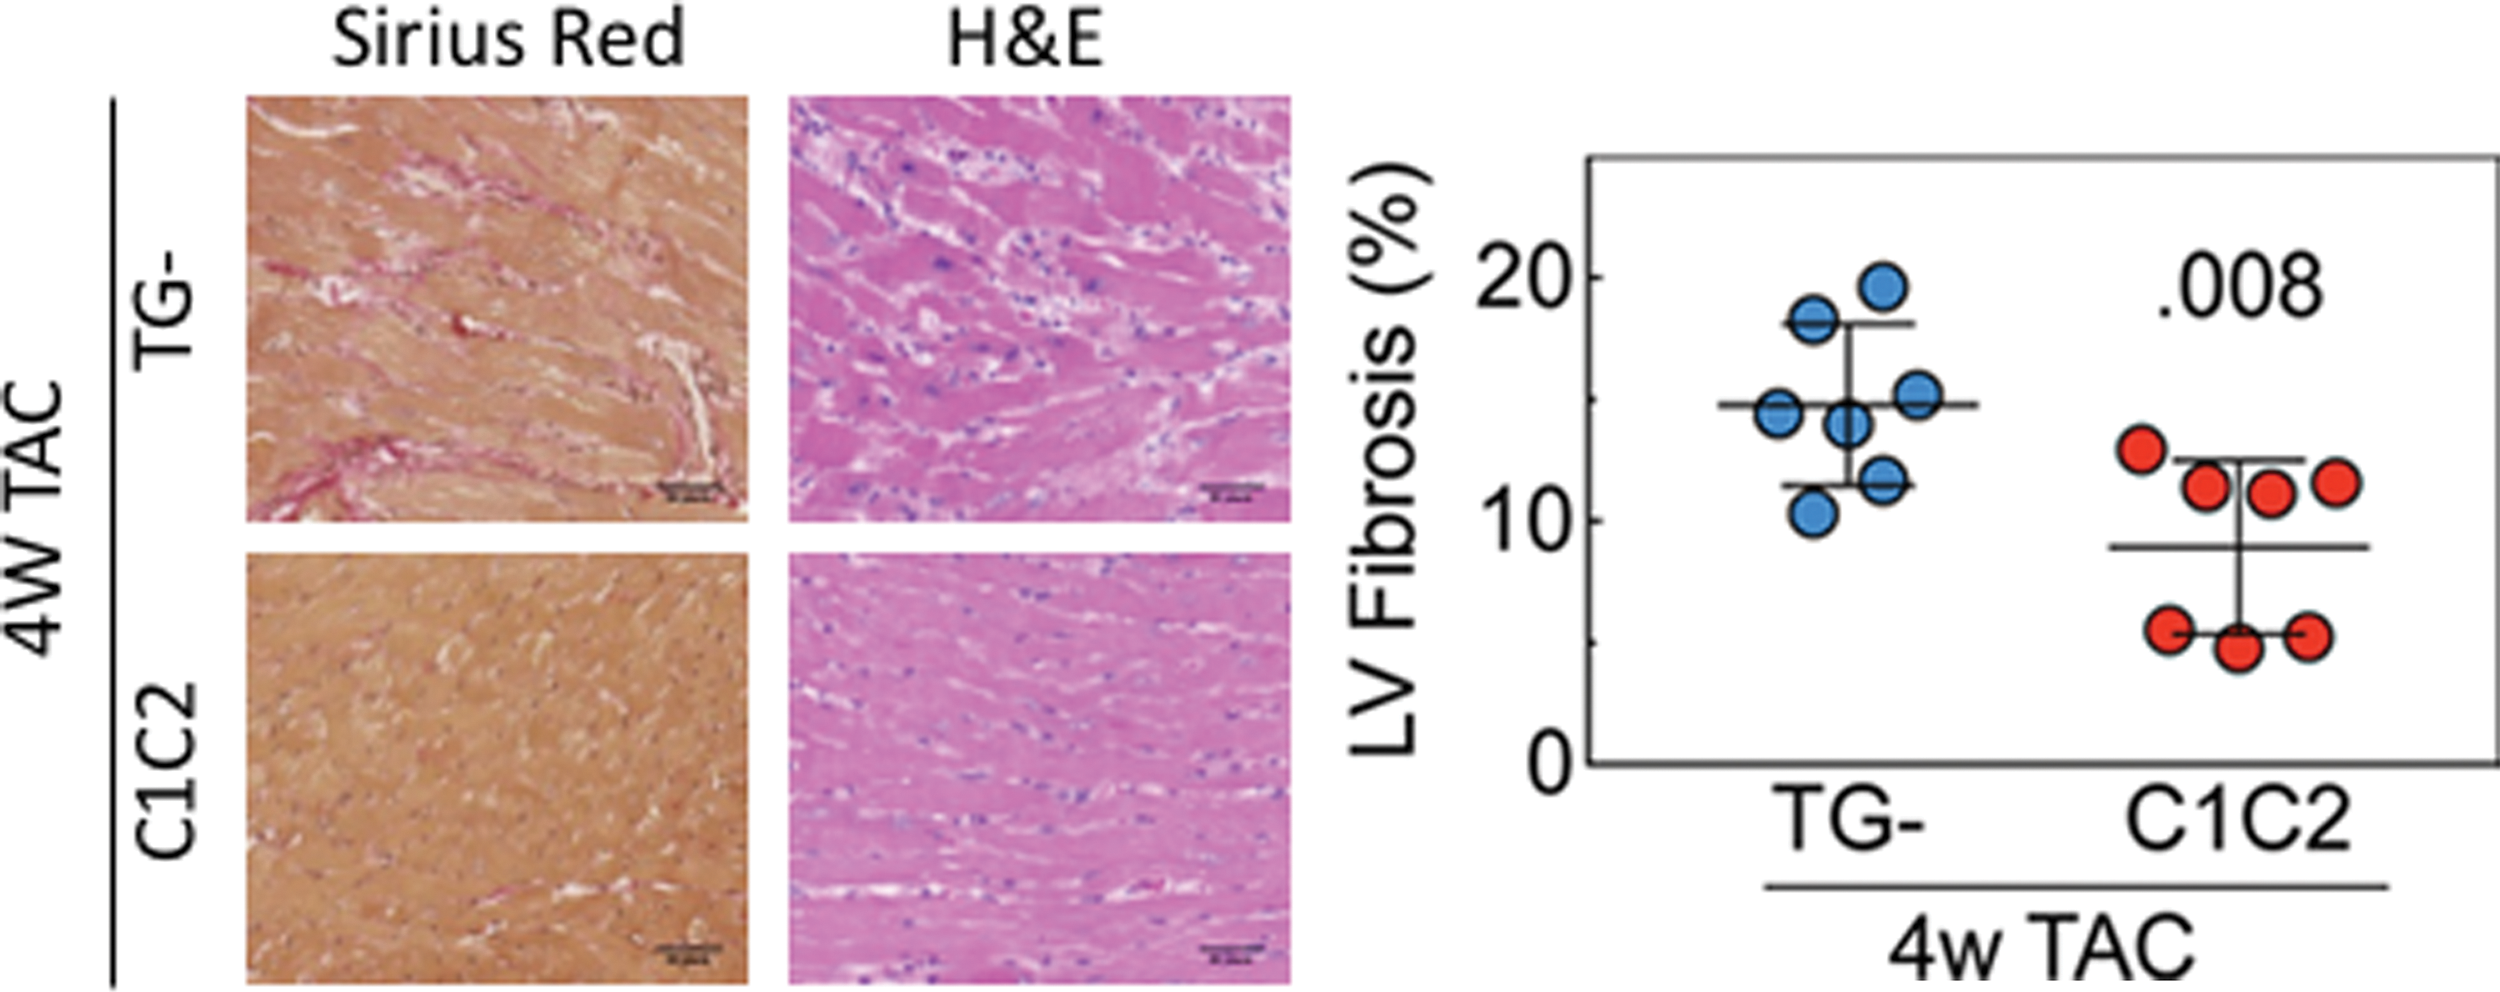
LV fibrosis. Left: Representative images of transmural LV samples stained with picrosirius red and hematoxylin and eosin 4 weeks after TAC (10 × magnification). Right: Evaluation of fibrosis using ImageJ showed less fibrosis in LV from C1C2 mice (p = 0.008). Error bars denote the mean ± SE. The p-value is from Student's t-test (unpaired and two-tailed). Color images are available online.
Necropsy
Although there was marked LV hypertrophy associated with TAC (80% increases in LV weight; p < 0.0002 vs. no TAC), no differences were observed between C1C2 and TG– mice 4 weeks after TAC. In addition, the variation in LV mass (standard error/mean) in TG– mice that received TAC was 6%, confirming that similar pressure loads were imposed by TAC. There was trend toward an increase in lung–body weight ratio of 52% (p = 0.06 vs. no TAC), but with no C1C2 compared to TG– differences (Table 5).
Necropsy
Values are the mean ± SE. p-Values are from Student's t-test (unpaired and two-tailed). Student's t-test was used to compare no TAC versus TG– TAC.
p < 0.0002; b p = 0.06 (p-values corrected for multiple comparisons with Bonferroni correction).
BW, body weight; RV, right ventricle.
Discussion
The most important finding of this study is that cardiac-directed expression of C1C2 protects the heart against the deleterious effects of pressure stress. For example, 4 weeks after TAC, cardiac expression of C1C2 preserved LV systolic function as measured by LV peak +dP/dt. Four weeks after TAC, LV peak +dP/dt was statistically indistinguishable from that of normal mice without TAC and was 19% higher than that seen in TG– mice 4 weeks after TAC (p = 0.02; Table 2). Thus, despite severe mechanical hindrance to LV ejection, contractile function in C1C2 mice was preserved.
Measurement of the peak rate of pressure development is particularly germane in the setting of aortic constriction because the peak rate occurs prior to opening of the aortic valve and provides information on intrinsic contractile function relatively isolated from the effects of the mechanical obstruction—something that EF, an ejection-phase index of LV function, does not provide. 14 These data suggest an inherent increase in LV contractile function that should be of utility in clinical settings associated with pressure overload such as systemic hypertension. A reduction in LV hypertrophy following aortic constriction was not seen, (nor was it expected) because C1C2 expression is not known to influence hypertrophic signaling pathways.
The preservation of LV function in C1C2 mice revealed by the rate of LV pressure development was also demonstrated by other measures. For example, studies of isolated cardiac myocytes showed that the time-to-peak Ca2+ transient amplitude was shorter in cardiac myocytes from C1C2 mice (p = 0.002; Fig. 2C). In the Ca2+ transient studies, preservation of the rate of cytosolic Ca2+ decline (Tau; p = 0.003; Fig. 2D) among C1C2 cardiac myocytes was also seen—a feature that would be expected to benefit LV diastolic function. It was previously reported that the time-to-peak Ca2+ transient amplitude was more rapid, but unstimulated (basal) peak Ca2+ release and Tau showed no differences in cardiac myocytes from TG– and C1C2 mice (no TAC). 8
As a further means to explore C1C2's effects, sarcomere shortening was measured in cardiac myocytes isolated 4 weeks after TAC. These data showed higher fractional shortening (p < 0.03; Fig. 3A and B) and higher rates of sarcomere shortening (+dL/dt; p < 0.02; Fig. 3C). Although C1C2 tended to increase −dL/dt after TAC (vs. TG– after TAC), it did not reach significance (p = 0.08; Fig. 3D). In general, the benefits of C1C2 in pressure overload seen in the intact heart were also seen in isolated cardiac myocytes.
Previous studies indicated that C1C2 improves Ca2+ handling. 8 However, no previous studies included measures of myofilament Ca2+ sensitivity. By examining the relationship between Ca2+ transients and sarcomere shortening at different cytoplasmic Ca2+ concentrations, the effective concentration for 50% of maximal shortening and relaxation was determined. These data show a leftward shift in C1C2 cardiac myocyte compared to cardiac myocytes from TG– mice, indicating higher myofilament sensitivity to cytosolic Ca2+ (Fig. 4A). During contraction, EC50 for cytosolic Ca2+ was lower in the C1C2 group (p = 0.02; Fig. 4B) confirming increased myofilament Ca2+ sensitivity. During relaxation, EC50 was reduced in cardiac myocytes from C1C2 mice (p = 0.04; Fig. 4C), which indicates increased myofilament Ca2+ sensitivity also occurs in diastole. These data provide a potential mechanistic underpinning for the beneficial effects of C1C2 expression: an increase in myofilament Ca2+ sensitivity. This makes sense, because the intracellular distribution of C1C2 enables protein–protein interactions, which enhance Ca2+ handling. 8
Regarding the molecular mechanism by which C1C2 affects Ca2+ handling, increased LV SERCA2a protein content was found in C1C2 compared to TG– mice (Fig. 5A and B). In diastole, a reduced time constant of Ca2+ decline (Tau) indicates improved Ca2+ uptake. The sodium-Ca2+ exchanger (NCX) and sarcoplasmic reticulum (SR) are the primary means for Ca2+ reuptake in diastole. 1 In mice, NCX accounts for only 5% of the Ca2+ uptake, and SERCA2a for 95%. 2 The finding of increased LV SERCA2a protein content in samples from C1C2 mice 4 weeks after TAC provides a plausible mechanism for improved LV Ca2+ handling.
SERCA2a activity can be regulated by PLB. However, no group differences were found in p16-PLB or p17-PLB, and no change in p-PKA. It was previously shown that cardiac-directed C1C2 increased LV SERCA2a content in the absence of increasing cAMP generation or PLB expression in the setting of sustained β-adrenergic receptor stimulation. 8
The precise molecular pathway by which C1C2 expression regulates SERCA2a expression will require additional cell-based studies.
Cardiac-directed expression of AC6 in TAC, 13 unlike C1C2, increased LV PLB phosphorylation at Ser16. This difference between C1C2 and AC6 expression in TAC may reflect the relative disengagement of C1C2 from the influence of cell-surface βAR stimulation and reduced cAMP generation—a potential advantage conferred by C1C2 expression over AC6 expression. It was previously reported that C1C2 expression reduces isoproterenol-stimulated cAMP generation in LV membranes and in cardiac myocytes. 8 C1C2 is found predominantly in the cytoplasm of cardiac myocytes and is therefore less accessible to stimulation via cell surface βARs. It is noteworthy that even though LV AC6 expression (and other AC types) are unaltered in C1C2 mice, 8 βAR-mediated cAMP production is impaired, presumably through a dominant negative effect of C1C2 interacting with Gαs to reduce endogenous AC responsiveness. An appealing profile for a HF therapeutic would include limitation of cAMP generation while promoting more efficient myofilament Ca2+ sensitivity, an effect that has been shown in the present study (Fig. 4).
It has previously been shown in cultured cardiac myocytes that C1C2 gene transfer affects intracellular signaling pathways such as CryAB, Akt, ERK1/2, and p38 MAPK. 5 C1C2 may influence intracellular signaling by interacting with G-protein coupled receptors, Gαs, Gβγ, and A-kinase anchoring proteins. Indeed, the C1C2 portion of AC6 is important in targeting AC6 to lipid rafts. 15 It was reported previously that C1C2 expression in isolated cardiac myocytes increases phosphorylation of Akt at Ser308 and Thr473 and phosphorylation of downstream Akt target proteins. 8 However, increased Akt activation was not found in LV homogenates from C1C2 mice in the present study, which may reflect the inherent limitations of defining signaling events in LV homogenates compared to cells or may represent model differences (isoproterenol infusion vs. TAC).
There were 10-fold increases compared to normal mice in molecular markers of hypertrophy 4 weeks after TAC (Table 4), but only β-MHC showed a C1C2 versus TG– difference, with C1C2 LV samples showing 50% lower values than TG– (p = 0.03). Necropsy revealed the expected severe LV hypertrophy (Table 5), similar in both experimental groups. However, LV samples from C1C2 mice 4 weeks after TAC showed less fibrosis than TG– mice (p = .008; Fig. 6). LV collagen1α1 and collagen3α1 mRNA expression were increased similarly in both groups (Table 4). A reduction in LV fibrosis in clinical settings would be anticipated to enhance diastolic function. Although the increase in contractile function conferred by C1C2 appears to be a consequence of enhanced Ca2+ handling, reduced fibrosis may reflect the disengagement of C1C2 from cell surface βAR stimulation. Thus, fibrosis induced by sustained βAR stimulation would be reduced. The mechanism by which cardiac-directed C1C2 expression reduces LV fibrosis in response to pressure overload will require additional studies. However, the improved contractile function indicates that C1C2 mice withstood the stress of increased pressure in a superior manner. Similarly, in a previous study of isoproterenol-induced cardiomyopathy, fibrosis was seen in TG– mice but not in C1C2 mice. 8 Thus, C1C2 appears to reduce fibrosis in a variety of pathophysiological settings, increasing the likelihood it could do so in clinical settings.
Although increased LV SERCA2a was found in C1C2 mice after TAC, SERCA2a may not be the sole molecular signaling event giving rise to such striking increases in Ca2+ handling. The failing heart manifests multiple signaling abnormalities, and there is always unavoidable uncertainty using animal models to test therapies that will be useful in clinical settings. Despite these inescapable limitations, it is promising that cardiac-directed expression of C1C2 has such a favorable impact on function of the intact heart in pressure overload, a pathophysiological context frequently encountered in clinical HF. The present study examined pressure overload at 4 weeks. Whether the protective effects of C1C2 will persist for longer periods and in other models of HF remains to be seen.
Limitations
Despite favorable alterations in Ca2+ handling and LV contractile function in C1C2 mice after TAC, no group difference was seen in EF. However, the model under study uses a mechanical obstruction to LV ejection (aortic constriction), so it was not expected that the degree of obstruction would be altered by the intervention. The rationale was to determine whether C1C2 expression would change Ca2+ handling and LV contractile function in the setting of pressure overload. Just as severe clinical aortic stenosis has no remedy other than replacement of the aortic valve (surgically or via transcatheter aortic valve replacement), it is not expected that other interventions would remedy a mechanical obstruction to LV outflow. Had final measurements been taken 6–8 weeks after TAC rather than at 4 weeks, it is likely that a fall in EF—and an increase in mortality—would have been seen. A decision was made to avoid these complications in the present study, examining contractile function prior to decompensated HF, just as one would prefer to do in the setting of clinical severe aortic stenosis. The functional data from isolated cardiac myocytes confirm what the LV peak +dP/dt data indicate: cardiac myocyte expression of C1C2 is associated with preserved contractile function 4 weeks after TAC.
In conclusion, cardiac-directed C1C2 expression increases LV systolic function and measures of diastolic function in pressure overload. The mechanism for these benefits resides in increases in many aspects of Ca2+ handling, which result in direct effects on sarcomere shortening and myofilament Ca2+ sensitivity, associated with increased expression of LV SERCA2a. These studies, taken together with the previous demonstration that C1C2 protects the heart from isoproterenol-induced cardiomyopathy, indicate that increasing cardiac content of C1C2 is likely to be of benefit in HF of diverse causes. The next step will be treating a model of HF via intravascular delivery of virus vectors encoding C1C2.
Footnotes
Acknowledgments
This work was supported by National Institute of Health grant (P01 HL66941) and Merit grants from the Department of Veteran's Affairs (1101 BX001515 and 1101 BX003774).
Author Disclosure
H.K.H. is a founder, board member, and unpaid consultant of Renova Therapeutics. Renova had no involvement and played no role in the studies. None of the other authors have disclosures.