
Abstract
Human Gene Therapy
officially retracts the paper entitled, “MALAT1-Driven Inhibition of Wnt Signal Impedes Proliferation and Inflammation in Fibroblast-Like Synoviocytes Through CTNNB1 Promoter Methylation in Rheumatoid Arthritis,” by Guo-Qing Li, Yu-Xuan Fang, Ying Liu, Fan-Ru Meng, Xia Wu, Chun-Wang Zhang, Yu Zhang, Dan Liu, and Bo Gao (Hum Gene Ther. 2019;30(8)1008-1022; doi: 10.1089/hum.2018.212)
A post in the For Better Science blog identified a large group of published papers across many journals as potential submissions from paper mills in Asia,1 with the article named above included in that list.
The publisher re-examined the paper using enhanced processes and technical checks that they have implemented. The result of this re-evaluation suggested that the paper was likely submitted by a third-party service consistent with a paper mill submission.
The publisher made multiple attempts to contact the corresponding author of the paper, Dr. Bo Gao, as well as the co-authors, to request the raw data files from which the paper was derived. When no response was received, the publisher determined that retraction was the necessary action.
The Editors and Publisher of Human Gene Therapy are committed to preserving the integrity of the scientific literature and the community it serves, and do not tolerate any misconduct.
Reference
1. Clyde S. The scientific sea of miR- and exosome-related knowledge. For Better Science.
Introduction
Rheumatoid arthritis (RA) is one of the most commonly occurring chronic inflammatory diseases, with a worldwide prevalence of around 1%. 1 RA is characterized by inflammation of the synovial joints in addition to the progressive degradation of adjacent cartilage and bone. 2, 3 Studies have indicated birthweight, smoking, diet, location of residence, and socioeconomic status as modifiable risk factors associated with the incidence of RA. 4 RA leads to negative impact on the ability of patients to conduct their daily activity and their quality of life, with reports highlighting a progressively increasing mortality rate associated with the disease. 5 At present, the principle for therapeutic approach of RA is largely based on pain relief and inflammation reduction, both of which are aimed at improving the overall function of RA patients. 6 Previously, researchers have reported that targeted immune treatments and aggressive therapeutic strategies may greatly contribute to positive clinical outcomes and pathogenetic understanding; however, no effective cure has been found so far. 7 Although the precise pathogenesis of RA remains unknown, accumulating researches have suggested that fibroblast-like synoviocytes (FLSs) play crucial roles in both the occurrence and the progression of RA. 8, 9 Similar to tumor cells, activated FLSs hold key functions in synovial tissue transformation and joint destruction in RA. 10
Long noncoding RNAs (lncRNAs), a group of non-protein-coding transcripts with a length of 200 nt to ∼100 kb, have been reported to play crucial roles in RA. 11, 12 A variety of vital biological functions have been reported for lncRNAs in the modulation of genes at post-transcriptional, transcriptional, and chromosomal levels, respectively. 13 Furthermore, lncRNAs have been shown to play a role in the process of cellular response by modulating gene expression via binding to chromatin regulators and interfering RNAs. 14 Several studies have discussed the function of lncRNAs in RA synovial fibroblasts and osteoarthritis cartilage destruction. 15, 16 Zhang et al. identified the differential expression of 135 lncRNAs when comparing RA and normal FLSs based on gene expression profiles. 17 Besides, upregulated lncRNA LOC100652951 and LOC100506036 has been shown to contribute to the inflammatory responses exhibited by T cells among RA patients. 18 MALAT1 (length: >8,000 nt) is located on chromosome 11q13 and widely expressed in healthy tissues. 19, 20 MALAT1 has been reported to act as a regulator of inflammatory cytokines in various disorders, such as diabetic complications, sepsis, and spinal cord injury. 21, 22 Accumulating evidence reported that the Wnt signaling pathway was associated with the progression of joint destruction and synovial inflammation in RA. 23, 24 As a mediator of the Wnt signal, β-catenin, encoded by the catenin beta 1 (CTNNB1) gene, is a key player in the pathogenesis of RA. 25, 26 In accordance with the aforementioned review of literature, we subsequently aimed to illustrate and examine the specific mechanism by which MALAT1 influences FLSs and inflammation in RA, while elucidating the roles of the MALAT1/CTNNB1/Wnt axis in the progression of RA.
Materials and Methods
Ethics statement
The experiment was performed under the approval and review of the Ethics Committee of Affiliated Changzhou Second Hospital of Nanjing Medical University and the Affiliated Hospital of Yangzhou University. Written informed consent was obtained from each patient prior to surgery.
Study subjects
Synovial tissue samples (RA group) were obtained from 34 RA patients who underwent surgical resection or joint replacement surgery at the Affiliated Changzhou Second Hospital of Nanjing Medical University and the Affiliated Hospital of Yangzhou University. Eligible patients were diagnostically confirmed in accordance with the American College of Rheumatology 1987 revised criteria for RA. 27 There were 17 males and 17 females, with a mean age of 57 ± 4.2 years. Based on the RA activity score, there were 8 mild cases, 11 moderate cases, and 15 severe cases. Synovial tissue samples obtained from 12 trauma patients (mean age 56 ± 3.6 years) were regarded as the control group.
Isolation and identification of FLSs
All synovial tissues were obtained under sterile conditions and promptly placed into a sterile test-tube containing culture medium in an ice box. Sterile phosphate-buffered saline (PBS) was used to wash the tissues 3–4 times. After blood removal, the tissue samples were finely cut into paste using eye scissors and then mixed by shaking with filter-sterile type II collagenase (0.15%). The tissue–collagenase mixture then underwent 4 h trypsinization at 37°C with 5% CO2, and shaken every 15 min for 2 min. The detached liquid samples were centrifuged in an aseptic centrifuge tube at 1,000 rpm for 5 min. The supernatant was discarded after which the tissues were rinsed twice with sterile PBS. The pellets were then resuspended in a complete Dulbecco's modified Eagle's medium (DMEM) supplemented with 10% fetal bovine serum (FBS), followed by repeated trituration using a pipette. The cell suspension was subsequently incubated with 4 mL DMEM supplemented with 15% FBS in a 10-mL flask at 37°C with 5% CO2 for 3 days. The nonadherent or dead cells were carefully removed, with the medium changed every 3 days. The FLSs were divided into subcultures at a ratio of 1:2 once cell confluence reached 85%. The FLSs at passage 3 to 6 were used for further experiments.
In order to characterize the cytological phenotypes of synovial cultures, the FLSs were collected and stained with anti-CD55 and anti-vimentin antibodies. More specifically, the FLSs were incubated in PBS with anti-CD55 antibody at room temperature for 30 min under conditions void of light prior to the detection using flow cytometry. Meanwhile, the detached FLSs in a 12-well plate were rinsed twice with PBS and treated with a fixing agent for 30 min at room temperature under conditions void of light. Next, the fixing agent was removed using a filtering solution after which the FLSs were incubated overnight with 200 μL filtering solution and 5 μL anti-vimentin antibody at 4°C overnight. On the next day, the FLSs were rinsed with transfer buffer twice and resuspended in filtering solution prior to flow cytometry examination.
Cell transfection
The FLSs were classified into eight groups that were subject to different treatments: blank group (cells without transfection); overexpressed MALAT1 (oeMALAT1) group (cells transfected with oeMALAT1 overexpression plasmid pcDNA3.1[+]-oeMALAT1; V790-20, Thermo Fisher Scientific, Carlsbad, CA); oe-negative control (NC) group (cells transfected with oe-NC); short hairpin RNA against MALAT1 (shMALAT1) group (cells transfected with shMALAT1) [RNAi vector pGPU6 (C02001, Shanghai GenePharma Co., Ltd., Shanghai, China) with human MALAT1 sequence (NR_002819.2) as the template; the target sequence (5′-GCTGTGGAGTTCTTAAATATC-3′) was selected by Shanghai GenePharma Co., Ltd. (Shanghai, China)]; shNC group (cells transfected with shNC) [NC sequence, 5′-TTCTCCGAACG TGTCACGT-3′]; shCTNNB1 group (cells transfected with shCTNNB1; sense strand, 5′- AACAGTCTTACCTGGACTCTGn-3′); shMALAT1 + shCTNNB1 group (cells co-transfected with shMALAT1 and shCTNNB1); and SB2167631 group (cells treated with 100 μM SB2167631, an activator of Wnt pathway). The FLSs transfection procedures were performed as follows: FLSs grew to reach confluence of 50–60% in a 50-mL culture flask. The Lipofectamine 2000 (Gibco, Gaitherburg, MD) and RNA or DNA were prepared in sterile Eppendorf tubes. Lipofectamine solution was prepared by adding 5 μL Lipofectamine 2000 into 100 μL serum-free medium in a sterile Eppendorf tube followed by incubation at room temperature for 5 min. In order to construct RNA/DNA-Lipofectamin complex, either RNA (50 nmoL) or DNA (2 μg) was added to 100 μL Lipofectamin containing a serum-free medium and incubated at room temperature for 20 min. Meanwhile, FLSs were transferred into a flask and rinsed with a serum-free medium prior to transfection. The RNA/DNA–Lipofectamin complex was mixed in a cautious manner with a serum-free medium without antibiotic and transferred into the flask with FLSs. The FLSs complex mixture was incubated at 37°C with 5% CO2 for 6–8 h, after which the medium was replaced with a complete medium.
Reverse transcription quantitative polymerase chain reaction
Reverse transcription quantitative PCR (RT-qPCR) was employed to determine the expression of MALAT1 as well as the mRNA expression of CTNNB1 in the synovial tissues in the control and RA groups as well as the expression of MALAT1, and mRNA expression of CTNNB1, interleukin 6 (IL-6), IL-10, tumor necrosis factor-α (TNF-α), B-cell lymphoma-2 (Bcl-2), and Bcl-2 associated X protein (Bax) in FLSs post transfection treatment. Total RNA was extracted using the Trizol reagent (Invitrogen Inc., Carlsbad, CA) from the tissues as well as the FLSs. The Nanodrop ND-2000 spectrophotometer (1011U; NanoDrop Technologies, Inc., Wilmington, DE) was employed to determine the RNA concentration and purity. Synthesized cDNA by reverse transcription was diluted into 50 ng/μL and use 2 μL per reaction in a 25 μL reaction system. The reaction conditions were as follows: reverse transcription at 37°C for 30 min, followed by inactivation at 85°C for 5 s. The PCR primers used in this experiment were synthesized by Wuhan Sangon Biological Engineering Technology & Services Co., Ltd. (Wuhan, Hubei, China). The primer sequences are displayed in Table 1. RT-qPCR was performed using the ABI PRISM® 7500 instruments (Applied Biosystems, Foster City, CA), with the reaction conditions applied as follows: pre-denaturation at 95°C for 10 min, followed by 40 cycles of denaturation at 95°C for 10 s, annealing at 60°C for 20 s, and extension at 72°C for 34 s. The reaction system (total 20 μL) was comprised of 10.0 μL SYBR Premix Ex TaqTM II, 0.8 μL forward primer (10 μM), 0.8 μL reverse primer (10 μM), 0.4 μL ROX reference dye, 2.0 μL cDNA template, and 6.0 μL ddH2O. Glyceraldehyde-3-phosphate dehydrogenase (GAPDH) was taken as the housekeeping gene for CTNNB1, IL-6, IL-1β, IL-10, TNF-α, Bcl-2, and Bax. The 2−ΔΔCt method was used to calculate the ratio of the expression of the target genes in the treatment group and the control group. The formula is: ΔΔCT = ΔCt experimental group − ΔCt control group, and ΔCt = Ct target gene − Ct internal reference. Ct was reflective of the amplification cycle when real-time fluorescence intensity was within the defined range. Each experiment was repeated three times.
Primer sequences for reverse transcription quantitative polymerase chain reaction
Bax, Bcl-2 associated X protein; Bcl-2, B-cell lymphoma-2; F, forward; IL-6, interleukin 6; IL-10, interleukin 10; GAPDH, glyceraldehyde-3-phosphate dehydrogenase; MALAT1, metastasis associated lung adenocarcinoma transcript 1; R, reverse; TNF-α, tumor necrosis factor-α; CTNNB1, catenin beta 1.
Western blot analysis
Western blot analysis was employed to determine the protein expression of β-catenin, Bcl-2, and Bax in synovial tissues in both the control and RA groups as well as in the FLSs post transfection. Total protein was extracted from FLSs by radioimmunoprecipitation assay lysate (BB-3209; BestBio Biotechnologies, Shanghai, China). The proteins were separated by sodium dodecyl sulfate-polyacrylamide gel electrophoresis (SDS-PAGE) under a controlled voltage of 80 V and transferred onto a polyvinylidene fluoride membrane. The membranes were then incubated with the primary antibody at 4°C overnight and treated with a blocking reagent for 1 h. The dilution of primary antibodies of the rabbit monoclonal antibodies used were as follows: β-catenin (ab32572, 1:5,000), Bcl-2 (ab32124, 1:1,000), Bax (ab32503, 1:1,000), and GAPDH (ab181602, 1:10,000) (all from Abcam Inc., Cambridge, MA). On the following day, the membranes were cultivated with horseradish peroxidase-conjugated secondary antibody of goat anti-rabbit immunoglobulin G (IgG) (1:1,000; Wuhan Boster Biological Technology, Ltd., Wuhan, China) at 37°C for 1 h. After incubation with the secondary antibody, the membranes were rinsed three times with PBS (5 min/rinse) at room temperature. The ratio of gray intensity of target protein to reference protein GAPDH was regarded as the relative protein expression. Experiments were repeated three times.
Fluorescence in situ hybridization
A fluorescence in situ hybridization (FISH) kit was used to identify the subcellular localization of MALAT in FLSs. According to the manual of RiboTM lncRNA FISH Probe Mix (Red; RiboBio Co. Ltd, Guangzhou, China), FLSs were cultured on a microscope slide in a 6-well plate for 1 day. When cell confluence reached 80%, the slides were immersed with PBS and fixed in 1 mL 4% paraformaldehyde at room temperature. After treating with proteinase K (2 μg/mL), glycine, and phthalide reagent, FLSs were subsequently incubated with 250 μL prehybridization solution at 42°C for 1 h. After the removal of the prehybridization solution, FLSs were incubated with 250 μL hybridization solution containing probes (300 ng/mL) at 42°C for overnight. PBS containing 0.1% Tween 20 (PBST) was used to wash the FLSs three times, after which the nuclei of the FLSs were stained with PBST-diluted 4',6-diamidino-2-phenylindole (DAPI; 1:800) for 5 min in a 24-well plate. DAPI solution was removed by rinsing the FLSs with PBST three times (3 min/rinse), with the resulting samples then sealed with antifluorescence quenching. Five fields of each sample were randomly selected and photographed using a fluorescence microscope (Olympus Optical Co., Ltd., Tokyo, Japan).
In situ hybridization
In order to ensure the successful entry of the probe into the cell nucleus for MALAT probing, a high-specificity 20-bp oligonucleotide probe was designed using PrimerPremier 5. The matching ratio/length of the probe with the target sequence was 100%, while that of the nontarget sequence was less than 70%. The paraffin-embedded synovial tissue sections were then sliced and dewaxed. Endogenous peroxidase was blocked with freshly prepared 0.5% H2O2 in methyl alcohol at room temperature for 30 min and washed with distilled water three times. The cells were then detached with fresh pepsase diluted with 3% citric acid at room temperature for 10 s. After three 0.5 M PBS rinses (5 min per rinse) as well as an additional distilled water wash, the cells were incubated with 20 μL prehybridization solution at 42°C for 4 h. After the excess liquid had been extracted, the cells were left unwashed. The cells were incubated with 20 μL hybridization solution containing digoxin-labeled oligonucleotide probe (5 μg/mL) in a 42°C incubator overnight. Finally, secondary antibody and peroxidase were added to the slides, which were then counterstained using hematoxylin. After thorough washing, the cells were dehydrated by gradient ethanol, cleared with xylene, and mounted.
Dual-luciferase reporter gene assay
A CTNNB1 luciferase reporter vector plasmid (PGLO-CTNNB1-WT) was constructed, followed by a site-specific mutagenesis at the binding sites of MALAT1 to CTNNB1 to obtain the mutated plasmid named PGLO-CTNNB1-MUT. The two reporter plasmids (PGLO-CTNNB1-WT and PGLO-CTNNB1-MUT) were co-transfected with the plasmid of NC or oeMALAT1 respectively into the FLSs. After 24 h of transfection, the FLSs were subsequently lysed, followed by collection of the supernatant after centrifugation at 12,000 rpm for 1 min. Afterwards, 100 μL firefly luciferase working fluid and then 100 μL renilla lueiferase working fluid were added to the cells. The Dual-Luciferase® Reporter Assay System (E1910, Promega Corp., Madison, Wisconsin) was applied to evaluate the relative luciferase activity (RLU). Luciferase activity = RLU firefly luciferase/RLU Renilla luciferase. The experiment was independently conducted three times.
Chromatin immunoprecipitation
The FLSs and the 293T cell lines (American Type Culture Collection, Manassas, VA), were incubated in complete DMEM (Hyclone, Logan, UT) containing 10% FBS, 100 U/mL penicillin and 100 μg/mL streptomycin at 37°C with 5% CO2, 28 after which the cells of the oeNC, shNC, oeMALAT1, and shMALAT1 groups were harvested. The EZ ChIP kit (Millipore, Billerica, MA) was recruited to detect the enrichment of DNA methyltransferase 1 (DNMT1), DNMT3a, and DNMT3b in the promoter region of CTNNB1. Briefly, the FLSs were then fixed with 1% formaldehyde at room temperature for 10 min to induce DNA–protein crosslinks after cell confluence had reached 70–80%. Ultrasonic treatment, 15 cycles of 10-second ultrasonic with an interval of 10 s, was performed to break DNA double strands, followed by centrifugation at 13,000 rpm at 4°C. The supernatant was divided into 3 tubes, which were then respectively added with positive control antibody RNA polymerase II, NC antibody IgG in normal mouse, target protein specific antibody rabbit anti-DNMT1 (ab13537, Abcam Inc.), rabbit anti-DNMT3a (ab2850, Abcam Inc.), as well as rabbit anti-DNMT3b (ab2851, Abcam Inc.). After overnight incubation at 4°C, protein agarose/sepharose was used to precipitate endogenous DNA–protein complex, followed by centrifugation and supernatant removal. The nonspecific complex was washed and dispersed at 65°C overnight. The DNA fragments were extracted through application of the phenol/chloroform extraction method. The specific primers (Table 1) from the CTNNB1 promoter region were employed to identify the binding of DNMT1, DNMT3a, and DNMT3b to the CTNNB1 promoter region.
RNA immunoprecipitation
RNA immunoprecipitation (RIP) was performed in accordance with the manufacturer's specification using Magna RIP Kit (Millipore, Billerica, MA). The collected FLSs were rinsed twice with precooled PBS, added to 100 μL lysis buffer containing protease inhibitors and RNase inhibitors, and lysed on ice for 30 min. After centrifugation at 12,000 rpm for 3 min, one portion of the supernatant was collected as the input and combined with 1 μg rabbit–anti human antibodies DNMT1 (ab13537, 1:100), DNMT3a (ab2850, 1:100), and DNMT3b (ab2851, 1:100) (Abcam Inc.). The other portion was cultured with 10–50 μL protein A/G-beads for co-precipitation. Each co-precipitation system was incubated in rotation at 4°C overnight and centrifuged at 3,000 rpm at 4°C for 5 min on the next day, followed by supernatant removal. The protein A/G-beads precipitation was rinsed 3–4 times with 1 mL lysis buffer, followed by 1-min centrifugation at 1,000 rpm at 4°C after each rinsing. The cleaned protein A/G-beads precipitation was denatured by adding 15 μL SDS loading buffer to the protein and boiling in a water bath for 10 min. RNA was extracted and purified from the precipitation by the RNA extraction method. The interaction between MALAT1 and DNMT1, DNMT3A, or DNMT3B was evaluated by RT-qPCR with MALAT1-specific primers. Rabbit anti-human IgG (1:100, ab109489) (Abcam Inc.) was used as the NC.
Methylation-specific PCR
The DNA samples from the FLSs were treated with hydrosulfite, and then purified using Wizard® Minipreps DNA Purification Resin (Promega Corp., Madison, WI), followed by NaOH treatment, ethanol precipitation, and resuspension in water. The CTNNB1 methylation specific primer (M) and CTNNB1 unmethylation specific primer (U) (Table 2) were purchased from Invitrogen Inc. (Carlsbad, CA). The methylation-specific PCR amplification procedures performed were as follows: predenaturation at 94°C for 5 min, 36 cycles of denaturation at 94°C for 15 s, annealing at 60°C for 10 s, and finally extension at 72°C for 8 s. The PCR products were subjected to electrophoresis on 1.5% agarose gel (Shanghai Sangon Biological Engineering Technology & Services Co., Ltd. (Shanghai, China) and stained with nucleic acid dye Gelred (Biotium Inc., Hayward, CA). The product band was analyzed on a gel image analyzer (Bio-Rad, Hercules, CA).
Primer sequences for methylation-specific PCR
CTNNB1, catenin beta 1.
Immunofluorescence staining
After transfection, the FLSs were isolated, counted, and spread on an immunofluorescence chamber (2 × 10⁵ cells/well). When cells confluence reached approximately 90%, the cells were washed three times with PBS on ice and fixed with 1 mL 4% paraformaldehyde for 15 min at room temperature, followed by three PBS rinses and treatment with 0.3% Triton for 10 min. The FLSs were blocked in goat serum for 30 min after PBS washing and incubated with PBS-diluted primary antibody at 4°C overnight. On the next day, each well was rinsed three times with PBS and incubated with second antibody at room temperature for 1 h under conditions void of light, followed by three PBS washes. Subsequently, under dark conditions, the FLSs were stained with DAPI for 15 min and washed again with PBS 3 times. Finally, the FLSs were sealed with anti-fluorescence quenching and imaged with a fluorescence microscope.
Enzyme-linked immunosorbent assay
The enzyme-linked immunosorbent assay (ELISA) experiment was performed in strict accordance with the instructions of the ELISA kit (eBioscience, Inc., San Diego, CA). The kit was equilibrated at room temperature for 20 min prior to use. A standard curve was generated using 100 μL well dissolved standard compounds. The samples (100 μL) were inoculated in the reaction well for 90 min at 37°C and then washed prior to incubation with 100 μL freshly prepared biotinylated antibody working solution for 60 min at 37°C. The reaction plate was washed again to remove the antibody working solution and added with 100 μL freshly prepared enzyme-binding working solution (in the dark), followed by a 30-min incubation at 37°C in the dark. The plate was again subjected to three washes and mixed with 100 μL substrate. After 15-min incubation at 37°C under dark conditions, the reaction was promptly quickly through the addition of an elimination agent. Within 3 min of reaction termination, the optical density of each sample was measured at a wavelength of 450 nm using a microplate reader (Biotek Synergy 2, Vermont). A standard curve was plotted based on the obtained optical density values. The levels of IL-6, IL-1β, TNF-α, and IL-10 in the supernatant among groups were detected using the corresponding kits (ab46027; ab46052; hj-C14134; ab100549). Kits for IL-6, IL-1β, and IL-10 were purchased from Abcam Inc., while the kit for TNF-α was obtained from Shanghai Hong Ju Industrial Co., Ltd. (Shanghai, China).
5-ethynyl-2′-deoxyuridine staining
The FLSs at exponential-phase were seeded into a 96-well plate (4 × 10³ cells/well) and grown to normal growth stage. The cell culture medium was used to dilute the 5-ethynyl-2′-deoxyuridine (EdU) solution at a ratio of 1,000:1 into a final concentration of 50 μM. The FLSs were incubated with 100 μL of 50 μM EdU medium for 2 h, after which the medium was discarded. The FLSs were then rinsed with PBS 1–2 times (5 min/time) and incubated with 50 μL fixative solution (PBS containing 4% paraformaldehyde) for 30 min at room temperature. After removal of the fixative solution, each well was cultivated with 100 μL penetrating reagent (PBS containing 0.5% TritonX-100) on a shaking device for 10 min. Next, the FLSs were washed with PBS for 5 min and then exposed to a 100 μL 1 × Apollo reaction cocktail for 30 min while shaking in the dark at room temperature. After discarding the reaction cocktail, each well was rinsed two to three times with 100 μL penetrating reagent (10 min/rinse). The FLSs were then immersed in 100 μL methanol for 5 min 1–2 times and then washed with PBS for 5 min. Each well was then stained with 100 μL 1 × Hoechst 33342 for 30 min under conditions void of light at room temperature. After 30 min of incubation, the staining solution was discarded and each well was rinsed 1–3 times with PBS.
Terminal deoxyribonucleotidyl transferase-mediated dUTP-biotin nick end-labeling assay
A terminal deoxyribonucleotidyl transferase-mediated dUTP-biotin nick end-labeling (TUNEL) assay was performed using a TUNEL detection kit purchased from Roche (Indianapolis, IN). The synovial tissue samples were fixed at room temperature for 30 min, rinsed with PBS, and then permeated with 0.2% Triton X-100 for 5 min. To increase permeability, the PBS-free samples were incubated with 50 μL reaction mixture (consisting of concentrated enzyme solution and labeled solution at the ratio of 1:9) in a wet box for 60 min at 37°C, followed by rinsing with PBS and observation under a fluorescence microscope. Five fields were randomly selected from each section to determine the rate of apoptosis with the following formula applied: apoptosis rate = (number of apoptotic cells/number of total cells) × 100%. After transfection of 24 h, FLSs were fixed with 2% formalin at room temperature for 1 h, permeated with 0.1% Triton X-100 (Solarbio Science and Technology Corporation, Beijing, China) on ice for 2 min, and then rinsed three times with PBS. In accordance with the provided instructions, the cell cultures were subjected to 1 h incubation with 50 μL TUNEL reaction mixture at room temperature under dark conditions prior to observation under an inverted fluorescence microscope (Leica Microsystems, Wetzlar, Germany).
Flow cytometry
After 48-h transfection, the culture medium was discarded and the FLSs were washed with a PBS balanced salt solution and treated with 0.25% trypsin solution. Once the FLSs were confirmed to have shrunk and assumed a round shape under microscope observation, detachment was terminated following the addition of serum-containing medium. The FLSs were resuspended by trituration to detach the cells from the wall, with the resulting suspension centrifuged at 1,000 rpm for 5 min, followed by supernatant removal. The collected FLSs were washed twice with PBS, fixed with precooled 70% ethanol for 30 min. After a centrifugation, FLSs were rinsed with PBS, stained with 1% propidium iodide (PI) containing RNase for 30 min, and washed twice with PBS to discard PI. The sample was then adjusted to 1 mL using PBS prior to detection with a BD-Aria FACS Calibur (Beckman Coulter Inc., Fullerton, CA). The experiment was conducted three times independently, and three samples were used per group.
After 48-h transfection, the FLSs were detached by 0.25% trypsin without ethylene diamine tetraacetic acid before centrifugation. After the supernatant had been removed, the cells were washed three times with cold PBS. According to the instructions of the annexin-V-fluorescein isothiocyanate (Annexin-V-FITC) kit (C1065, Beyotime Biotechnology, Shanghai, China), the Annexin-V-FITC, PI, and 4-(2-hydroxyethyl)-1-piperazineëthanesulfonic acid (HEPES) buffer (1:2:50) were mixed to obtain the Annexin-V-FITC/PI staining solution, 100 μL of which was added to 1 × 10⁶ FLSs followed by incubation at room temperature for 15 min with gentle shaking. The FLSs were then treated with 1 mL HEPES buffer (PB180325, Procell, Hubei, China) prior to measurement. The fluorescence of the cell samples was detected using a 525-nm bandpass filter for PI and a 620-nm bandpass filter for FITC after 488-nm excitation, respectively. Cell apoptosis was subsequently assessed according to the fluorescence with the following formula: apoptotic index (AI) = number of apoptotic cells/(number of apoptotic cells + number of normal cells). This experiment, with 10 parallel controls, was independently conducted three times.
Statistical analysis
All data were analyzed using a Statistic Package for the Social Science (SPSS) 19.0 statistical software (IBM Corp. Armonk, NY). Collected data that followed normal distribution were expressed as mean ± standard deviation. Comparison between groups was analyzed using an independent sample t-test. Comparison among multiple groups was analyzed by one-way analysis of variance. Least significant difference t-test was employed for pairwise comparison between two groups. A p value <0.05 was considered to reflect statistical significance.
Results
MALAT1 is lowly expressed in RA synovial tissue
Comparison of the expression of MALAT1 between the RA and normal synovial tissues was examined via RT-qPCR. The results (Fig. 1) demonstrated that the expression of MALAT1 was significantly lower in the synovial tissues isolated from RA patients than in the normal synovial tissues.
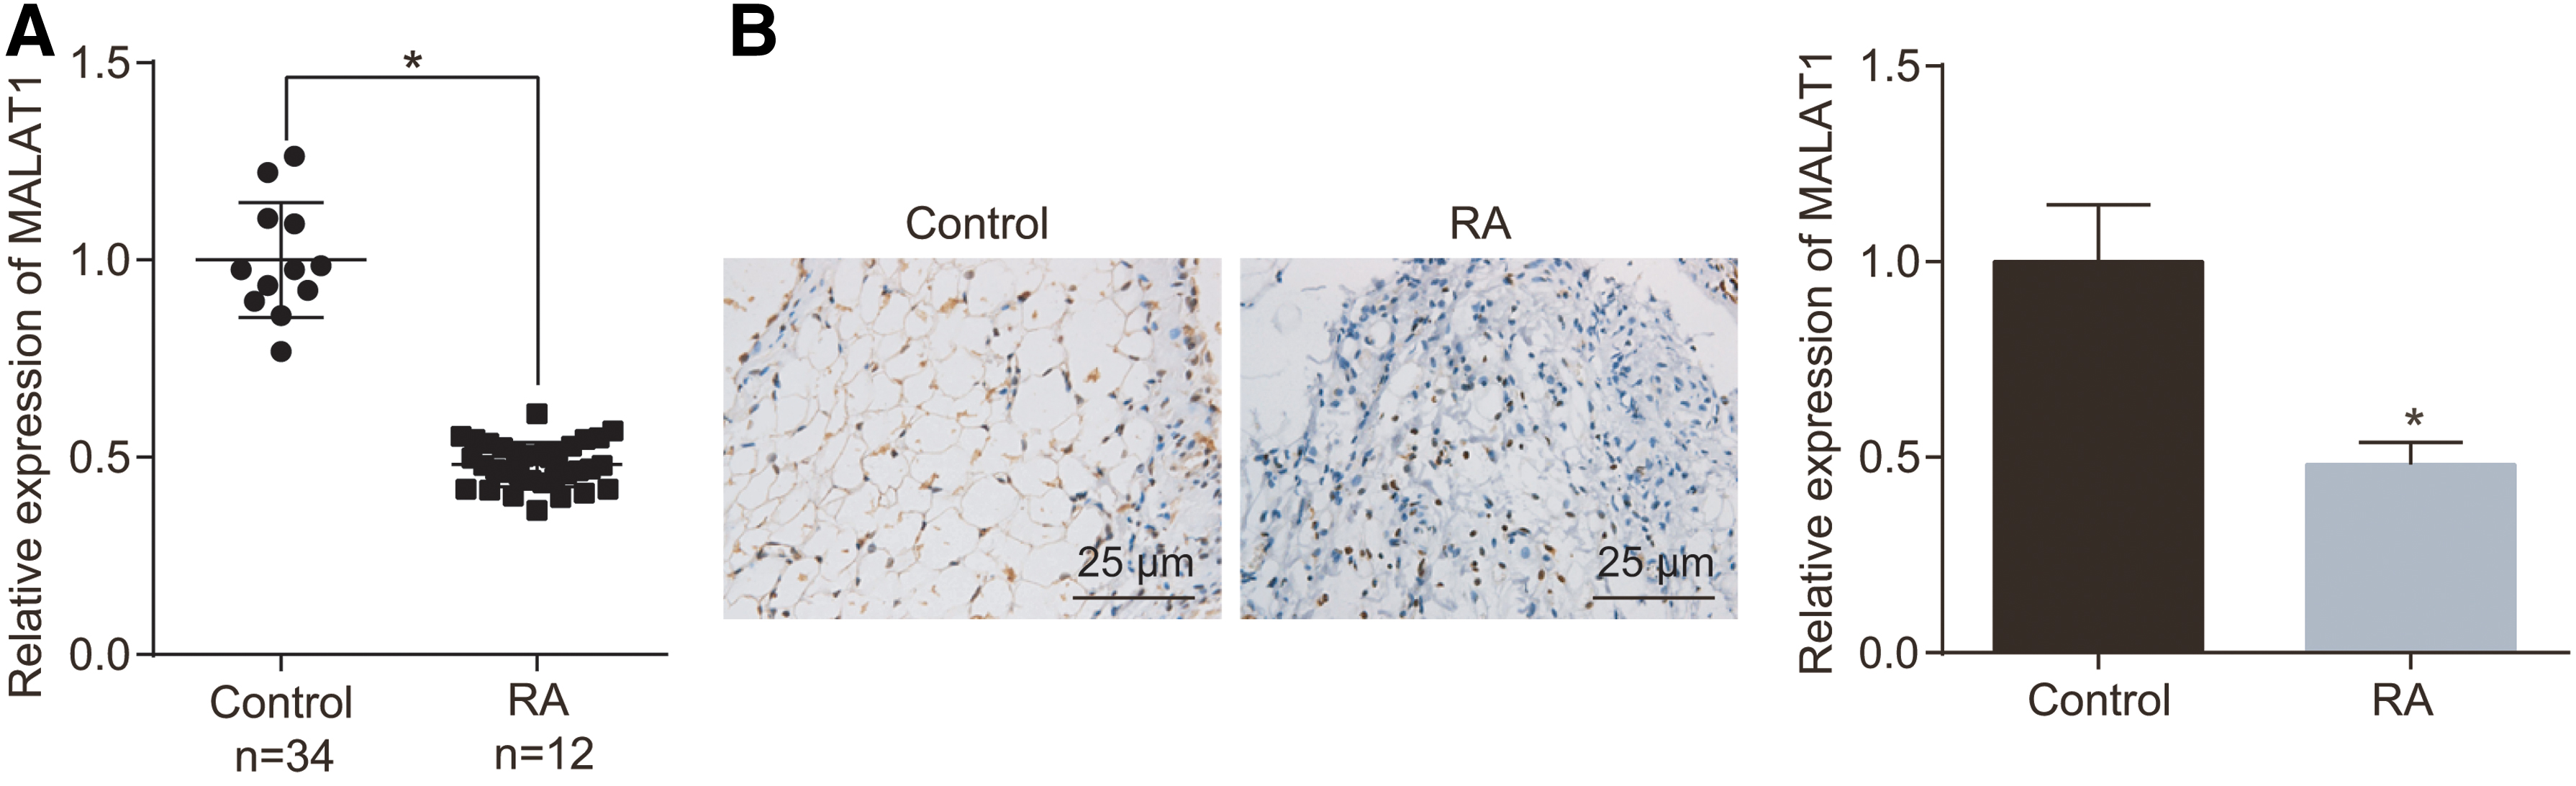
MALAT1 expression is reduced in RA synovial tissue.
FLSs are successfully isolated from RA
In order to isolate the FLSs from RA patients, the explant culture technique was employed which could facilitate the spreading of the FLSs all over the tissue block in 7–10 days. The cells were noted to be spindle-shaped or in columnar shape and orbicular-ovate nucleus located in the center with obvious nucleoli (Fig. 2A). Since orbicular-ovate macrophage-like cells at the third passage had basically lost the ability to divide and proliferate, and the remaining cells were FLSs in the subsequent passage. To characterize the cytological phenotype of synovial cultures, flow cytometry was utilized to determine the expression of CD55 and Vimentin in treated cells (Fig. 2B and C). The results obtained revealed that 99% of the cells exhibited a positive result in the expression of CD55 and vimentin, highlighting the success of FLSs isolation.
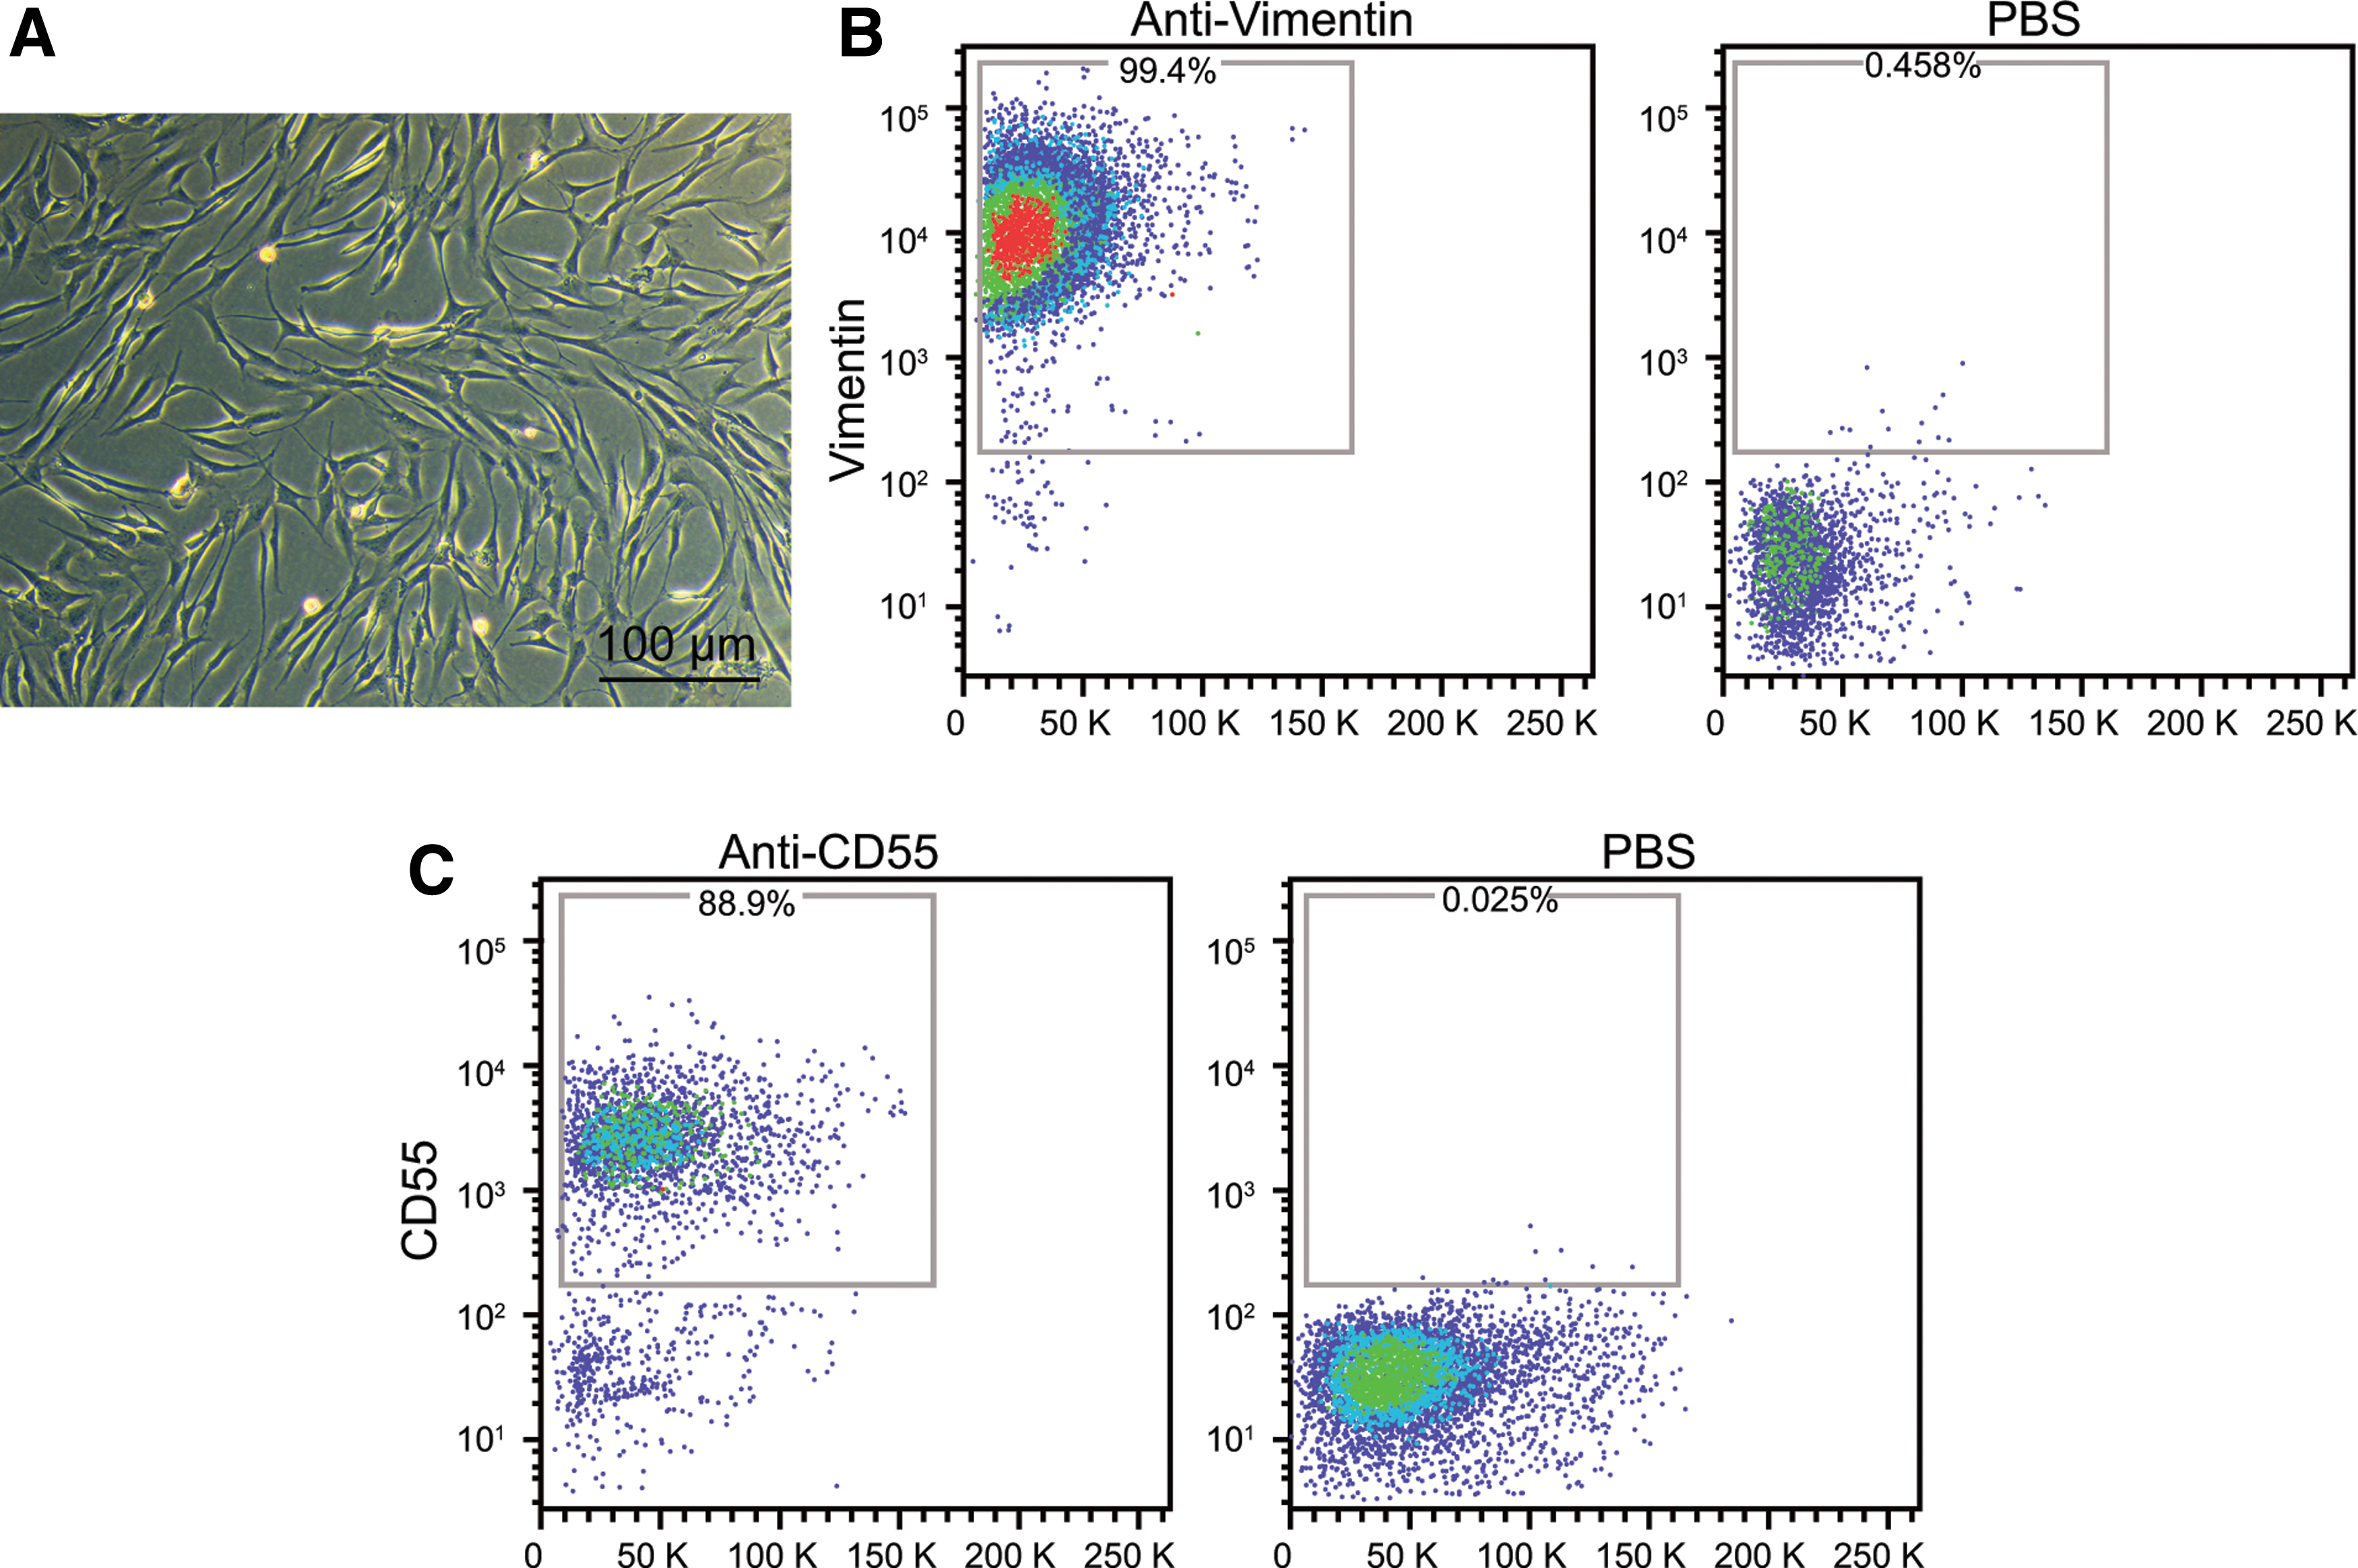
Identification of FLSs by morphological observation and determining expression of CD55 and Vimentin.
MALAT1 inhibits the secretion of cytokines, reduces proliferation, and promotes apoptosis in FLSs of RA
We used RT-qPCR, Western blot analysis, EdU staining, ELISA, TUNEL, and flow cytometry to investigate whether MALAT1 exerted effects on the secretion of cytokines as well as proliferation and apoptosis in FLSs isolated from RA patients (Fig. 3A–L). Compared with the blank group, there was no significant difference observed between oeNC and shNC groups (p > 0.05). When compared with the oeNC group, the oeMALAT1 group showed obvious reductions in the expression of IL-6, IL-1β, TNF-α, and Bcl-2, the cell viability, and the proportion of cells at S phase, but elevations in the expression of MALAT1, IL-10, and Bax, the proportion of cells at G0/G1 phase, and apoptosis rate (all p < 0.05). However, in contrast with the shNC group, the shMALAT1 group revealed opposite trends in the aforementioned indicators (all p < 0.05). These results demonstrated that MALAT1 could inhibit the secretion of inflammatory cytokines and proliferation of FSLs but promote apoptosis in FLSs of RA.
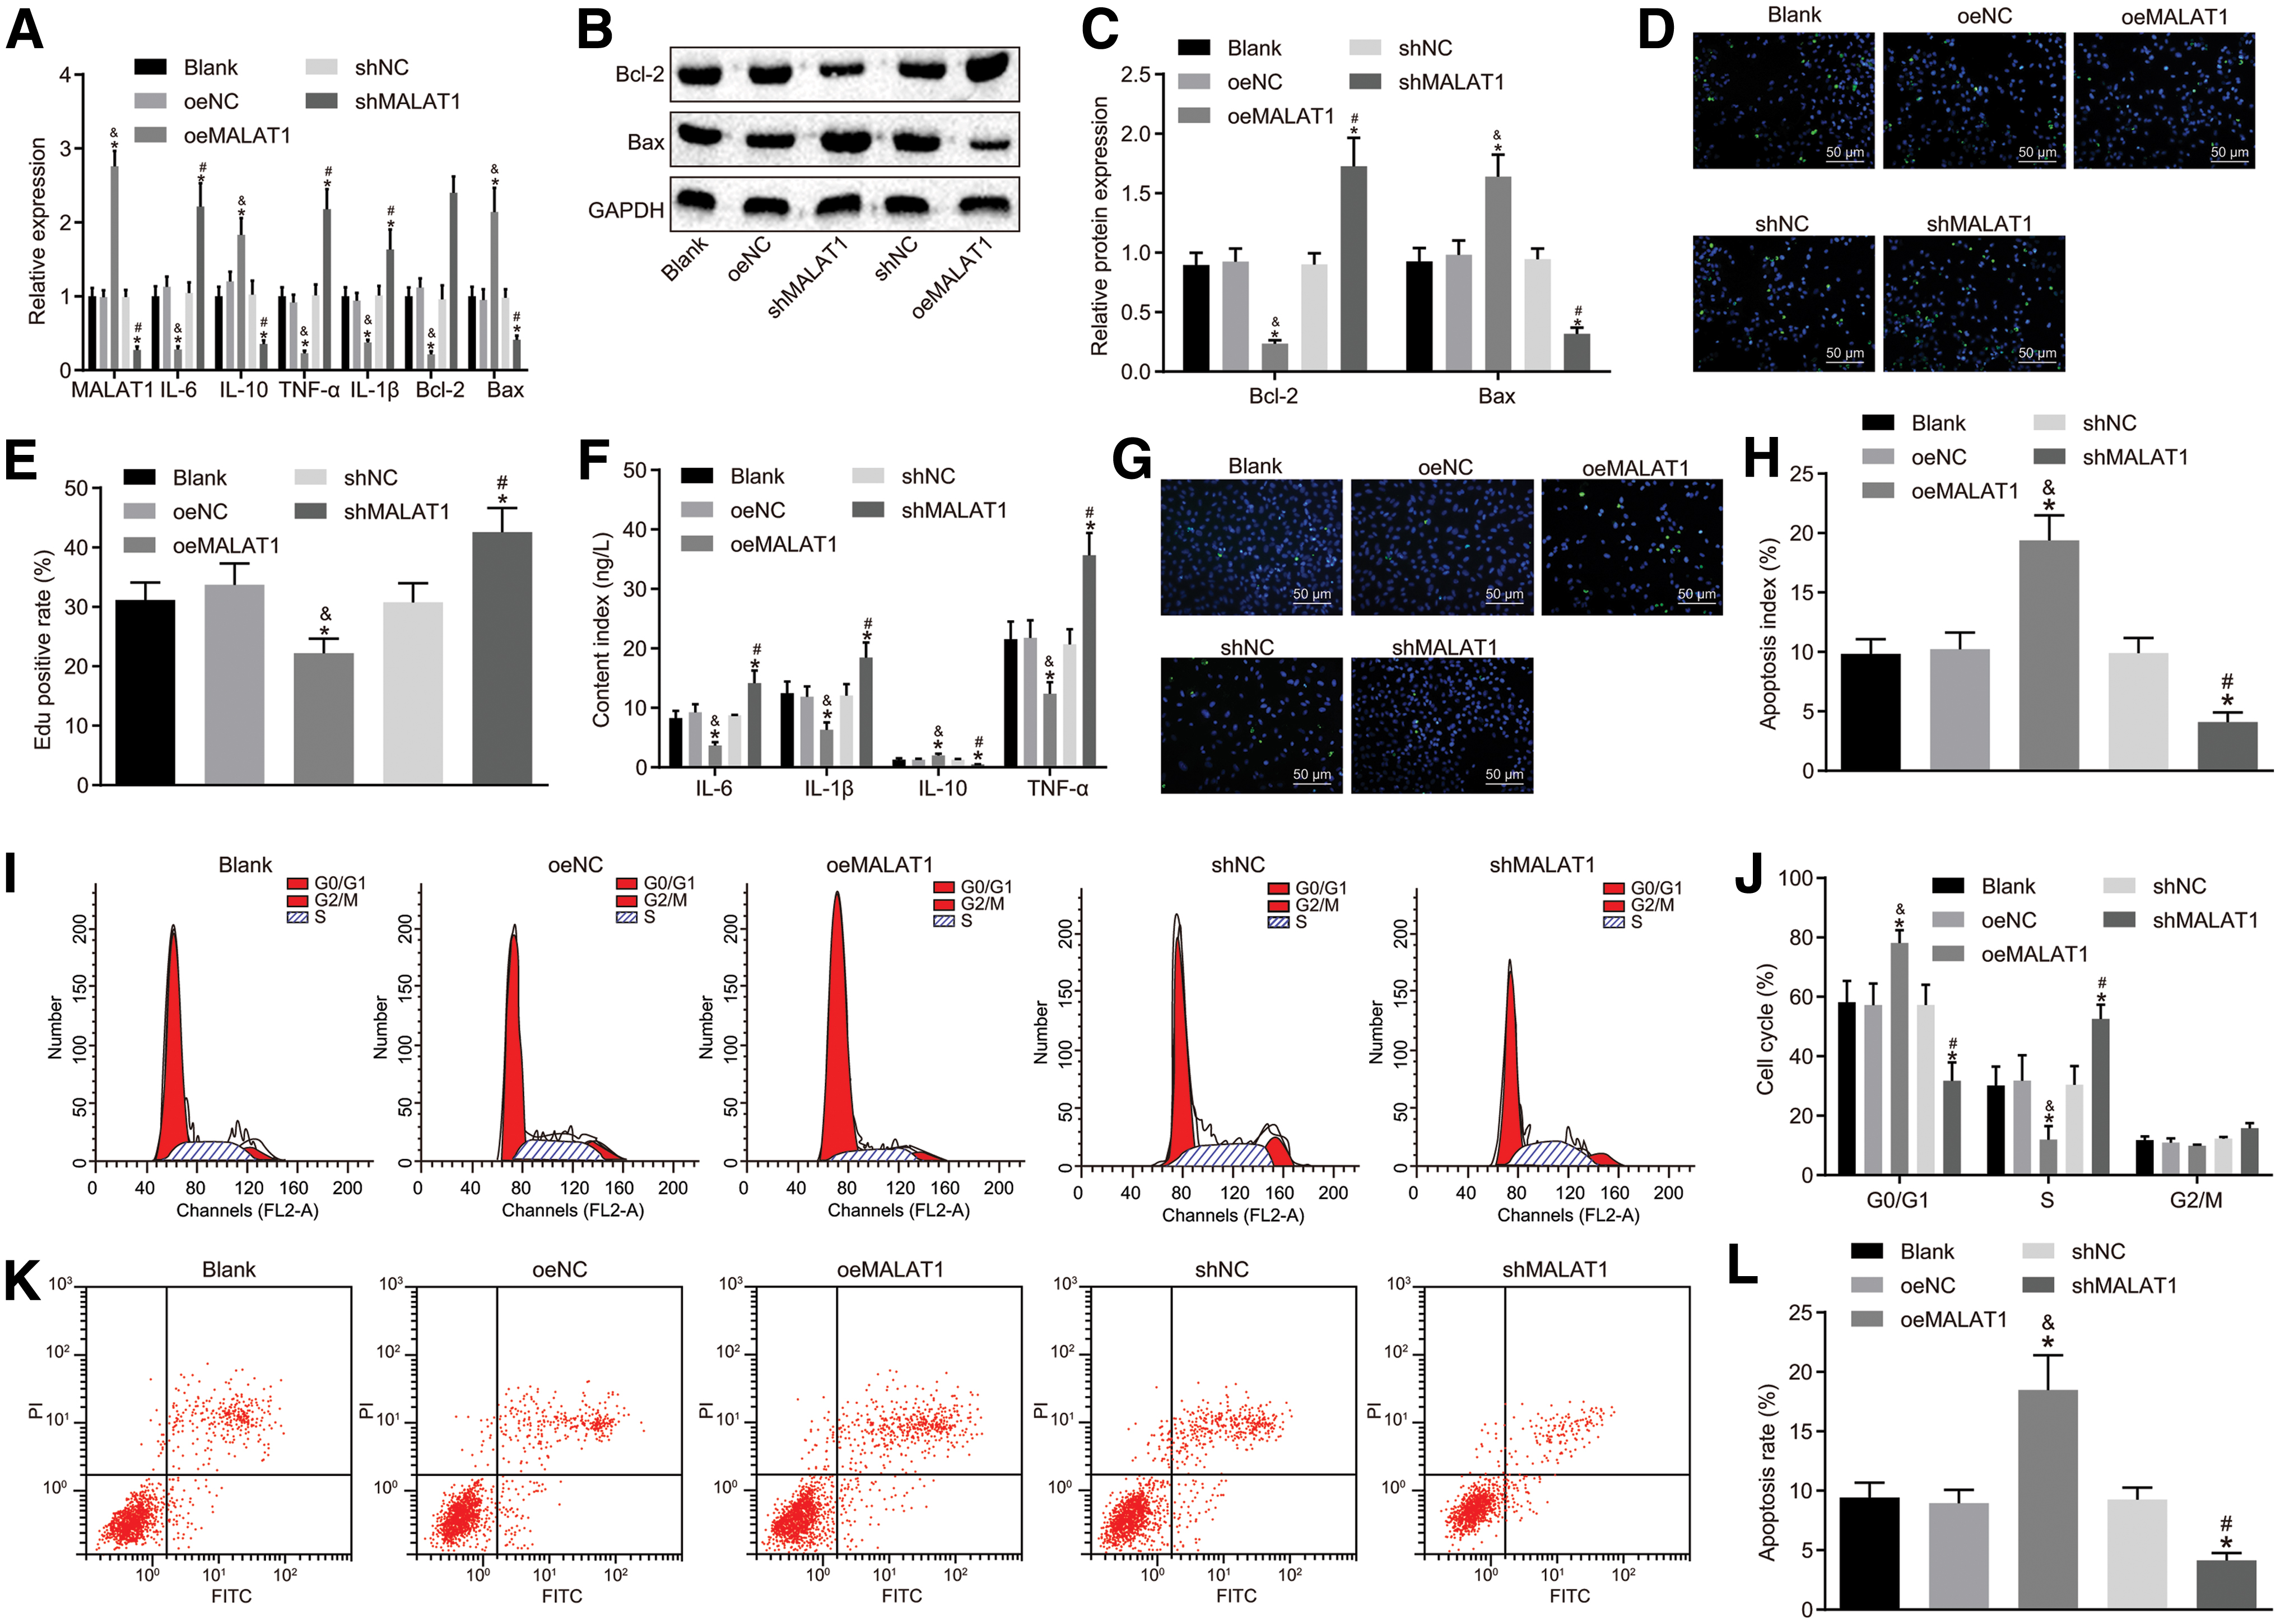
MALAT1 modulates the secretion of cytokines and proliferation and apoptosis in FLSs of RA.
MALAT1 triggers CTNNB1 promoter methylation to inhibit CTNNB1 expression
Subcellular localization of MALAT1 in FLSs was determined through the lncAtlas bioinformatics website. We found that MALAT1 was mainly located in the nucleus (Fig. 4A), which was further verified via FISH (Fig. 4B). The dual-luciferase reporter gene assay showed that compared with the oeNC group, the luciferase activity of PGLO-CTNNB1-WT was inhibited by overexpressed MALAT1 (p < 0.05), while that of PGLO-CTNNB1-MUT did not show the same effect (p > 0.05) (Fig. 4C). Chromatin immunoprecipitation in the CTNNB1 promoter region was conducted to verify that the methyltransferases recruited by MALAT1 promoted the methylation of CTNNB1 promoter through transfecting oeNC, oeMALAT1, shNC and shMALAT1 in the 293T and RA-FLS cells. The enrichment of CTNNB1 was significantly increased in the methyltransferases of DNMT1, DNMT3a, and DNMT3b in the oeMALAT1 group (all p < 0.05), while no statistical difference was observed in the oeNC group (all p > 0.05) (Fig. 4D). RIP experiment was performed to analyze the binding of MALAT1 and methyltransferases. The results indicated that MALAT1 could bind to DNMT1, DNMT3a, and DNMT3b (p < 0.05) (Fig. 4E). As shown in Fig. 4F, a large number of CpG islands, an easier methylated region, were found in the CTNNB1 promoter region. Meanwhile, a large amount of CTNNB1 methylation was found in FLSs according to the results from methylation-specific PCR experiment (Fig. 4G). All these results indicated that MALAT1 could regulate β-catenin protein expression and inhibit CTNNB1 through facilitating CTNNB1 promoter methylation. Besides, the expression of MALAT1 and CTNNB1 in transfected FLSs was determined via RT-qPCR and Western blot analysis (Fig. 4H–J). No differences were found regarding the expression of MALAT1 and mRNA expression of CTNNB1 and the protein expression of β-catenin among the blank, oeNC, and shNC groups (all p > 0.05). Compared with the oeNC group, the oeMALAT1 group indicated increased MALAT1 expression and reduced β-catenin protein expression and CTNNB1 mRNA expression (all p < 0.05). However, the shMALAT1 group showed opposite observations (all p < 0.05). Therefore, MALAT1 stimulated CTNNB1 promoter methylation to induce silencing of CTNNB1.
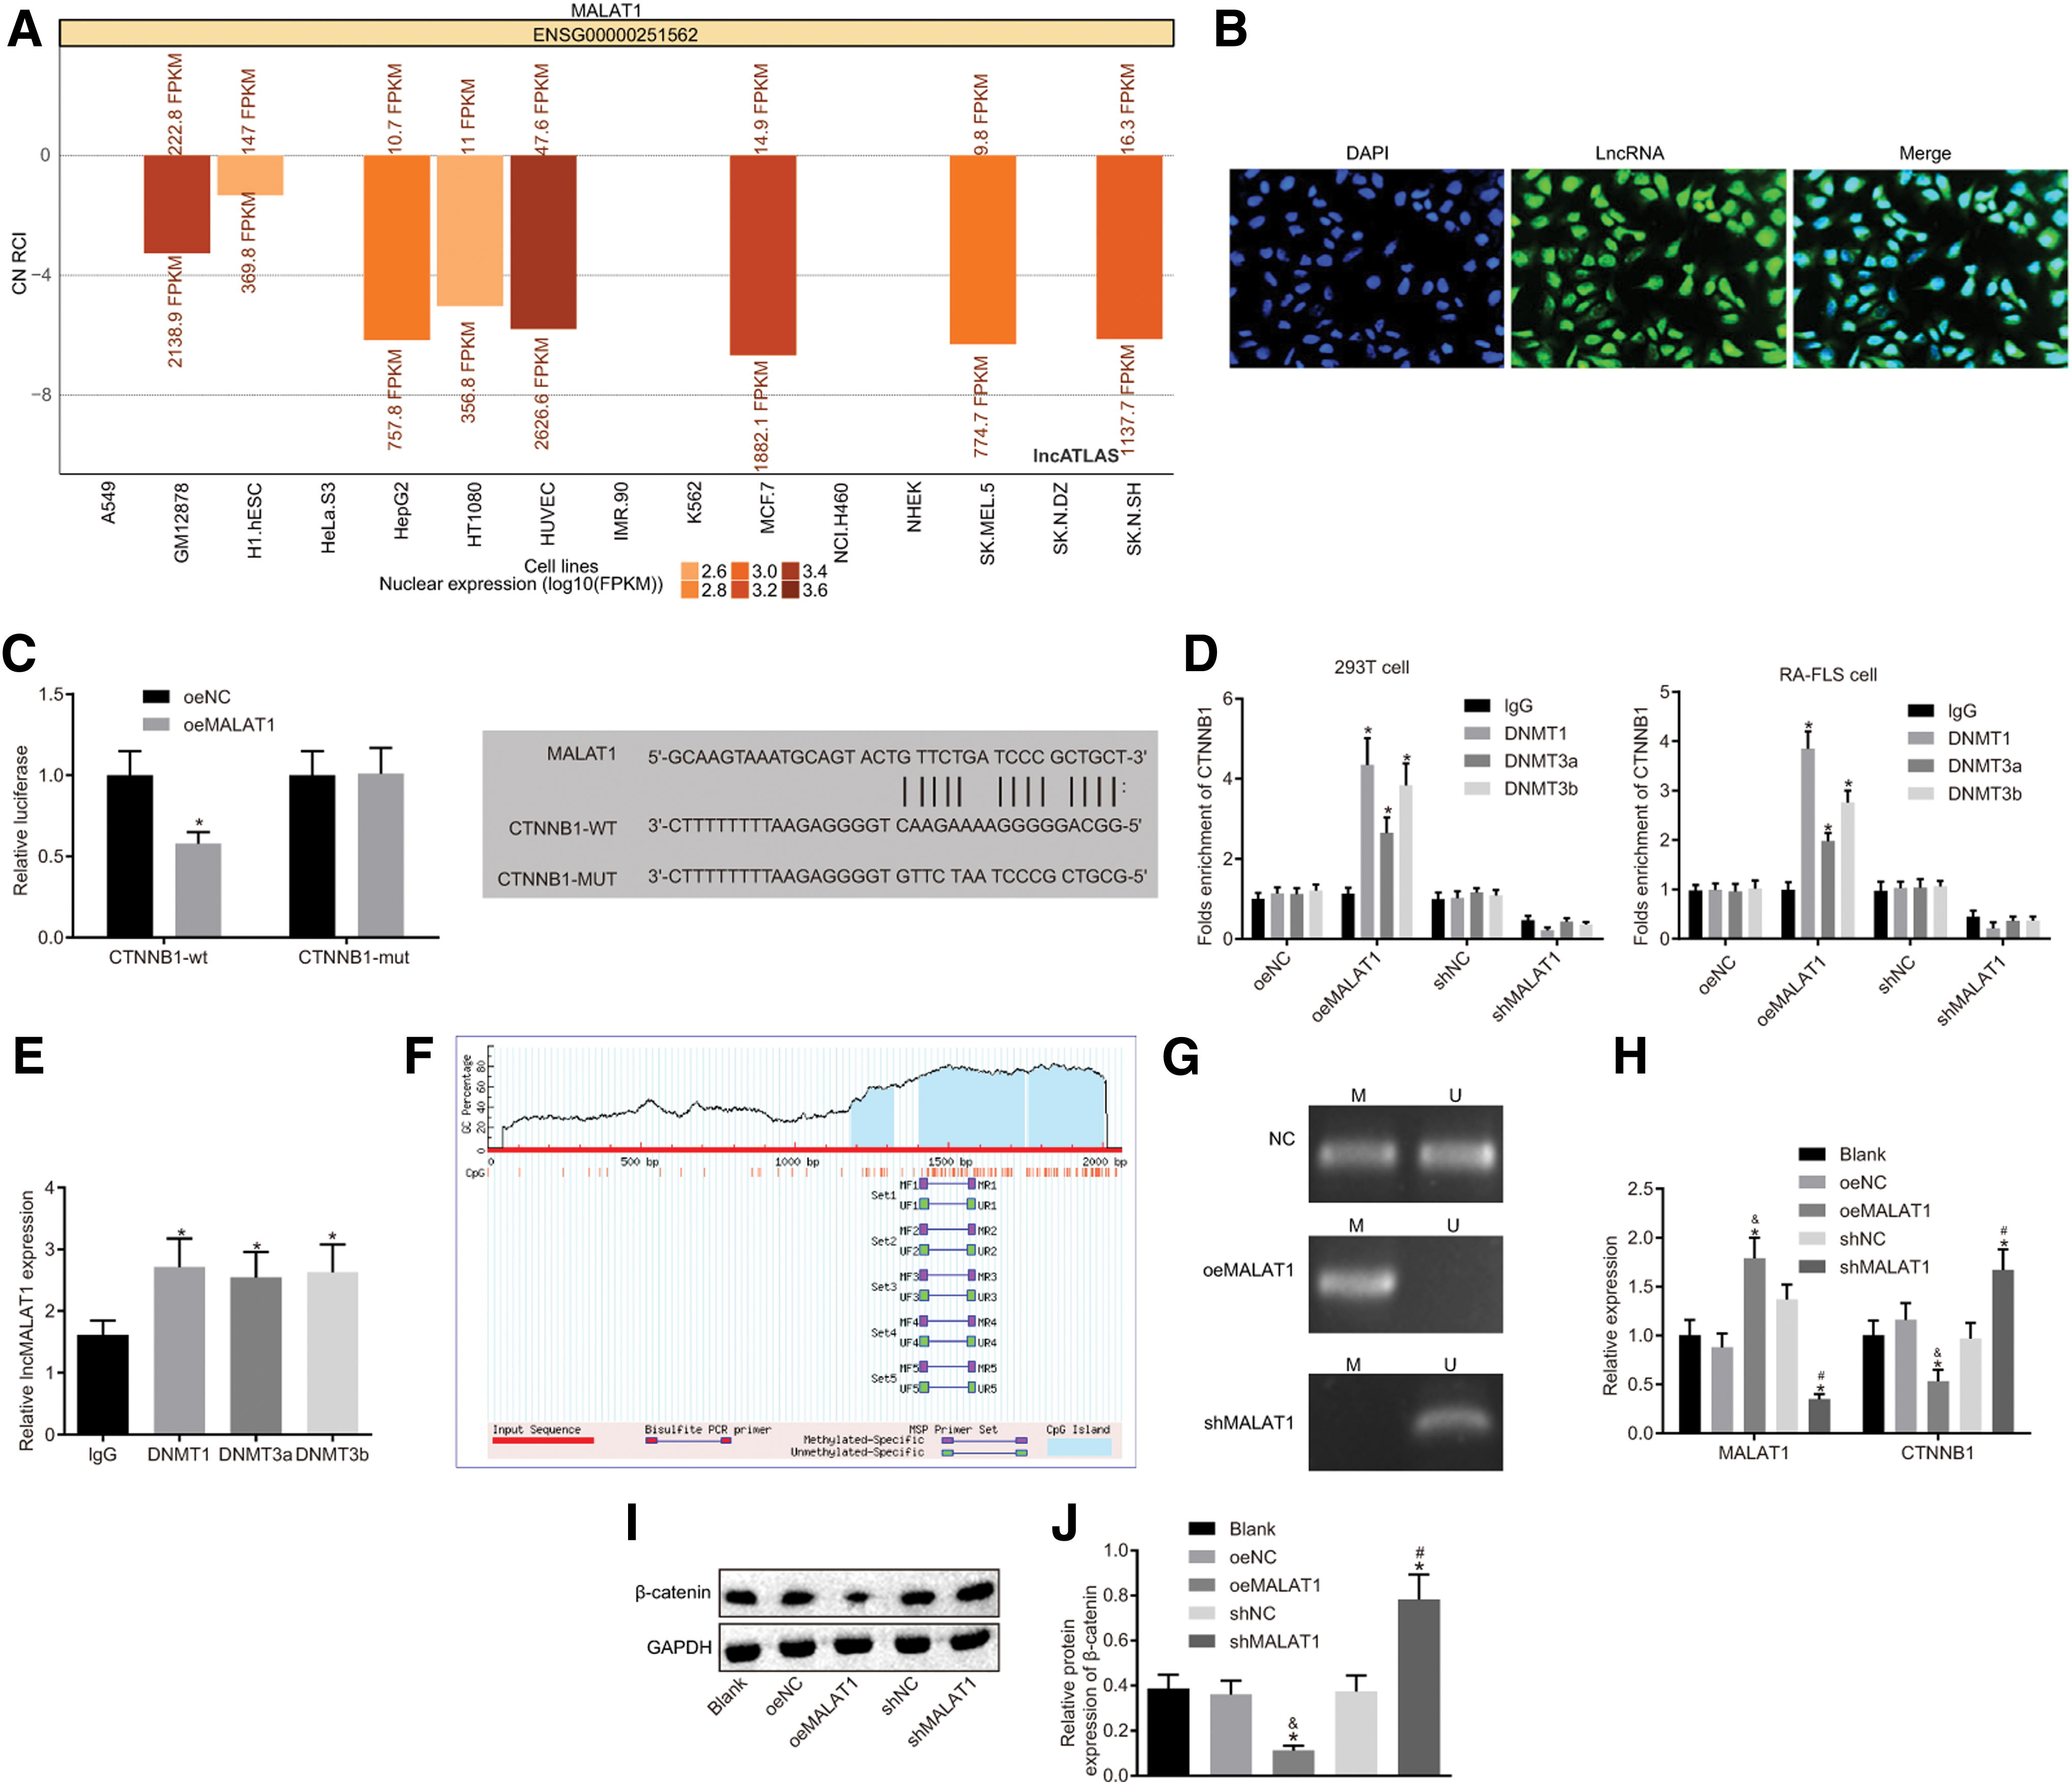
MALAT1 promotes CTNNB1 promoter methylation, thereby inhibiting CTNNB1.
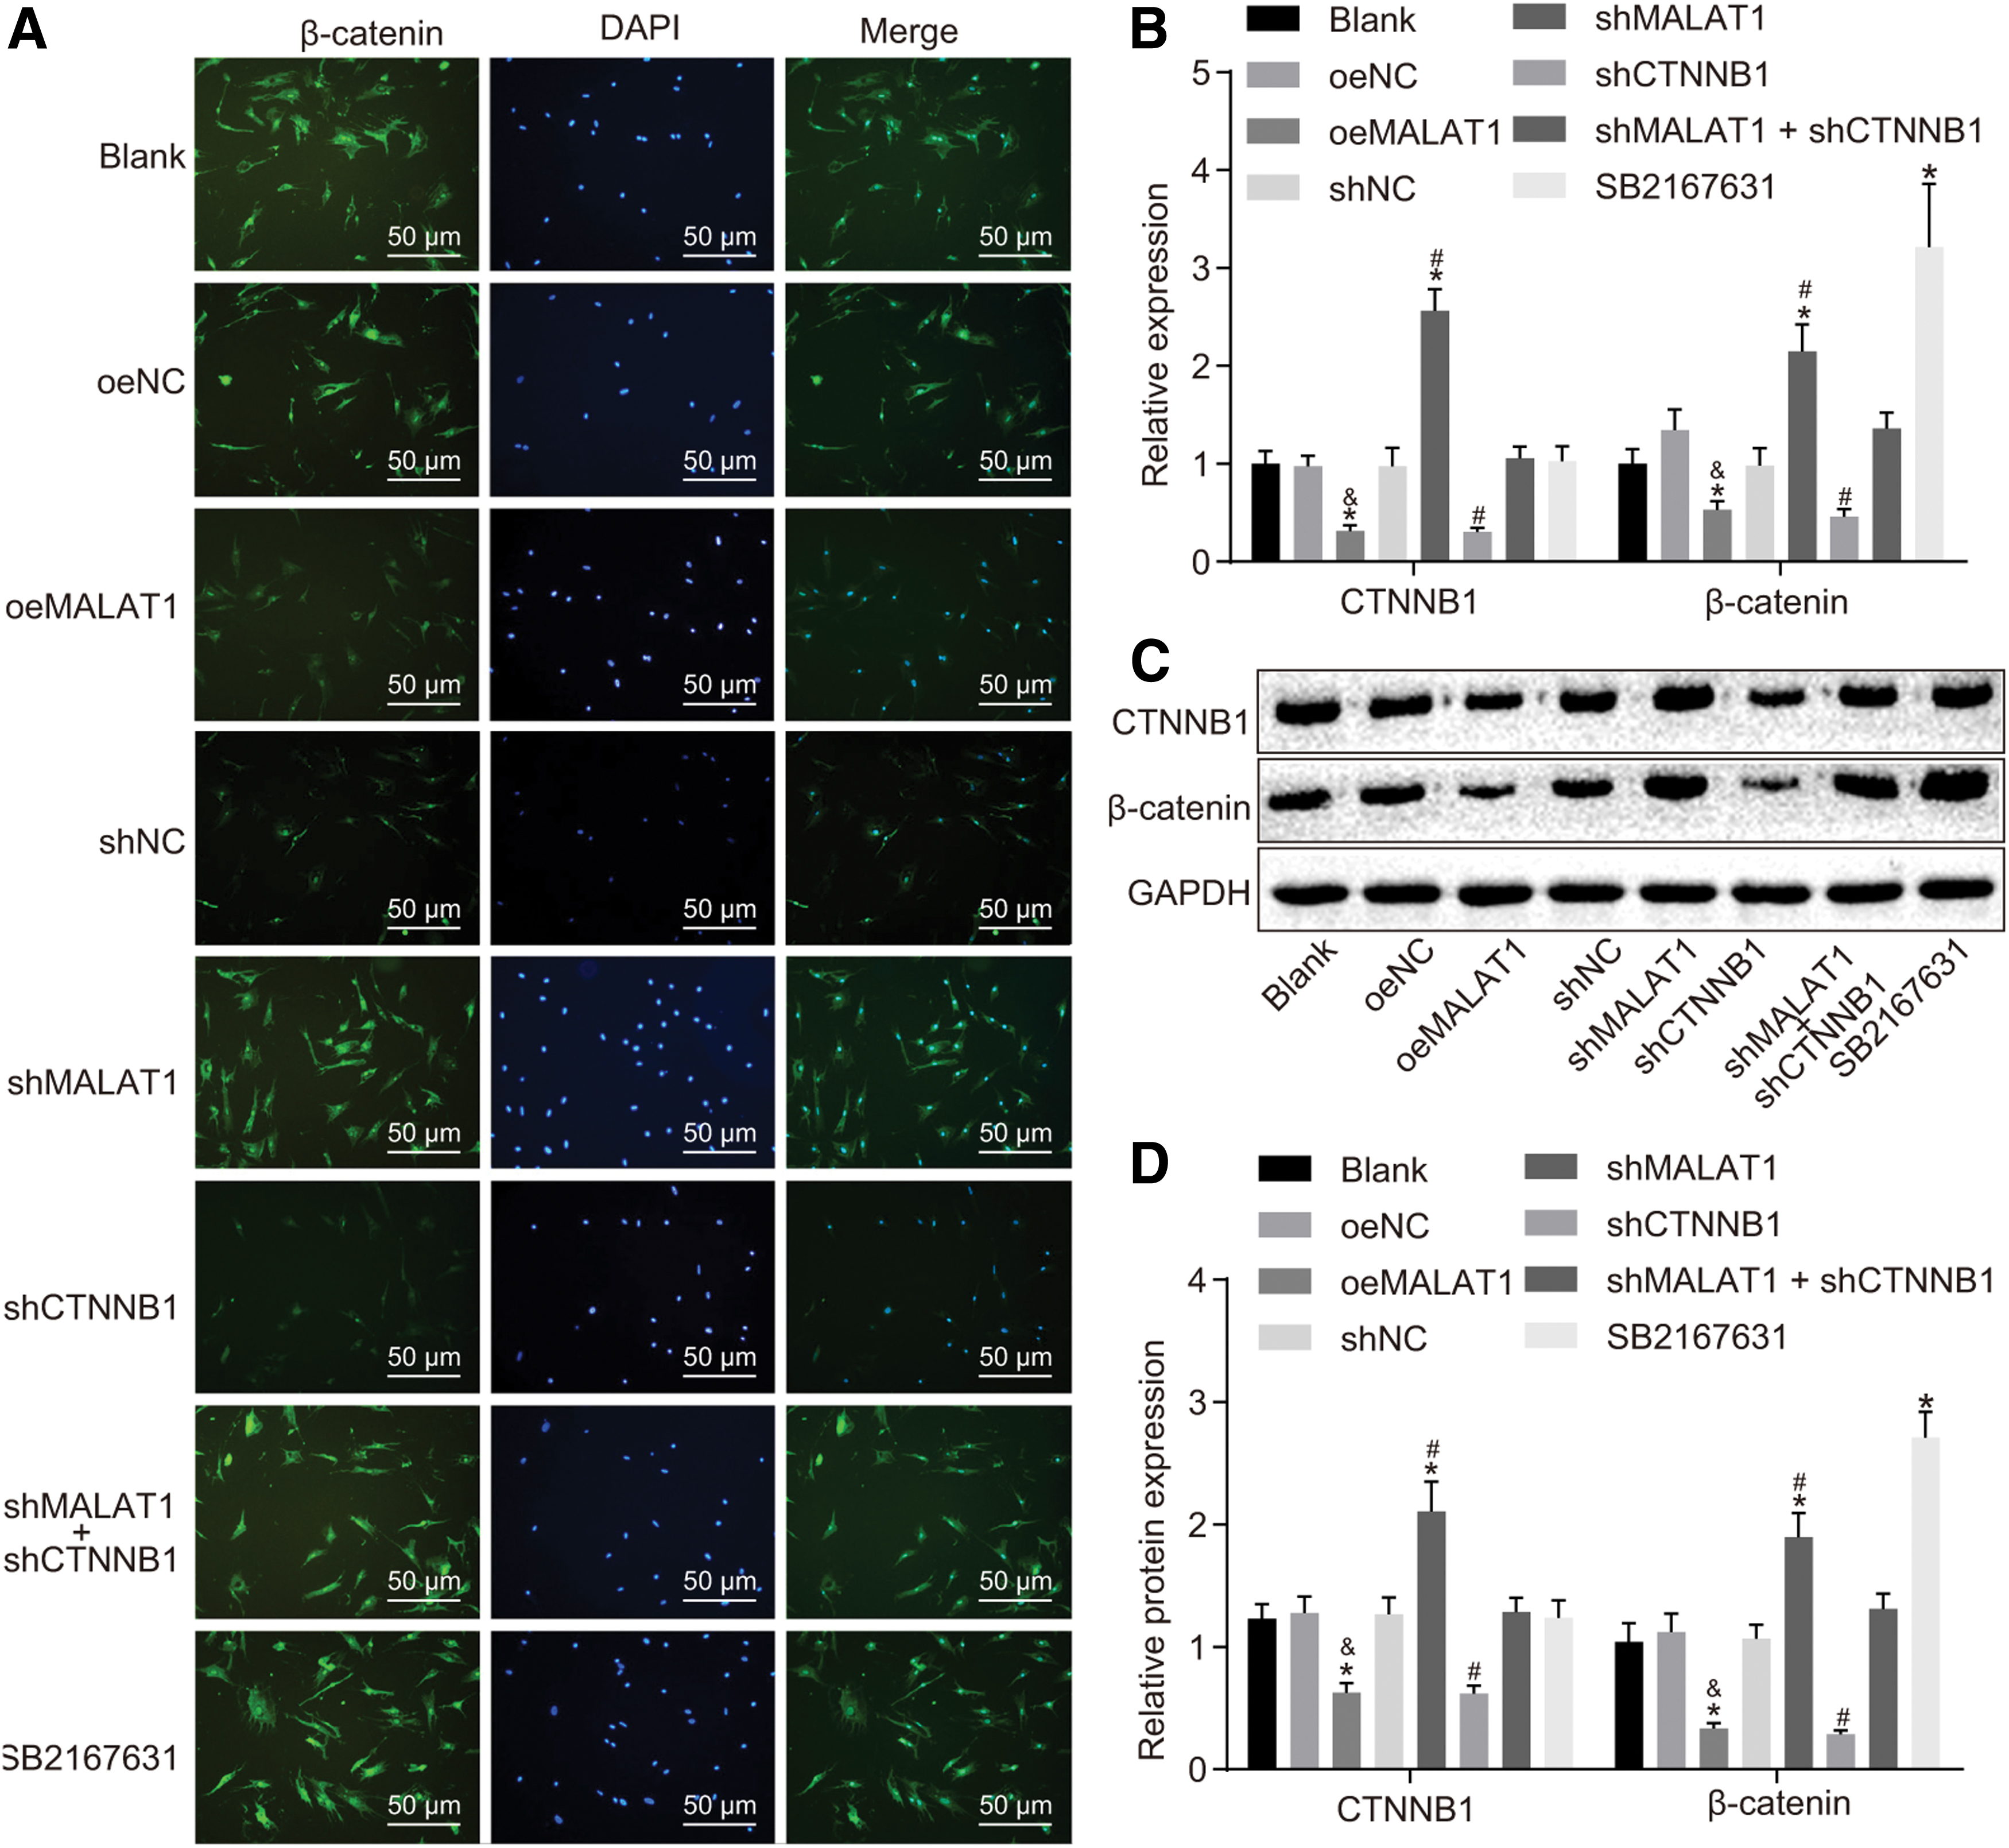
MALAT1 inactivates the Wnt signaling pathway through inhibiting CTNNB1
The effects of MALAT1 on the Wnt signaling pathway in FLSs of RA were investigated with the help of activator SB2167631 (Fig. 5A–D). Immunofluorescence assay, RT-qPCR, and Western blot analysis revealed that when compared with the blank group, nuclear translocation of β-catenin and β-catenin and CTNNB1 expression did not differ among the oeNC, shNC, and shMALAT1 + shCTNNB1 groups (all p > 0.05), while the addition of SB2167631 increased nuclear translocation of β-catenin (p < 0.05). Compared with the shNC group, the shMALAT1 group displayed elevated nuclear translocation of β-catenin and β-catenin and CTNNB1 expression, while the shCTNNB1 group showed reverse effects (all p < 0.05). In contrast with the oeNC group, the oeMALAT1 exhibited decreased nuclear translocation of β-catenin and β-catenin and CTNNB1 expression (p < 0.05). Taken together, these findings indicated that MALAT1 overexpression could suppress the transcription and mRNA expression of CTNNB1, thereby modulating the Wnt signaling pathway.
MALAT1 modulates the Wnt signaling pathway by CTNNB1.
MALAT1 modulates the secretion of cytokines, proliferation of FSLs, and apoptosis in FLSs of RA through the CTNNB1/Wnt axis
The effects of MALAT1/CTNNB1/Wnt axis on FLSs of RA were assessed by means of RT-qPCR, Western blot analysis, EdU staining, ELISA, TUNEL, and flow cytometry (Fig. 6A–F). In comparison with the shNC group, the shCTNNB1 group presented significant reductions in the mRNA expression and cellular levels of IL-6, IL-1β, and TNF-α and the mRNA and protein expression of Bcl-2; cell viability; and cell number arrested at S phase but presented elevations in the mRNA expression and cellular level of IL-10 and the mRNA and protein expression of Bax, cell number arrested at G0/G1 phase, and apoptosis rate (all p < 0.05). However, when compared with the blank group, the SB2167631 group revealed reverse trends of the above results (all p < 0.05). No statistical difference was found between the blank and shNC groups (all p > 0.05). These results demonstrated that MALAT1 could reduce the secretion of inflammatory cytokines, reduce FLS proliferation, and promote apoptosis in FLSs of RA through the CTNNB1/Wnt axis.

MALAT1 modulates the secretion of cytokines, proliferation, and apoptosis in FLSs of RA through the CTNNB1/Wnt axis.
Discussion
RA is an autoimmune disorder characterized by chronic inflammation of the synovial tissues as well as hyperplastic growth of FLSs; this being said, the exact underlying mechanism remains unclear. 29 FLSs are widely considered to play a key role in the pathogenesis of RA, which exhibit an ability to invade and destroy cartilage and bone during the course of RA. 30, 31 Numerous lncRNAs have been reported to be differentially expressed in patients suffering from RA, and act as central regulators of the inflammatory response. 32 In addition, lncRNAs have been identified as potent therapeutic targets and biomarkers in RA. 33 For example, lncRNA-NR024118 is downregulated in RA synovial fibroblasts, while the overexpression of lncRNA-NR024118 by shikonin has been shown to contribute to suppressing the inflammatory response in RA synovial fibroblasts. 34 In the current study, our results demonstrated that the overexpression of MALAT1 plays a contributory role to inhibit the proliferation and inflammatory progress of FLSs in RA.
A key observation of the current study revealed that MALAT1 was poorly expressed in FLSs in RA. Further experiments demonstrated that MALAT1 reduced the secretion of inflammatory cytokines and proliferation of FLSs, while acting to stimulate the apoptosis of FLSs in RA. MALAT1 has been identified as a regulator of inflammatory cytokine secretion in various human cancers. 35 by lncRNA profile analysis in serum exosomes, Song et al. revealed that MALAT1 was downregulated in RA blood exosomes compared with the normal control. 36 Pan et al. concluded that MALAT1 triggers the apoptosis of FLSs in RA by deactivating the phosphoinositide 3-kinase/Akt signaling pathway. 37 MALAT1 possesses anti-inflammatory abilities, which have been observed in ischemic stroke, whereby the repression of MALAT1 markedly aggravates oxygen and glucose depravation-induced expression of inflammatory cytokines monocyte chemotactic protein 1, IL-6, and E-selectin. 38 A previous report suggested that MALAT1 inhibits the secretion of inflammatory cytokines such as TNFα and IL-6 by interacting with NF-κB in the nucleus, thereby repressing its DNA binding activity. 39 MALAT1 has also been shown to regulate the transcriptional expression of cell cycle genes via differential interaction with Polycomb 2. 40 Liu et al. asserted that MALAT1 promotes the apoptosis of dopaminergic neurons in Parkinson's disease by sponging microRNA-124. 41 Together with the above studies, our results may help uncover a new therapeutic target MALAT1 for RA.
Interestingly, further evidence was obtained indicating that MALAT1 could promote the methylation on the CTNNB1 promoter region and therefore inhibit CTNNB1, leading to the inactivation of the Wnt signaling pathway. The CTNNB1 gene is known to encode β-catenin protein in humans. In the presence of Wnt ligand, β-catenin accumulates in the nucleus, where it functions as a coactivator for transcription factors of the TCF/LEF family, leading to the activation of Wnt responsive genes. 42 MALAT1 modulates the Wnt/β-catenin signaling pathway which has been shown to influence cellular activities in tongue squamous cell carcinoma. 43 Diminished MALAT1 levels are accompanied with translocation to the nuclei of β-catenin, and specifically, β-catenin which is involved in the transcription of MALAT1 via binding to the promotor region of MALAT1. 44
In order to further elucidate the effects associated with CTNNB1 and the Wnt signaling pathway on FLSs in RA, we employed short hairpin RNA against CTNNB1 and Wnt signal activator SB2167631. The results demonstrated that the CTNNB1 promoter methylation and Wnt pathway inactivation were involved in the MALAT1 inhibition of inflammatory cytokine production as well as cell proliferation of FLSs in RA. Elevated β-catenin expression was detected in FLSs in cases of RA both in vitro and in vivo due to the activation of Wnt/β-catenin pathway. 25 Downregulation of β-catenin has been reported to diminish the induction effect of IL-1β and TNF-α on the activation of Wnt/β-catenin pathway. 45 Elevated β-catenin leads to an increase in the presence of inflammatory cytokines in cardiomyocytes. 46 The secretion of inflammatory cytokines (IL-6 and IL-1β) has been reported to be regulated by transmembrane protein 88 by repressing the Wnt/β-catenin signaling pathway. 47 The Wnt/frizzled complex has been reported to regulate limb development, joint formation and tissue formation during embryogenesis. 48 Activation of the Wnt/β-catenin pathway in chondrocytes has been shown to trigger cartilage matrix degradation. 49 Furthermore, Wnt signaling can inhibit osteoclast-mediated bone resorption acting to moderately elevate bone mass. 50
Therefore, the identification of MALAT1/CTNNB1/Wnt axis in the progression of RA may facilitate the understanding of the mechanisms of RA, with potential of serving as a target for RA treatments in the future. Meanwhile, the further investigation of the mechanism should be more scrupulously and logically performed with a diverse study population, so as to support a promising clinical application in treatment for RA patients.
Footnotes
Acknowledgments
This study was supported by National Natural Science Foundation of China (Nos. 81402936 and 81302576), Jiangsu Provincial Natural Science Foundation of China (No. BK20131234), Six Talent Peak Research Project in Jiangsu Province (No. 2015-WSN-105), the 333 Project of Jiangsu Province, Jiangsu Province Youth Medical Talent Project (No. QNRC2016348), Key Talents of Science and Education in Yangzhou City in 13th Five-Year (No. ZDRC201881), and Jiangsu Province Youth Medical Talent Project as well as by Jiangsu Province Clinical Medical Science and Technology Project (No. BL2013034). We would like to give our sincere appreciation to the reviewers for their helpful comments on this article.
Author Disclosure
No competing financial interests exist.