




Abstract
Adeno-associated virus (AAV) is the most commonly used viral vector for both biological and gene therapeutic applications. Although many methods have been developed to measure quantity attributes of AAV, they are often technically challenging and time-consuming. Here, we report a method to titer AAV with GelGreen® dye, a safe green fluorescence nucleic acid dye recently engineered by Biotium company (Fremont, CA). This method, hereinafter referred to as GelGreen method, provides a fast (∼30 min) and reliable strategy for AAV titration. To validate GelGreen method, we measured genome titer of an AAV reference material AAV8RSM and compared our titration results with those determined by Reference Material Working Group (ARMWG). We showed that GelGreen results and capsid enzyme-linked immunosorbent assay results are comparable with each other. We also showed that GelRed® dye, a red fluorescence dye from Biotium, can be used to directly “visualize” AAV genome titer on a conventional gel imager, presenting an especially direct approach to estimate viral quantity. Finally, we showed that GelGreen and GelRed dyes can also be used to quantify self-complementary AAV (scAAV) and crudely purified AAV samples. In summary, we described a technique to titer AAV by using new generation of safe DNA dyes. This technique is simple, safe, reliable, and cost efficient. It has potential to be broadly applied for quantifying and normalizing AAV viral vectors.
Introduction
Adeno-associated virus (
Recombinant AAV (rAAV) can now be packaged and purified quite routinely in laboratories, but their titers can vary largely, depending on packaging and purification methods and scales of production. Therefore, it is imperative to establish accurate titers of rAAVs to ensure appropriate dosing. Many analytical methods, designed to measure either the physical or infectious titer of rAAV, have been developed. Among these are, for example, the dot blot hybridization, 11 enzyme-linked immunosorbent assay (ELISA), 12,13 electron microscopy, 14 quantitative PCR (qPCR), 15 –17 optical density, 18 DNA dye binding assay, 19 sodium dodecyl sulfate–polyacrylamide gel electrophoresis (SDS-PAGE) gel assay, 20,21 TCID50 (50% tissue culture infective dose), 22 replication center assay, 23 and infectious center assay assays. 24 Apparently each method has its own advantages and limitations. In the last several years, qPCR method has emerged as one of the most popular choices among laboratories, mostly due to its high sensitivity and broad dynamic range. But the qPCR method, like many others, also presents drawbacks. For instance, qPCR method is rather labor intensive. It is highly sensitive to experimental conditions, making it susceptible to errors. Factors such as PCR primers, reagents, equipment, and DNA standards can all significantly influence the test results. 25,26 Because of that, significant inter- and intralaboratory variations were often reported. 27 To overcome some of these issues, AAV titration method based on droplet digital PCR (ddPCR) was developed. 28 ddPCR is an endpoint PCR approach with the capability of measuring absolute number of DNA targets. Unlike qPCR, ddPCR is independent of reference materials and is less sensitive to inhibitors of PCRs, making it more accurate for measuring AAV titers. 29 However, ddPCR titration method is not widely used. Perhaps, the requirement for special instrument and relatively high labor intensity has limited its broad application.
AAVs can also be estimated by measuring their DNA contents more directly. For example, Cell Biolabs (San Diego, CA) has designed a commercial AAV titration kit (QuickTiter™ AAV Quantitation kit) based on quantifiable binding of DNA dye (CyQuant GR) to AAV genome. Similarly, picoGreen, another sensitive DNA dye, has also been used to measure AAV titer based on the same principle. 19 A major advantage of DNA dye-based assays is that they can be completed within 2–3 h, much shorter than many other methods. Also, DNA dye-based assays were reported to have much less intra- and interassay variability as compared with dot blot and qPCR methods. 19 Notably, both CyQuant GR dye and picoGreen are membrane-permeable dyes belonging to cyanine dye family. While CyQuant GR is often used in cell proliferation assays, 30 picoGreen dye is often used for quantifying double-stranded (ds) DNA. 31,32
In recent years, several safe nucleic acid dyes have been developed, such as GelGreen® and GelRed® from Biotium (Fremont, CA), SYBRsafe and SYBRgold from ThermoFisher Scientific (Waltham, MA), and Diamond™ from Promega (Madison, WI). These dyes are now widely available as more and more laboratories are choosing them to replace ethidium bromide to stain DNA and RNA in gels. Compared with CyQuant GR dye and picoGreen dyes, these new dyes are more affordable. Importantly, they are membrane impermeant, making them safer to use and more friendly to environment.
In an effort to develop a safe, simple, and reliable method for measuring AAV concentrations, we wondered if we could take advantage of the newly developed safe nucleic acid dyes, such as GelRed and GelGreen. According to Biotium, both GelRed and GelGreen can readily detect 1 ng of DNA in gel, with some users being able to detect bands containing <0.1 ng DNA. If these claims are true, then GelRed and GelGreen should at least be capable of detecting 3–4 μL of AAV at titer of 1 × 10¹¹ GC/mL, which contains ∼1 ng DNA (GC stands for genome copy; equations are provided in the Materials and Methods section). This level of sensitivity should be sufficient for most AAV samples as standard laboratory protocols typically produce AAVs with titers one to two logs >1 × 10¹¹ GC/mL.
Here, we report a method to measure AAV titer with GelGreen and GelRed. This method is fast, safe, reliable, and cost efficient. We believe this method could be broadly useful in quantifying and normalizing AAV vectors.
Materials and Methods
rAAV production and purification
rAAVs were produced in-house using triple transfection methods. 33 –36 The plasmids used for transfections were as follows: (1) cis-plasmid containing a gene expression cassette flanked by AAV2 inverted terminal repeats (ITRs); (2) trans-plasmids containing the AAV2 rep gene and either AAV2 or AAV9 capsid protein genes; (3) adenovirus helper plasmid pAdΔF6. rAAVs were purified by iodixanol gradient ultracentrifugation as previously described. 16,37 The AAV serotype 8 Reference Standard Material (AAV8RSM) 27 was purchased from American Type Culture Collection (ATCC No. VR-1816).
Cytation 3 plate reader
Cytation 3 Multi-Mode plate reader from BioTek (Winooski, VT) was used for DNA binding assay. It was equipped with a 488 nm laser for excitation and a 528/20 filter for emission. GelGreen was chosen to stain DNA because its excitation and emission spectrums are similar to GFP, and it can be readily detected by virtually any plate readers. Reactions were carried out in Falcon® 96-well clear flat bottom culture microplates (No. 353072) from Corning Brand (Corning, NY).
Alkaline agarose gel
We conducted alkaline agarose gel electrophoresis as previously described. 38 –40 DNA ladder was purchased from New England Biolabs (Ipswich, MA). Before gel loading, DNA ladder (500 ng) and AAV samples were first heated to 95°C for 3 min, then cooled on ice. Agarose gel was run at constant voltage of 30 V overnight in cold room. DNA was stained with 1/10,000 GelRed.
Gel imager
We used a DNA gels imager (Gel Logic 200 Imaging System) from Kodak (Rochester, NY), combined with a UV light box, to visualize viral DNA stained with GelRed. Digital images were acquired and analyzed by ImageJ software as described 41 to provide a semiquantitative analysis.
Data analysis
Statistical analyses were conducted with Graphpad Prism software (San Diego, CA). Student's t-test and one-way ANOVA with Tukey's post hoc test were used for data comparisons. Differences were considered significant when p < 0.05. Data are shown as mean ± standard deviation (SD).
The limit of detection (LOD) is defined as the mean value of sample blanks plus 3 SDs. The limit of quantification (LOQ) is defined as mean value of sample blanks plus 10 SD.
A plasmid DNA, initially constructed as a cis-plasmid for making rAAV, was used in this study as DNA standard. Its concentration was measured by NanoDrop™ Spectrophotometers (ThermoFisher). The amounts of DNA (ng) in viral samples, either lysed or unlysed, were determined by standard curves. We then calculated the amount of encapsided DNA as the difference between the values of lysed samples and unlysed samples.
The following are equations for converting encapsided DNA (ng) to single-stranded AAV (ssAAV) titer (GC/mL):
where
Note 1: 330 g/mol is the average mass of a single nucleotide. Genome size of ssAAV is typically between 4,000 and 5,000 nt.
Note 2: If DNA sequence is available, molecular weight (MW) of an AAV genome can be more precisely determined. For example, AAV8RSM was produced by pTR-UF-11 plasmid. 42 Based on its sequence, we calculated the MW of AAV8RSM's genome to be 1,334,245 (g/mol). This number was used to compute titers of AAV8RSM in this report.
Note 3: Since self-complementary AAVs (scAAVs) comprise dimeric genomes of ssAAV, genome length of scAAV can be roughly estimated as just one ITR shorter than two times the length of ssAAV. 39,40,43
Results
Detection of DNA by GelGreen
To determine the detection limit and optimal concentration of GelGreen dye, we carried out quantitative DNA binding assays using Cytation 3 plate reader. To set up the binding assay, we prepared several sets of DNA standards using a plasmid DNA. Each set of standard contains 12-point serial dilutions of DNA ranging from 0 to 50 ng. DNA standards were then transferred to 96-well plate containing GelGreen diluted in phosphate-buffered saline (PBS) before fluorescence measurement.
Calibration plot of fluorescence intensity versus DNA is shown in Fig. 1A (linear scale). Between 1/3,000 and 1/100,000 dilution, GelGreen readily responded to a wide range of DNA, showing linearity for DNA in the range of 0–50 ng, with all assays exhibiting acceptable correlation efficient (R 2 ) of >99% (Fig. 1A). However, at high concentrations of GelGreen (1:500 and 1:1,000), fluorescence signals no longer responded to DNA (Fig. 1A). To view the effects of dye more directly, we replotted the data as fluorescence intensity versus dye concentration in Fig. 1B. This plot revealed a series of inverse bell-shaped dose–response curves for any given amount of DNA (0.78–50 ng), with their peak values all occurring at ∼1/10,000 dye dilution and with sharp downslopes occurring after 1/3,000. Thus in our assay, the optimal dye concentration for detecting DNA was 1/10,000, agreeing with manufacture's recommendation.
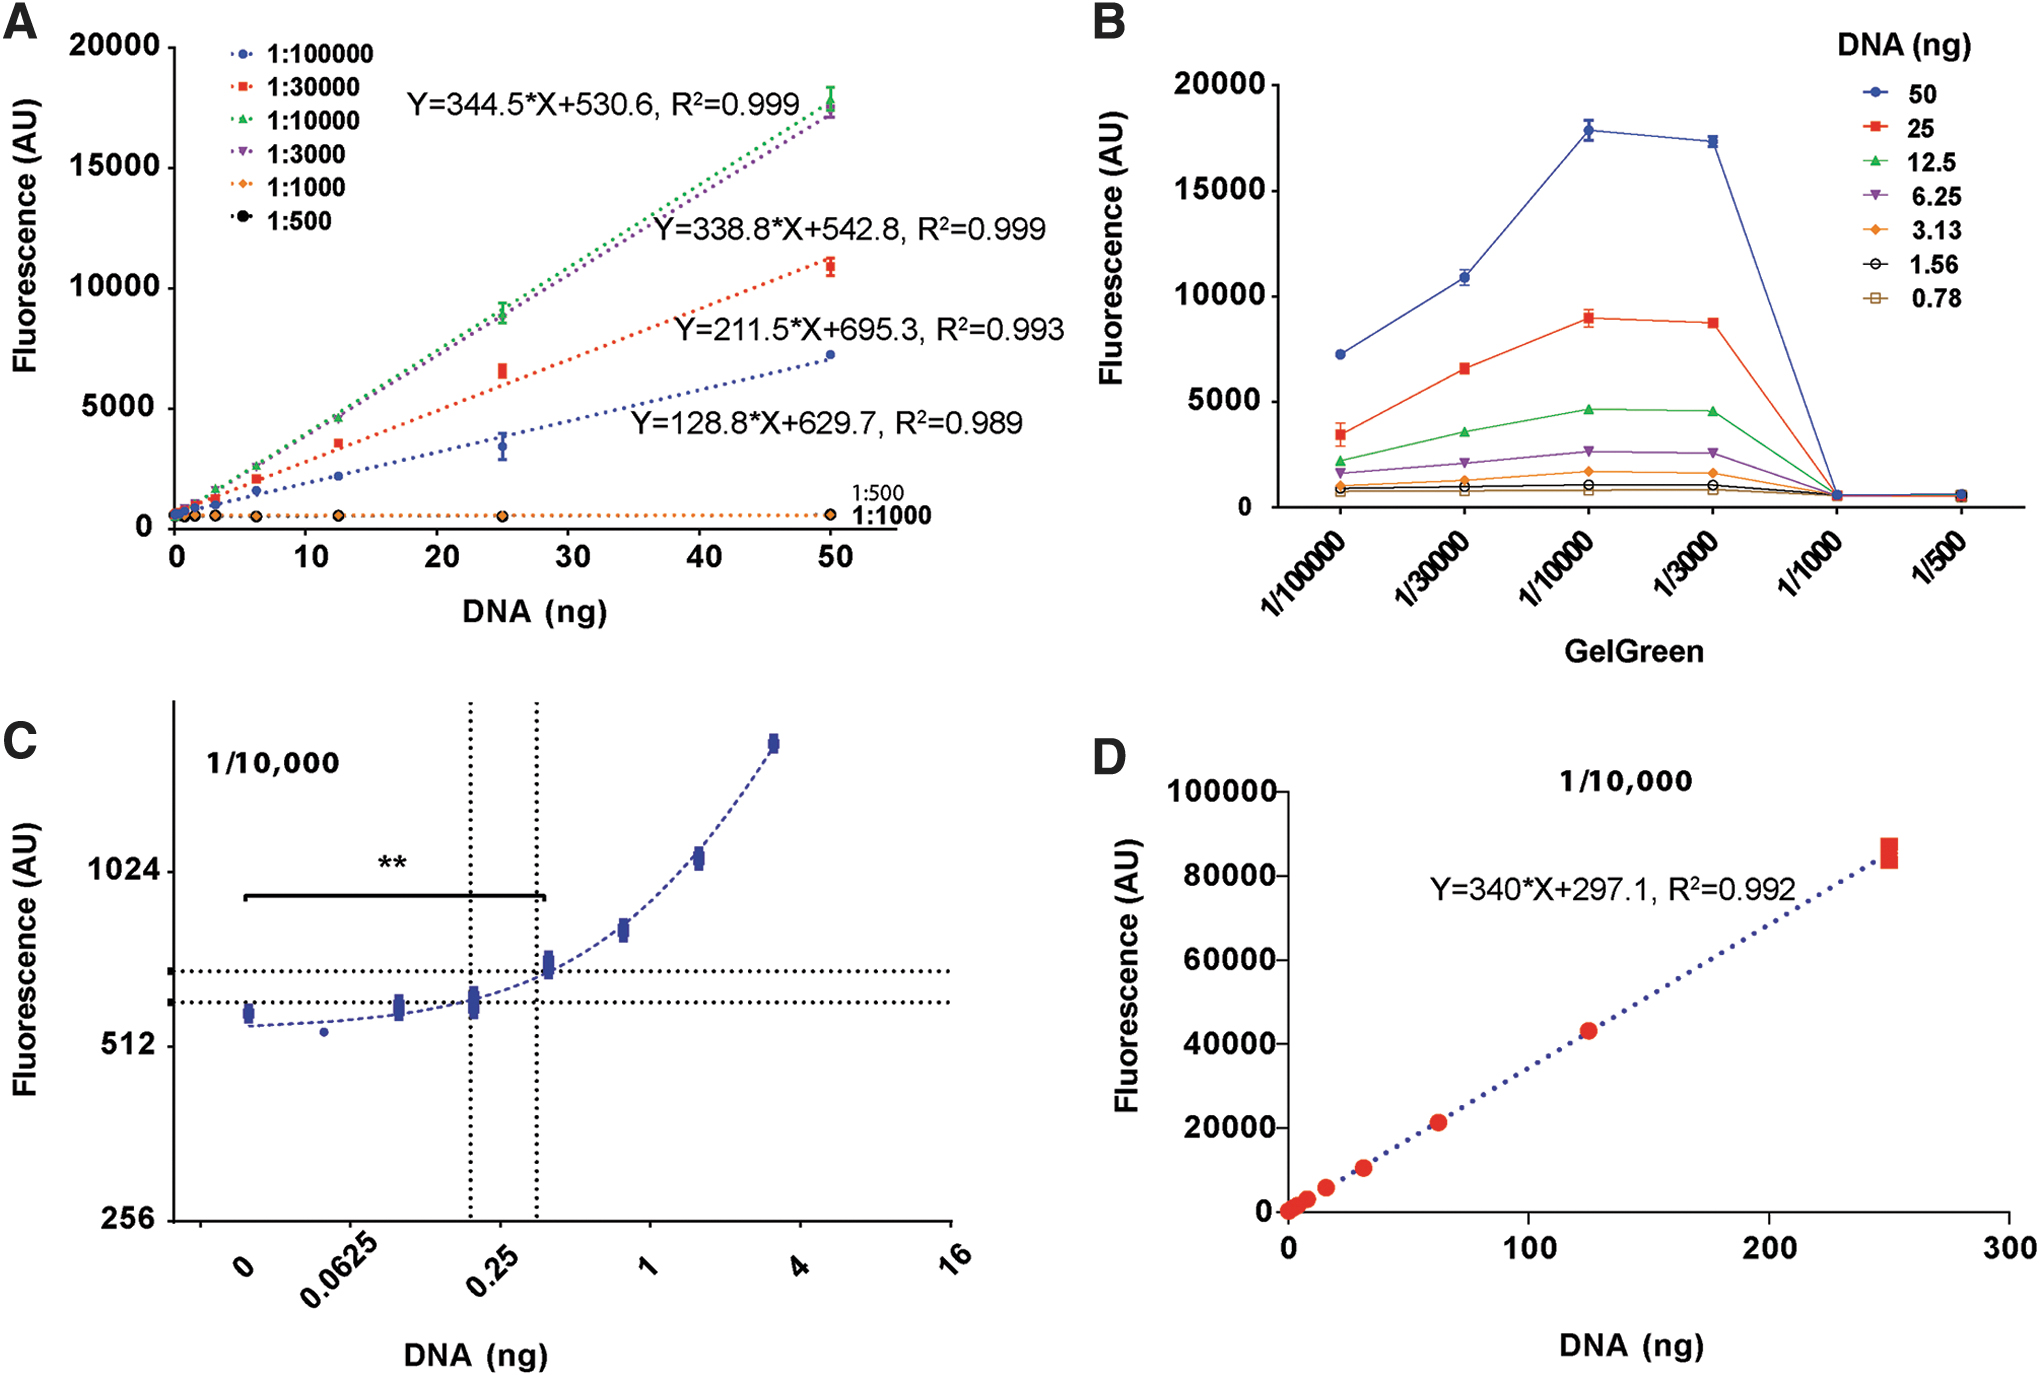
Detection of DNA by GelGreen®.
To assess the sensitivity of the DNA binding assay, we measured both the LOD and the LOQ of GelGreen at 1/10,000 dilution (Fig. 1C). With the SD to be 10.60 and mean value to be 583 for sample blanks (n = 3), we calculated the LOD and LOQ to be 611 and 690, respectively. Based on these values, we derived LOD to be 0.19 ng and LOQ to be 0.35 ng from standard curve (marked with dashed lines in Fig. 1C). In addition, using t-test we found that 0.39 ng DNA was the lowest amount to achieve statistical significance when compared with sample blanks (707.70 ± 26.03 vs. 583 ± 0.60, n = 3, p < 0.01). Thus, GelGreen-based DNA binding assay is sensitive enough to measure as low as 0.2–0.4 ng DNA.
To determine upper LOQ when using the GelGreen, we prepared DNA standards ranging from 0 to 2,000 ng. GelGreen fluorescence showed linearity for DNA up to 200 ng (Fig. 1D). However when DNA was ≥500 ng, fluorescence signals were oversaturated.
Release of viral DNA by heating or alkaline lysis
AAV genome is encapsided. To measure it, one must first break apart viral capsids. Common methods for this purpose are proteinase K digestion 28 and heat inactivation. 18 Often proteinase K digestion is proceeded by DNase treatment to remove DNA contaminations. 25,28 Heat inactivation is often performed ∼70°C in the presence of 0.05–0.1% SDS. 18 It usually takes 1 h to perform these inactivation protocols.
In an effort to further shorten experimental time, we devised and tested two strategies for releasing viral DNA contents. The first strategy involves heating samples at high temperature of 95°C, which can be done easily with standard PCR thermocycler. Meanwhile, we also tested whether it is necessary to include SDS during heating process. In this experiment, we used an in-house-produced AAV sample packaged in capsid from serotype 2. The predicted size of this rAAV vector is 4221 nt. Its genome integrity was confirmed by alkaline gel electrophoresis (Fig. 7D, left lanes). To lyse viral particles, we first diluted AAV into 10 μL of PBS in PCR tubes, then heated samples to 95°C in thermocycler for various lengths of time. After heating and natural cooling, samples were transferred to 96-well plate containing 90 μL PBS and GelGreen at 1/10,000 dilution for fluorescence measurement.
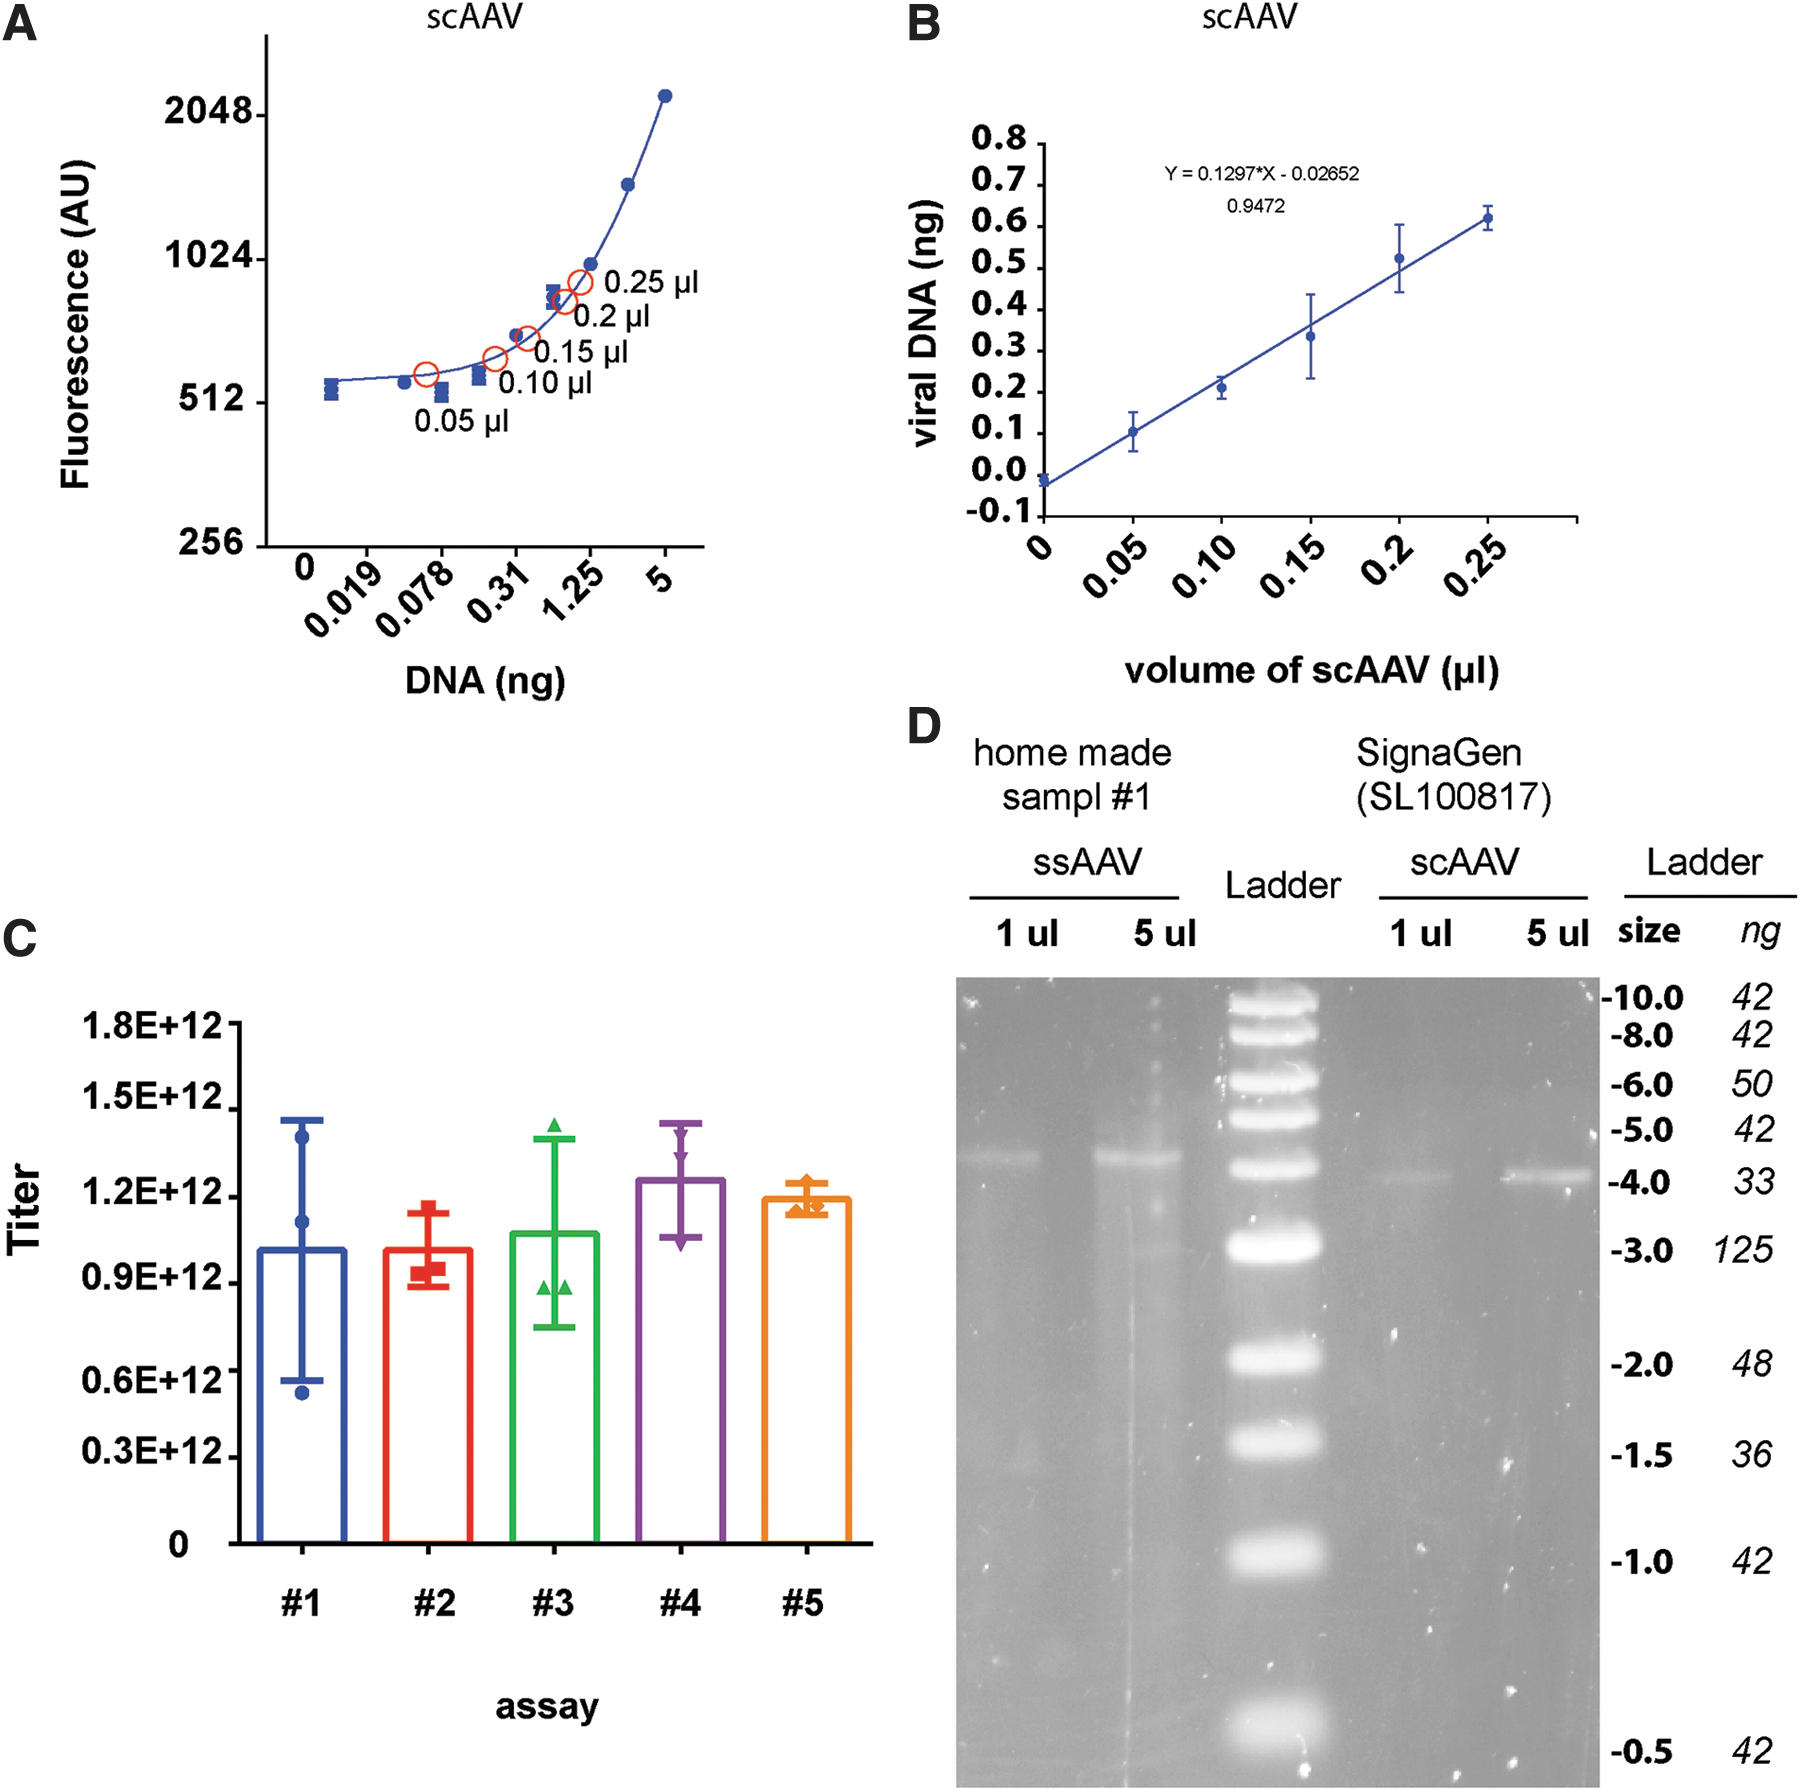
Measuring scAAV titers by GelGreen and GelRed.
Results are shown in Fig. 2A. We first inspected intrinsic dye signals (blanks) and compared that with signals of nonheated samples (see the blue line, 0 SDS). Sample blanks yielded signals of 515.7 ± 26.58 (n = 3), whereas the nonheated sample exhibited slightly higher fluorescence (647.3 ± 16.80, n = 3). The small difference here was thought to be caused by contamination of nonencapsided DNA in the AAV prep. Heating samples at 95°C caused a larger increase of fluorescence signals, suggesting that contents of AAV genome were released. Surprisingly, merely 5 min of heating appeared to be sufficient, as longer heating (up to 20 min) produced no further increase of fluorescence. This observation implied that most of capsids, if not all, were already destroyed by heating after 5 min.
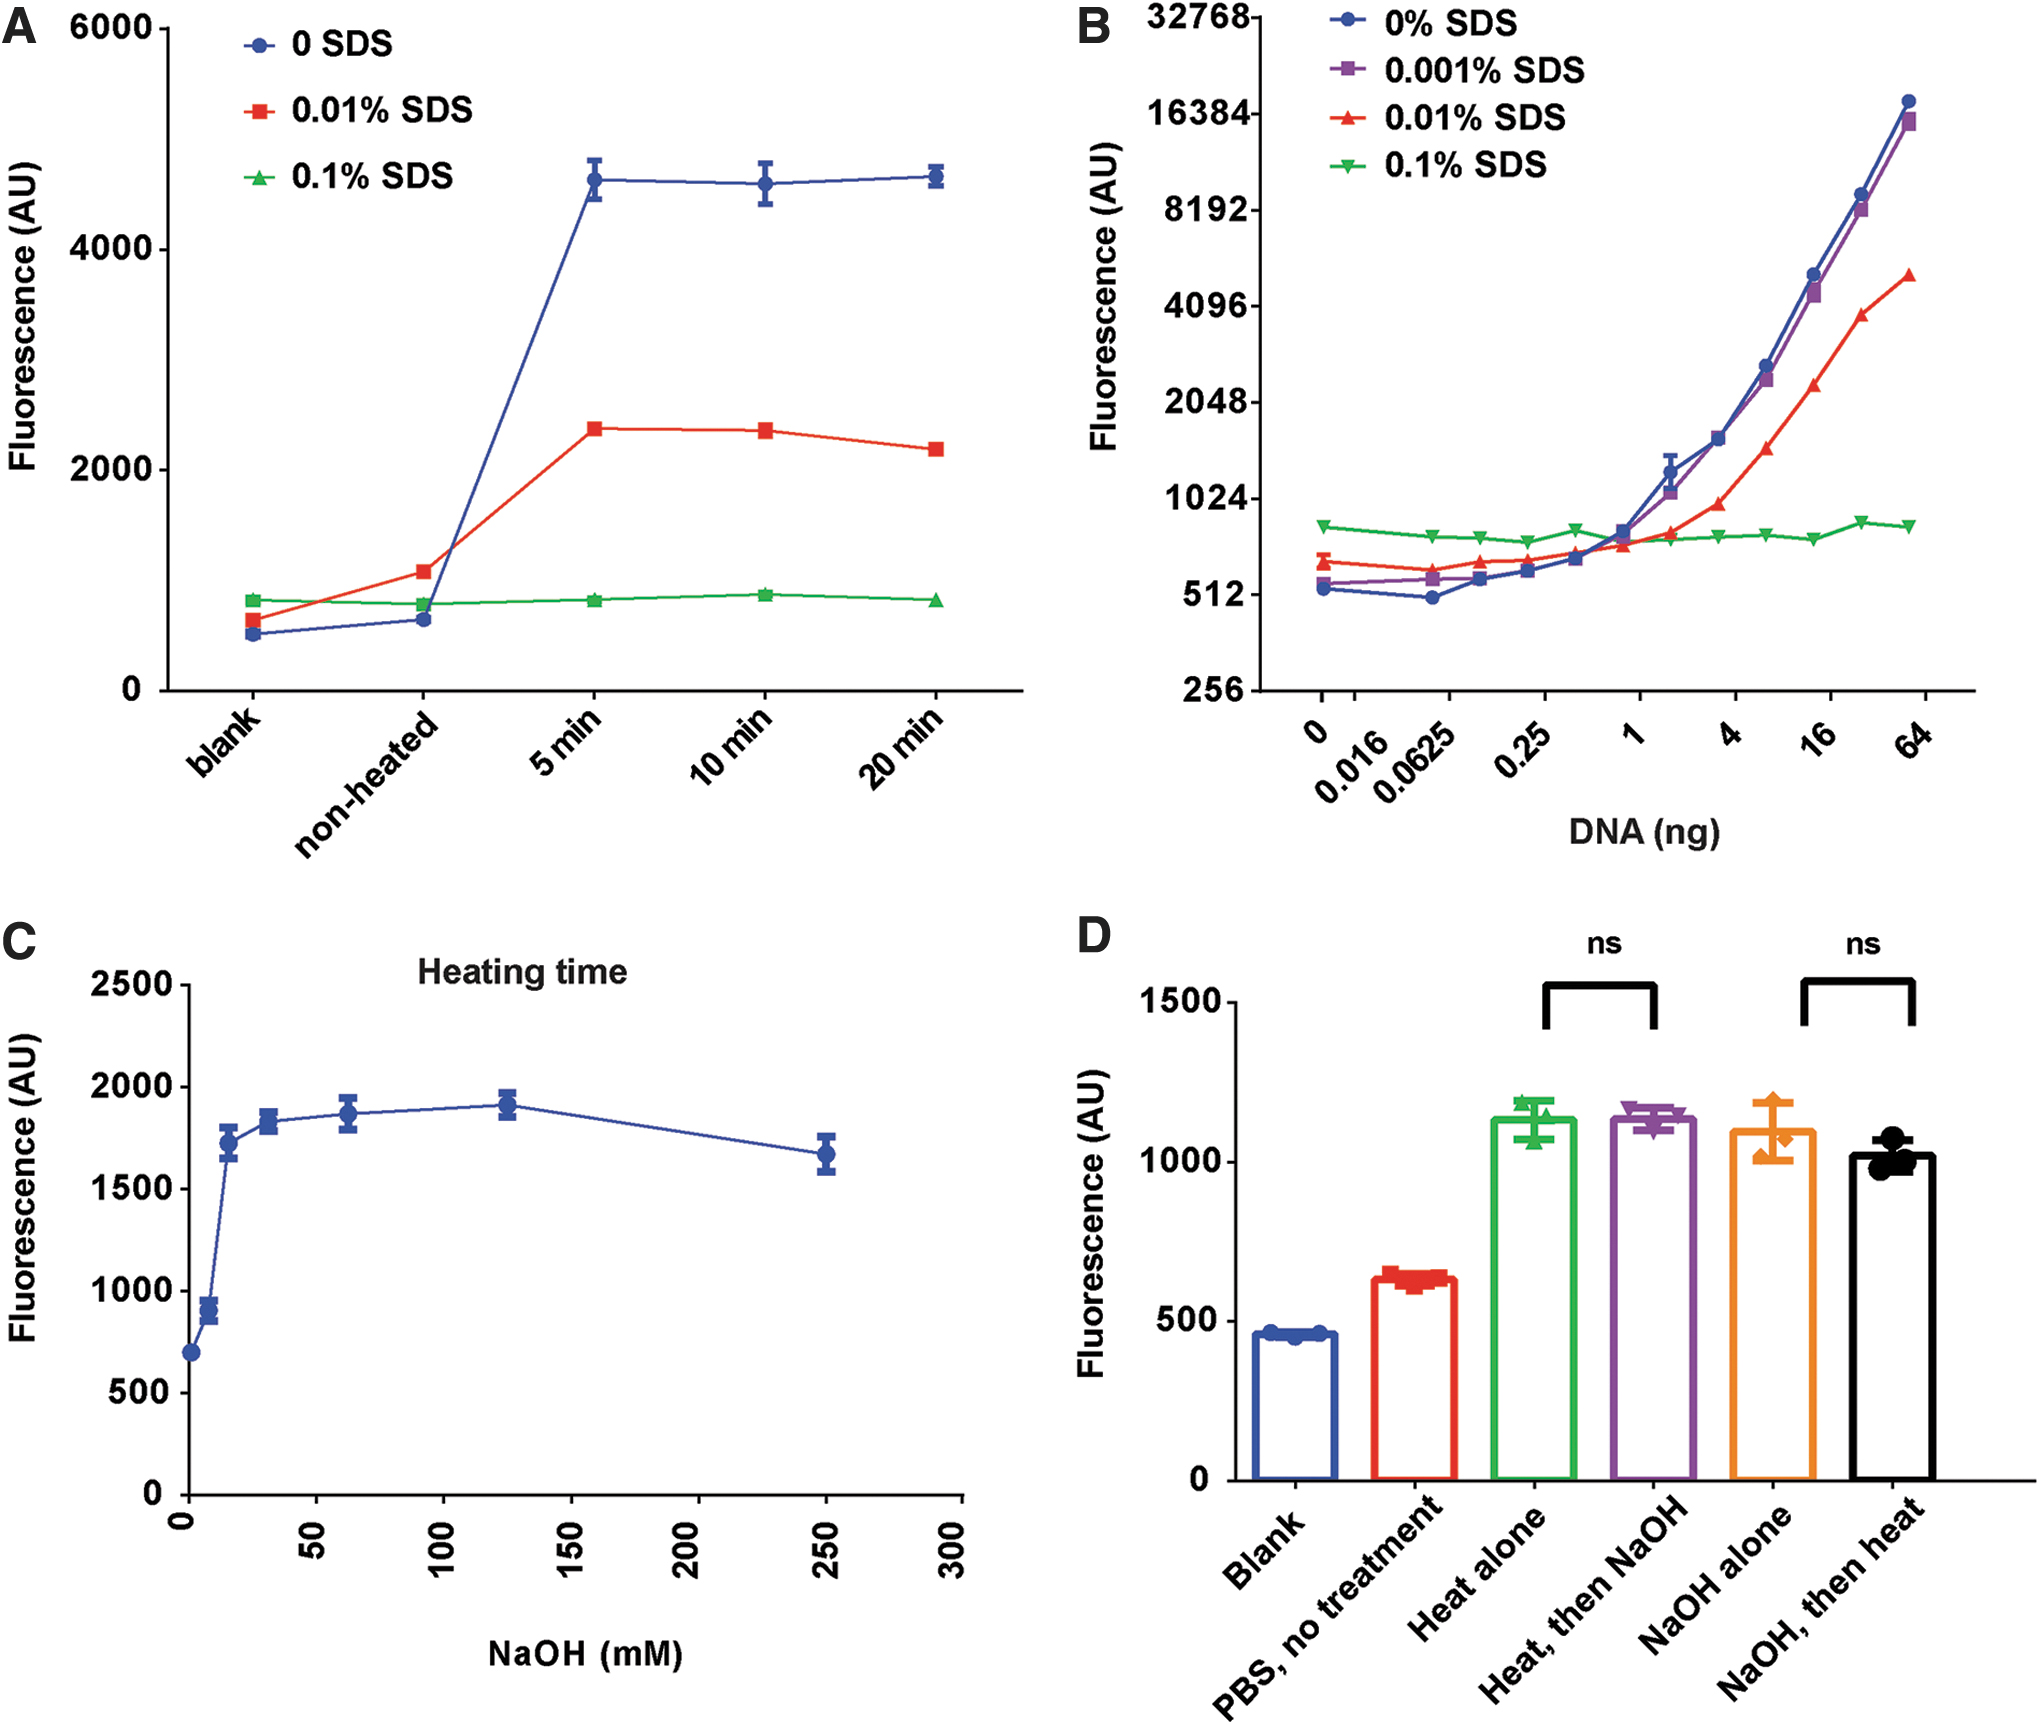
Release of viral DNA by heating at 95°C and by alkaline lysis.
When samples (10 μL) were heated in the presence of 0.1% SDS, which yielded 0.01% SDS in final volume of 100 μL (red line), fluorescence signals again peaked at 5 min. However, these signals were significantly lower when compared with those without SDS (blue line). In an extreme case, when SDS was at final concentration of 0.1% (green line), the increase of fluorescence by heating was completely prevented (Fig. 2A).
To investigate the effect of SDS more carefully, we prepared four sets of DNA standard containing different amounts of SDS and performed DNA binding assays. Results are summarized in Fig. 2B. While small amount of SDS (0.001%) had little effect as compared with control, 0.01% SDS already caused significant inhibition. At 0.1% SDS, fluorescence responses completely vanished. Thus, SDS must be kept low, otherwise will obstruct DNA binding assay. We advise that care should be taken when using GelGreen to stain DNA in gels. Many GelGreen users may not be aware that high amount of SDS (0.5–1%) is often included in 10 × DNA loading dyes, which could have significant negative impact on detecting DNA bands by GelGreen. In conclusion, we found that 5 min of heating at 95°C in PBS provided a simple and efficient way to release viral DNA. Meanwhile, we also found that not only was SDS unnecessary but it was also detrimental for DNA detection by GelGreen.
The second strategy we explored was the alkaline lysis. It is a very common molecular technique for protein and DNA denaturation, but it has rarely been used for lysing AAV particles. 17 We decided to test whether encapsided viral DNA can be efficiently released by NaOH. Different amount of NaOH was tested for its lysing ability. The procedure is simple. We first treated viral samples (10 μL) with 2 μL of NaOH, we then added 2 μL of Tris buffer (PH 5.0) of two times the concentration of NaOH, to neutralize NaOH. Right after that we conducted DNA binding assay as described.
A dose–response curve of NaOH on fluorescence signals is shown in Fig. 2C. Clearly, fluorescence signals were enhanced by NaOH, with large increases observed from samples treated with 15–125 mM NaOH. It is likely that under these conditions, viral particles were fully lysed. In comparison, 7.5 mM NaOH only caused a small fluorescence increase, suggesting that it only triggered a partial release. Based on the dose–response curve, we estimated the EC50 of NaOH treatment to be ∼12 mM. Also noticeable was a small decline of fluorescence when NaOH was >125 mM. We suspected that high dose of NaOH/Tris treatment may either cause DNA damage or weaken DNA/dye interactions. In light of this observation, we consider proper range of NaOH to be between 30 and 125 mM.
Together, we explored two methods to release viral DNA from capsids. Both methods can be done quickly, and both appear to be fully effective. To be more assertive about their efficacies, we tested if combining two treatments could yield higher lysis than single treatment alone. In brief, we either added NaOH (100 mM) to samples that have already been heated at 95°C, or we subjected NaOH-treated samples to 95°C heating. As shown in Fig. 2D, neither did NaOH (Purple) increase fluorescence to samples that have already been heated (Green), nor did heating (Black) enhance fluorescence of NaOH-treated samples (Orange). Together, these results suggest that AAVs were fully lysed by either of the two lysing methods alone, rendering the follow-up treatment nominal. In summary, heating method and alkaline method are both efficient and quick. Alkaline lysis is even easier to set up, giving itself a slight edge.
To demonstrate that two lysis protocols described above for AAV2 are also effective for other AAV serotypes, we tested an AAV sample from another serotype, AAV9. Procedures to lyse AAV9 capsids were carried out essentially as described above. As shown in Supplementary Fig. S1A, 5 min of heating at 95°C yielded a large increase of fluorescence signals. After that, fluorescence is largely unchanged, suggesting that 5 min of heating was also sufficient to lyse AAV9. In a separate experiment, we accessed the release of encapsided AAV9 viral DNA by NaOH. Evidently, alkaline treatment was also effective in lysing AAV9 capsids (Supplementary Fig. S1B). Analysis of dose–response curve revealed that the EC50 of NaOH treatment for AAV9 was ∼22 mM, which was noticeably higher than the EC50 of NaOH treatment for AAV2 (∼12 mM). Overall, these experiments demonstrate that both heating and alkaline procedures are effective for lysing AAV9.
Titration of AAV8RSM by GelGreen method
To validate GelGreen method for AAV titration, we measured titer of an AAV reference material (ARM) and compared our results with published results. The reference material was developed and characterized by ARM Working Group (ARMWG), for the purpose of normalizing titers of AAV vectors. 27,44 Two ARMs, AAV2RSM and AAV8RSM, are available from ATCC (listed as ATCC-VR1616 and ATCC-VR1816, respectively). Their respective titers provided by ARMWG are 3.28 × 10¹⁰ GC/mL and 5.75 × 10¹¹ GC/mL. 27,44 We decided to use AAV8RSM for validation because its titer is higher and also because it has been extensively characterized. Many details were included in a series of publications, 26,27,45,46 making it possible to compare our data with the literature values.
To measure the titer of AAV8RSM, we conducted three independent assays, with each assay performed in triplicates. For lysed samples, 1 μL of AAV8RSM was diluted in 10 μL PBS, followed by 2 μL of NaOH (500 mM) treatment for 2 min and then 2 μL of Tris (1 M, pH 5.0) neutralization. For unlysed controls, 1 μL of AAV8RSM was simply diluted in PBS without addition of NaOH and Tris buffer. Twelve-point DNA standards ranging from 0 to 5.0 ng were also prepared. DNA binding assay was conducted as described before. Data from all three experiments are summarized in Table 1.
Titration of AAV8RSM (ATCC VR-1816)
Titer of the AAV8RSM was determined by GelGreen method. Three independent assays were conducted, with each assay being performed in triplicates.
AAV, adeno-associated virus; CI, confidence interval; CV, coefficient of variation; SD, standard deviation.
An example to illustrate the analysis process is provided in Fig. 3. In this experiment, unlysed samples exhibited fluorescence (527.5 ± 12.5, n = 3) similar to sample blanks (516.8 ± 22.3, n = 3), indicating that contamination of nonencapsided DNA was low in AAV8RSM. Based on the standard curve (Fig. 3, inset), we estimated nonencapsided DNA to be 0.15 ng for each μL of AAV8RSM. Meanwhile, lysed samples exhibited averaged fluorescence of 762.7 ± 27.42 (n = 3), translating to 1.20 ng of DNA per μL of AAV8RSM. Therefore, encapsided DNA, calculated by subtracting values of unlysed samples from values of lysed samples, equals 1.05 ng/μL virus. Based on the provided equation, titer of AAV8RSM from this experiment was calculated to be 4.7 × 10¹¹ GC/mL.

Titration of AAV8RSM by GelGreen method. Calibration plot of standard DNA in linear–linear scale and in log–log scale (inset). The DNA standard was made by serial dilution from 5 ng with dilution effect of 0.7. Trend lines, linear regression equations, and R 2 are shown. Dashed lines are indicated for three untreated AAV samples intersecting Y-axis at 514, 529, and 539 (green), and three NaOH-treated samples at Y-axis of 771, 732, and 781 (red), respectively.
In the same way, we calculated titers of AAV8RSM for each independent assay (Table 1). At first glance, titers determined in each replicate, from all three experiments, fall into the range of 3–5 × 10¹¹ GC/mL, similar to those obtained from ELISA method in previous studies. 26,27,45,46 We discuss this in more detail in the Discussion section. Intra-assay analysis was performed, and it revealed low coefficients of variation (CV), with the highest being 16.4% and lowest being 7.7% (Table 1). Inter-assay analysis of three independent experiments showed mean titer of 4.23 × 10¹¹, with low 95% confidence interval (CI) and high 95% CI to be 2.50 × 10¹¹ and 5.97 × 10¹¹, respectively, and with interassay CV to be 16.3%. Taken together, CVs of both interassay and intra-assay are quite low, indicating high repeatability and reproducibility of the GelGreen method (Table 1).
Evaluation of the accuracy of GelGreen-based AAV titration method
To further evaluate accuracy of the GelGreen method, we designed and performed a new experiment, in which we adopted the concept of amplification efficiency from qPCR analysis. The amplification efficiency of qPCR is calculated as E = −1 + n (−1/slope), where n is the dilution factor and slope can be derived from linear regression of threshold cycle (Ct) versus log of input DNA. In general, efficiency between 90% and 110% is acceptable.
We measured efficiency of GelGreen method using serial twofold dilution of a home-made AAV sample. We used NaOH to lyse viral particles and conducted DNA quantification as before. DNA standard curve is shown in Fig. 4A. As expected, fluorescence of serially diluted AAV samples progressively declined (Fig. 4B). Similarly, DNA mass, which was converted from florescence based on standard curve, also took steps down during serial dilution (Fig. 4C). We recognized that 1 μL of viral sample contained ∼18 ng DNA. A simple calculation yielded a titer of 6.99 × 10¹² for this sample (Fig. 4C). After six rounds of twofold dilution, total DNA was reduced to <0.3 ng and consequently became nondetectable (Fig. 4B–D). Meanwhile, linear relationships existed between Log2(DNA) and number of dilutions up to 6 (Fig. 4D). Slopes from three independent serial dilutions were derived from the linear portion of the curves to attain a mean value of −0.96 ± 0.04. Accordingly, we calculated efficiency of GelGreen method to be 106% ± 11%, which is very close to the theoretical 100% efficiency.

Evaluation of the accuracy of the GelGreen method.
Visualization of AAV quantity with gel imager
Having measured AAV titer with plate reader, we wondered if we can even “visualize” AAV titer directly with a gel imager. We are equipped with a system intended for imaging ethidium bromide stained DNA. Thus, we chose GelRed in this experiment because its fluorescence properties are similar to those of ethidium bromide. A pilot experiment found that 1/10,000 dilution of GelRed is also the optimal dilution factor for DNA detection, like GelGreen.
We selected an AAV sample whose titer was ∼4.5 × 10¹². We made four-point serial dilution (twofold) of virus in a PCR strip, with the starting tube containing 1 μL virus diluted in 10 μL of PBS. Samples were heated at 95°C for 5 min in a PCR thermocycler. After heating, we pipetted 5 μL of 1/3,300 GelRed into PCR strip to make final 1/10,000 GelRed dilution. We also made DNA standard (0–50 ng) in a PCR strip. Viral samples and DNA standard were imaged simultaneously with gel imager (Fig. 5A). By side-by-side comparison, it is quite easy to approximate that the amount of DNA in the starting tube is between 6.26 and 12.5 ng. To be more quantitative, we analyzed image file with ImageJ software to generate a calibration plot. This plot shows linear relationship between fluorescence intensity and DNA up to 25 ng (Fig. 5B). Based on the standard curve, we calculated the DNA content in the starting tube to be 11.9 ng. Similarly, viral sample's DNA contents at each dilution were derived. The plot of Log2(DNA) versus dilution showed a linear relationship with a slope of −0.87, which yielded a 121% efficiency (Fig. 5C). Thus, simple imaging method provided a quick and fairly effective way to estimate AAV titers.
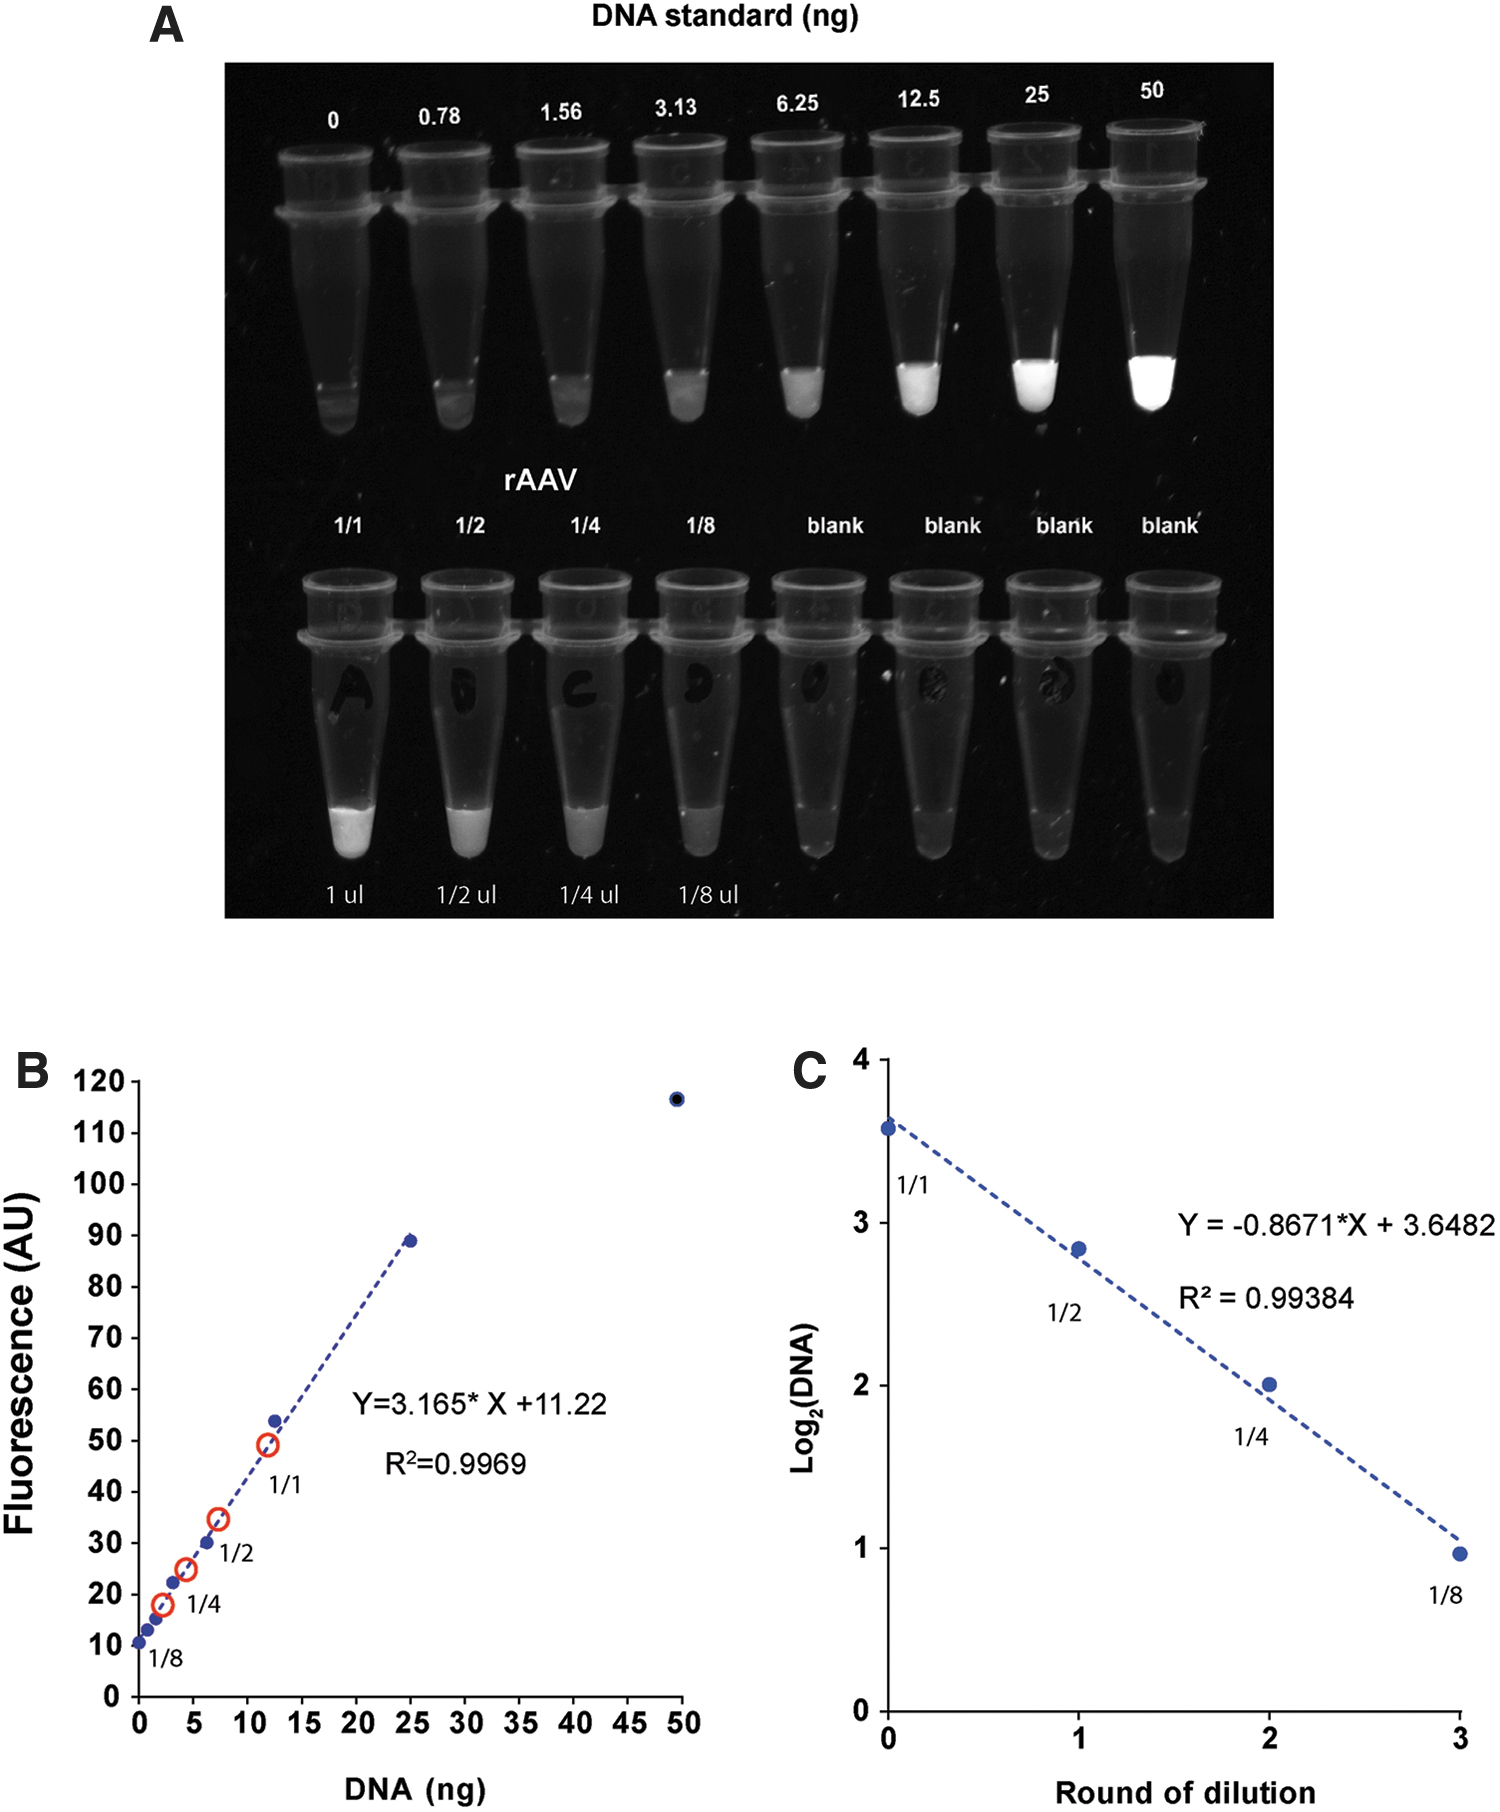
Direct visualization of AAV quantity by gel imager.
Estimation of AAV titers at different steps of purifications
We also wondered whether GelGreen and GelRed could be used to quantify AAV at different steps of purifications. Since iodixanol and CsCl density gradients represent two common methods for AAV purification, we first analyzed if buffers used in these two procedures may affect fluorescence signals. We tested several buffers: cell resuspension buffer (0.1 M NaCl, 50 mM Tris HCl, pH 8.5); modified cell resuspension buffer (0.1 M NaCl, 50 mM Tris HCl, pH 7.4); 40% iodixanol solution (40% iodixanol in PBS-MK buffer; the PBS-MK contains 1 × PBS plus 1 mm MgCl2, and 2.5 mm KCl); 60% iodixanol solution (60% iodixanol solution in PBS-MK buffer); 1.32 g/mL CsCl in PBS and 1.44 g/mL CsCl in PBS. For the test, we first added 10 ng of plasmid DNA into 10 μL of above-described buffers, we then transferred the solution to 96-well plate containing 90 μL of PBS with GelGreen at 1/10,000 dilution. To evaluate efficiencies of various buffers, fluorescence signals from PBS were used for normalization. Results summarized in Fig. 6A show that all the buffers exhibited the same efficiencies, except for CsCl-based solutions, which showed concentration-dependent declines. A 30% decrease in efficiency was observed for 1.44 g/mL CsCl buffer. Therefore to more accurately measure AAV samples containing CsCl, it is recommended to prepare DNA standards also with CsCl to offset the inhibition. In contrast to CsCl, iodixanol did not affect fluorescence measurements (Fig. 6A). Furthermore, when AAV samples (serotype 2) were diluted in 40% iodixanol solution, the fluorescence signals were not affected (Fig. 6B). Thus, iodixanol-based solutions are compatible with GelGreen assays.

Quantifying AAV at different steps of purification.
Next, we test if we can estimate AAV quantity from crude preparations. We performed triple transfection protocol on a 10 cm culture plate for a small-scale AAV production. Three days after transfections, cells were collected and then resuspended into 500 μL of cell suspension buffer (0.1 M NaCl, 50 mM Tris HCl, pH 8.5). After three times freeze–thaw cycles, samples were briefly centrifuged at 3,000 g and then the supernatant was collected (crude lysate). We quickly measured total DNA in the crude lysate by GelRed. However, the fluorescence signal was very high, indicating the presence of large amount of nonviral DNA contamination (data not shown). To overcome this problem, we performed a quick PEG precipitation. In brief, 8% PEG-8000 and 0.5 M NaCl was added to the lysate. The mixture was incubated on ice for 1 h and then centrifuged at 3,000 g for 30 min. The pellet was resuspended with 500 μL of cell suspension buffer (crudely PEG purified AAV prep). To measure DNA content, we mixed 10 μL of sample with 40 μL of PBS containing 1/10,000 GelRed in small PCR tubes, then visualized the fluorescence on our gel imager (Fig. 6C). Evidently, the signals were still quite intense (Fig. 6C, bottom row, tube 1), and it was still difficult to recognize the effect of heating (tube 2 vs. tube 1). To further reduce the contamination, samples were treated with Benzonase (50 U/10 μL of lysate) for 30 min at 37°C (tube 3). To our satisfaction, contamination was greatly reduced (tube 3 vs. tube 1). Importantly, a clear increase in fluorescence was observed after heating (tube 4 vs. tube 3). We estimated heat-sensitive DNA component to be ∼5.0 ng/10 μL of sample, which translates to the titer of 2.0 × 10¹¹ GC/mL for the crudely purified AAV. To obtain more quantitative measurement, we also used plate reader. As illustrated in Fig. 6D, heat-sensitive component from 10 μL of crudely purified AAV was also measured to be 5.0 ng, agreeing with the GelRed measurement. Thus, DNA binding assay can be applied to quantify crudely purified AAV.
Measuring scAAV titers
Unlike ssAAV, scAAV contains dsDNA genome. Here, we tested whether GelGreen can also be used to quantify scAAV. We obtained a scAAV sample from SignaGen Laboratories (scAAV-Synapsin-GFP, Serotype 2). GelGreen assay was performed as described in previous experiments. We set up five sets of experiment with each set to contain increasing amount of virus (Fig. 7A). Based on the standard curve, we converted fluorescence signals to DNA mass. Figure 7B shows a linear relationship between the volumes of virus and the DNA mass, suggesting the accuracy and consistency of the assay. Finally, scAAV titers were calculated. The values were all ∼1.0 × 10¹² (GC/mL) for each experiment (Fig. 7C). We also performed alkaline gel electrophoresis to analyze this scAAV sample. We confirmed that the scAAV-Synapsin-GFP has genome size ∼4.0k nt. Judging by the intensity of DNA ladder, 5 μL of scAAV was estimated to contain 10–15 ng DNA, equating to AAV titer of 1–1.5 × 10¹² GC/mL viral, consistent with the value we measured using GelGreen assay. Together, we demonstrated that GelGreen assay can be used to quantify scAAV.
Discussion
Here, we report a method to quantify AAV vectors based on binding of AAV's DNA with a safe nucleic dye. This method offers several advantages. First, it is very fast. It allows determination of AAV titrations in ∼30 min. Second, it is safe and cost efficient. The Biotium dyes we used are membrane impermeant, making them safer to use and less hazardous to environment. It is also economical. Each experiment typically requires <1 μL of dye, costing only 20–30 cents. Most importantly, this method is consistent, as interassay and intra-assay variations are both small. We believe this is mainly due to the fact that DNA was measured directly without amplification. Skipping amplification steps makes the assay less sensitive to many factors that are crucial for enzyme-based reactions, such as PCR and capsid ELISA. The main disadvantage of the method is its low sensitivity, at least when compared with qPCR method and ELISA. Since LOD of GelGreen is ∼0.3 ng, we estimate that the lowest AAV titer this method can detect is ∼1.0 × 10¹⁰ GC/mL at the expense of 10 μL of viral sample.
AAV genome is ssDNA of ∼4.7-kilobases (kb). It was flanked with two 145 nucleotide-long ITRs that actually form dsDNA. Thus in its natural form, AAV genome is made of both ssDNA and dsDNA. Although it has been suggested that after denaturation AAV genome anneals to form dsDNA, 18 the extent to which dsDNA is converted from ssDNA remains unclear. Given this concern, it is perhaps less compelling to use exclusive dsDNA dyes such as CyQuant and picoGreen for AAV titration. On the contrary, GelRed and GelGreen dyes bind both ssDNA and dsDNA, making them more suitable than dsDNA dyes for measuring AAV's genome content. GelRed and GelGreen are also more economical than CyQuant and picoGreen. Currently, CyQuant is only sold in CyQUANT™ Cell Proliferation Assay (ThermoFisher). PicoGreen can be purchased from ThermoFisher and lumiprobe (Hunt Valley, Maryland). It needs to be used at high concentration (1/100 to 1/200 dilution). Approximately, the cost of making 10 mL of binding solution is ∼$50–100 for picoGreen, but is only $0.25 for GelGreen.
Using plate reader, we directly compared GelGreen and picoGreen in detecting DNA. As shown in Supplementary Fig. S2, dynamic ranges and sensitivities of the two dyes were quite similar, except that background fluorescence of picoGreen was higher, which caused an upshift of response curve (Supplementary Fig. S2A, B). Using an ssAAV sample (serotype 2), we measured its DNA content by GelGreen and picoGreen in parallel. The titers measured by picoGreen were ∼10% lower than that by GelGreen (paired t-test, p = 0.0334) (Supplementary Fig. S2C). One possible explanation is that a fraction of DNA remained as single stranded during the binding assay, causing underestimation of AAV titer by picoGreen.
We have explored two methods for releasing viral DNA from viral particles. The first method is heat inactivation. It has been demonstrated that AAV serotypes are different in their thermal stability, with AAV2 being the least thermally stable and AAV5 being the most thermally stable. In PBS buffer, the melting temperature (Tms) of different AAV serotypes ranges from 66.5°C up to 89.5°C. 47 Therefore, we choose to heat AAV samples at 95°C. At such high temperature, even the most stable AAV5 should be destroyed. The second method we used is the alkaline lysis method. In our experiment, we found the EC50 of NaOH treatment to be 12 and 22 mM for AAV serotype 2 and serotype 9, respectively. For other AAV serotypes, their sensitivities to NaOH treatment remain to be examined. To be more rigorous, we have used high concentration of NaOH (100 mM) in our experiments to lyse AAV.
AAV8RSM has been extensively characterized by ARMWG. In the first paper published in 2014, 27 genome titer was determined be 9.62 × 10¹¹ GC/mL, based on qPCR data obtained from 16 laboratories. However, significant variations were found among these laboratories, with ∼100-fold difference between the lowest titer (4.6 × 10¹⁰ GC/mL) and the highest titer (4.7 × 10¹² GC/mL). ELISA method was also used to measure capsid particle titer of AAV8RSM. This assay yielded a value of 5.5 × 10¹¹, which is actually lower than the value determined by qPCR. 27 The second paper published in 2016 demonstrated a “free-ITR” qPCR method. Using this method, the titer of AAV8RSM was measured to be 5.65 × 10¹¹ GC/mL, which was close to the titer determined by dot blot method and ELISA methods (table 4 in D'Costa et al. 26 ). In the third paper published in 2018, AAV8RSM titer was determined to be 5.65 × 10¹¹ GC/mL by qPCR targeting the SV40 polyA sequence (table 1 in François et al. 45 ). This result is similar to the results published in 2016. 26 However in 2019, three independent laboratories from ARMWG carried out AAV8RSM titration again. 46 This time, the genome titer determined by qPCR (1.48 ± 0.618 × 10¹² GC/mL) was two- to threefold higher than total capsid particle titer determined by ELISA (5.76 ± 0.33 × 10¹¹). So despite a series of studies that spanned many years, discrepancies remain to be resolved, although it was evident that ELISA method was more consistent than qPCR method. 46
We decided to statistically compare the titer determined by GelGreen method in our study with the titers determined by ELISA and qPCR methods in ARMWG's most recent report. 46 For this purpose, we imported results from Penaud-Budloo et al. 46 and replotted their data as “ELISA” group and “qPCR” group in parallel with our GelGreen data (Fig. 8). One-way ANOVA revealed significant difference among the three groups (F 2,7 = 6.053, p < 0.05). Tukey's post-test showed that the GelGreen group is significantly different from the qPCR group but is not different from the ELISA group. Specifically, titer measured by GelGreen was 4.23 ± 0.70 × 10¹¹, which is slightly lower although is still within one SD to the titer measured by capsid ELISA (5.73 ± 2.62 × 10¹¹).
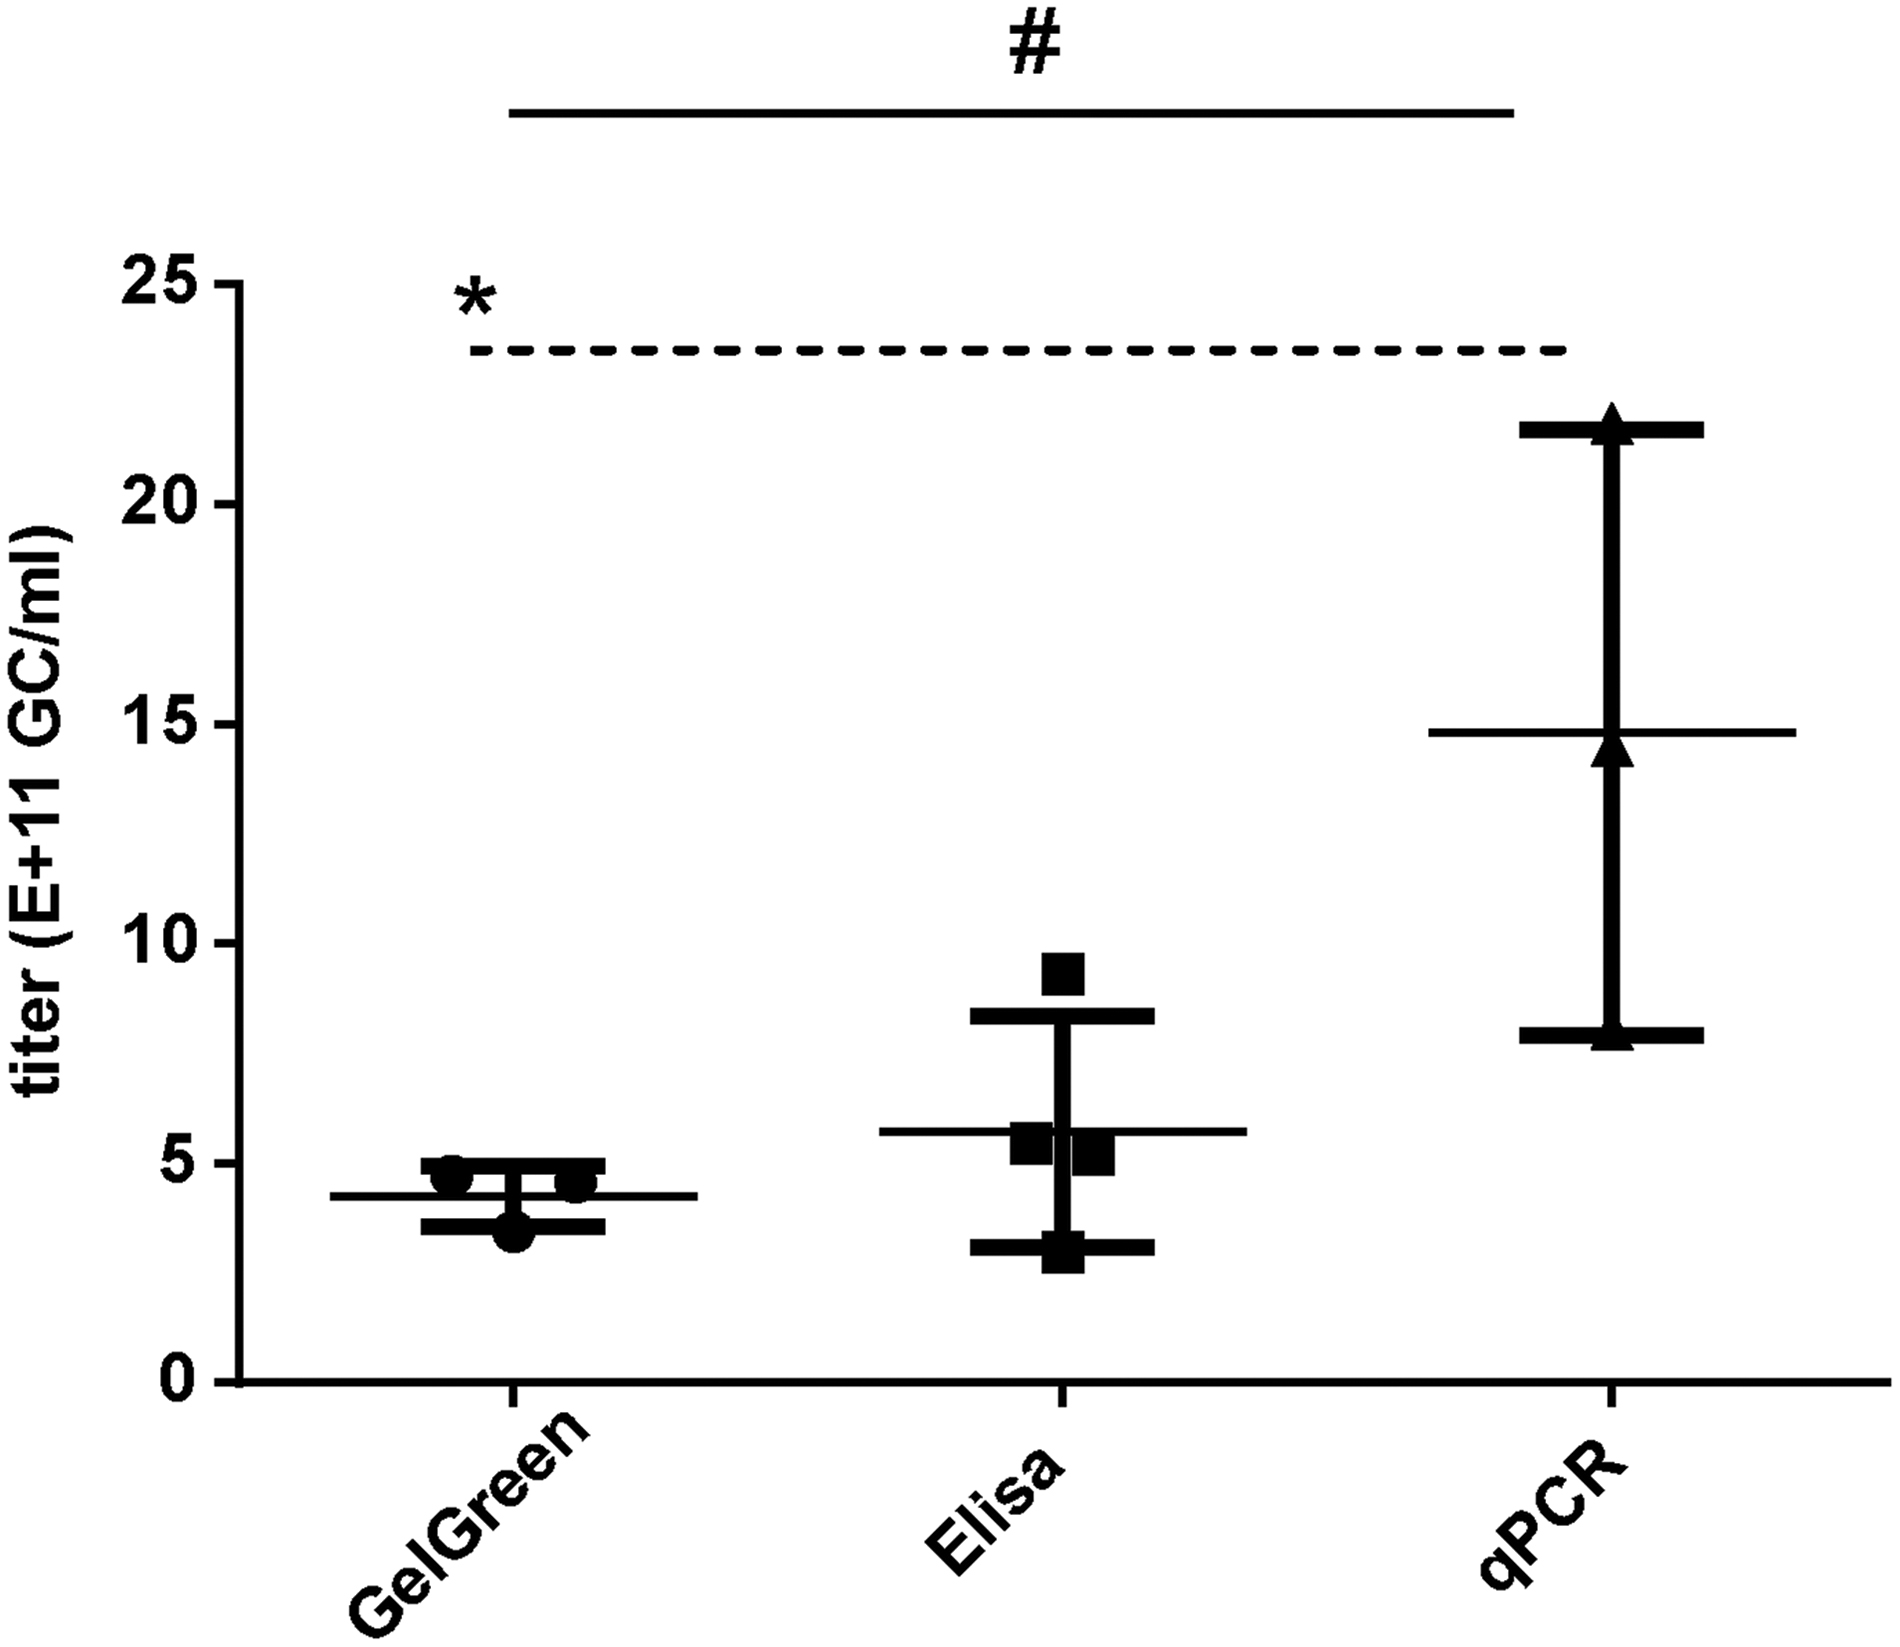
Comparisons of titers of AAV8RSM determined by different methods. Bar graph showing titers of AAV8RSM determined by three different methods. The first set of data is based on GelGreen method in this study. The second set (ELISA) and third set (qPCR) of data were imported directly from table 3 and table 1 of Penaud-Budloo 2019. 46 Bars indicate SD. # p < 0.05, one-way ANOVA; *p < 0.05, Tukey's multicomparison test. ELISA, enzyme-linked immunosorbent assay; qPCR, quantitative PCR.
In conclusion, we report a protocol to measure AAV titer using safe nucleic acid dyes (A flow chart is illustrated in Supplementary Fig. S3). This protocol is simple, safe, reliable, and cost efficient. It could be broadly applied for quantification and normalization of AAV vectors. Future studies can explore more DNA dyes and may find improvements in detection limit.
Footnotes
Authors' Contributions
J.X., Y.Z., and S.H.D. designed experiments, collected and analyzed data, and wrote the article.
Acknowledgments
The authors thank Northwestern University Analytical BioNanotechnology Equipment Core facility of the Simpson Querrey Institute for providing Cytation 3 plate readers and for technical support.
Author Disclosure
No competing financial interests exist.
Funding Information
This work was supported by NIH R01 EY030169 to Y.Z., Whitehall grant to Y.Z., and NIH R01 EY018204 to S.H.D.
Supplementary Material
Supplementary Figure S1
Supplementary Figure S2
Supplementary Figure S3
References
Supplementary Material
Please find the following supplemental material available below.
For Open Access articles published under a Creative Commons License, all supplemental material carries the same license as the article it is associated with.
For non-Open Access articles published, all supplemental material carries a non-exclusive license, and permission requests for re-use of supplemental material or any part of supplemental material shall be sent directly to the copyright owner as specified in the copyright notice associated with the article.
