
Abstract
The safety, biodistribution, and pharmacokinetics of any new therapeutic tumor DNA vaccine must be evaluated in preclinical studies. We previously developed the DNA vaccine (CpDV-IL2-sPD1/MUC1 and survivin), which showed excellent antitumor effects in a variety of tumor models. In this study, we demonstrate the safety and biodistribution after immunization with naked DNA vaccine (10 mg/kg) by electroporation in a mice model. All mice reached the end of the study with good body conditions. By established and validated QPCR method, we found high-copy plasmid DNA at the injection site (muscle) on day 1 in all eight animals, followed by a downward trend. By day 49, a small amount of plasmid DNA was still detectable, but only in one mouse. On reproductive safety, no plasmids existed in the ovary at any time point. Also, only two of the 16 testis samples could detect a very small amount of DNA on days 7 and 14. The most important thing was that plasmids were cleared from almost all organs (heart, liver, spleen, lung, kidney, stomach, blood, thymus, intestine) on day 49. In summary, the results of our experiments demonstrate that the DNA vaccine delivered by electroporation was shown to be safe and merits further development for cancer treatment.
INTRODUCTION
Cancer has become a global disease that seriously threatens human survival, health, and quality of life. 1,2 In the past few decades, a variety of cancer treatment methods have been developed, mainly including surgical treatment, radiotherapy, chemotherapy, and immunotherapy. 3 –5 Among them, tumor vaccines represent a smart and promising treatment method to cancer immunotherapy, especially DNA vaccines, which have attracted widespread attention. 6 –10 Compared with other methods, DNA vaccines have the advantages of no risk of infection, high reagent stability, and relatively low production costs. 11,12 In our previous studies, a DNA vaccine (CpDV-IL2-sPD1/MUC1 and survivin [MS]) encoding MS gene sequences as well as the immune adjuvant IL-2, sPD1, and CpG motif was constructed and provided excellent antitumor effect. 13 –15 Among them, we used two tumor-associated antigens (TAAs), MS, which are highly expressed in various tumor types and used as targets of cancer treatments.
Common side effects of vaccines include local reactions at the vaccination site, inflammation, allergy/hypersensitivity reactions, hepatotoxicity, and so on; in particular, the risk of random genomic integration, which can lead to cancer. To improve uptake and immunogenicity, electroporation was used to deliver the vaccine. 16,17 Electroporation is a promising nonviral approach that has been widely used for gene delivery, especially in cancer vaccine. 18,19 However, the significant increase in the effect of electroporation has raised concerns about the safety and biodistribution of the vaccine, especially the risk of plasmid integration into the host genome. 20,21 According to the vaccine regulations by both Food and Drug Administration (FDA) and China Food and Drug Administration (CFDA), pharmacokinetic studies of any newly developed DNA vaccine must be performed before the clinical trial. These include persistence, biodistribution, integration risk, and so on. 22 –24
Therefore, we established and verified the QPCR method, The QPCR assay has a linear range of detection from 102 to 109 copies per reaction and is performed with high efficiency (slope = −3.36, R 2 = 0.999, efficiency = 98.4%). The assay was reproducible with low interassay and intra-assay. By QPCR assay, we analyzed the biodistribution and pharmacokinetics of plasmid DNA in different organs.
The tissue distribution results showed that the DNA was detectable at the injection site, lymph nodes, and blood on the first day after vaccination. On days 7 and 21, small amounts of plasmids were found in some mice's heart, liver, lungs, kidney, and so on. By 49 days, plasmids have been cleared from almost all tissues. It indicates that the vaccine can be quickly cleared by tissues after injection.
This trial demonstrates the safety, biodistribution, and pharmacokinetics of electroporation delivered vaccines, as well as the risks of genomic integration, and will be of great help to clinical trial application in the future.
MATERIALS AND METHODS
Preparation of DNA vaccines
The DNA vaccines (CpDV-IL2-sPD1/MS) were constructed as previously described. 13 In brief, it has been constructed in the double-cistron–expression-vector, with two TAAs survivin and MUC1 gene sequences and immune adjuvant SPD1, IL-2, and CpG motif. The plasmid was purified using a Qiagen Maxi purification kit (Qiagen, Hilden, Germany) to yield an endotoxin-free plasmid. The concentration of the extracted plasmid was measured with NANODROP 2000 system (Thermo Fisher Scientific, Waltham, MA). The plasmid copy numbers (copies/μL) were determined according to the formula: (concentration of plasmids [ng/μL] × 6.02 × 1,023)/(109 × length of genome [bp] × 660 Da/bp). Tenfold dilution of CpDV-IL2-sPD1/MS was prepared and stored at 4°C.
Mice models and tissue collection
BALB/c mice (16 animals of each sex) or control (0.9% sodium chloride, 8 animals of each sex) were intramuscularly injected with the plasmid (10 mg/kg) to skeletal muscle of both hind limbs on day 0 by electroporation (TERESA, Shanghai, China).
During the study, the animals were observed twice a day (morning and afternoon) for general well beings. Mortality and clinical signs were followed and any deviations from normal were recorded. Check regularly for changes in skin and hair, eyes, and mucous membranes, and monitor weight changes. Eight animals in the experimental group and four animals in the control group (half male and half female) were euthanized after 1, 7, 21, and 49 days of exposure to carbon dioxide (CO2). Tissue samples for studying biodistribution (using QPCR analysis) were collected and macroscopic signs were recorded at the same time, at the necropsy. The tissues collected include muscle, gonads (ovaries or testes), heart, liver, spleen, lung, kidney, lymph nodes, and other tissues; quick freezing was done with liquid nitrogen and stored at −70 to −80°C.
All animal experiments in this study were approved by the Ethics Committees of Shandong Xinbo Pharmaceutical R&D and conducted in accordance with the Guide for the Care and Use of Laboratory Animals (National Institutes of Health).
Extraction of gDNA from the tissue samples
The genomic DNA was purified according to the TaKaRa MiniBEST Universal Genomic DNA Extraction Kit Ver.5.0 (TaKaRa, Dalian, China) protocol. The DNA was eluted in 50 μL ddH2O. The DNA concentrations as well as the absorbance ratio (A260/280), which was measured to determine the purity of the samples, were determined with a NANODROP 2000 system (Thermo Fisher Scientific).
Optimization and establishment of standard curves
Based on the nucleotide sequence of CpDV-IL2-sPD1/MS, several pairs of specific primers were designed according to the sequence characteristics. By analyzing the results of the QPCR reaction, the optimal primers and temperatures were selected to determine the optimum primer concentration—tenfold serial dilutions of CpDV-IL2-sPD1/MS, ranging from 1 × 10² to 1 × 10⁹ copies/μL. The prepared CpDV-IL2-sPD1/MS plasmid was used as a template in SYBR Green I-based QPCR reactions. Each reaction was of 20 μL and contained 10 μL 2 × SYBR Premix Ex TaqTM Tli RNaseH Plus (TaKaRa), 200 nM of the forward primer, 200 nM of the reverse primer, 1.0 μL of DNA plasmid, and an appropriate volume of ddH2O to obtain a total volume of 20 μL.
The reaction consisted of an initial activation step of the 30 s at 95°C, 40 cycles of denaturation step of 5 s at 95°C, and an annealing step of 30 s at 60°C. Each reaction was repeated three times. Negative control (no template control [NTC]) was included in all runs. The QPCR was performed in the CFX96 real-time PCR detection system (Bio-Rad) and Light Cycler 96 (Roche Diagnostics Gmbh, Mannheim, Germany).
Validation of QPCR assay
To test the specificity of the method, the established SYBR Green I QPCR was used to simultaneously detect mouse genomic DNA (noninoculated), CpDV-IL2-sPD1/MS, and ddH2O to confirm the specificity of this technique. Next, the products were checked using electrophoresis in 1% agarose gels in 1 × TAE buffer. Further, to validate the reproducibility of this assay, The CpDV-IL2-sPD1/MS plasmid at concentrations of 102–109 copies/μL was used as a template to detect the reproducibility of the assay according to the optimized system. The reactions were tested in three independent reactions to assess the intra-assay and interassay standard deviations (SDs) and the repeatability and stability of the method. Interassay and intra-assay variations were determined from the mean cycle threshold values (Ct), SD, and coefficient of variations of each plasmid DNA dilution (102–109 copies per reaction).
The accuracy of the method was determined by the recovery calculated by adding 100 ng mouse genomic DNA (noninoculated). The acceptable range of this assay was as follows: intra-assay precision of <5%, interassay precision of <10%, and the accuracy of 50–150%.
QPCR analysis genomic
Genomic DNA samples from mice were analyzed using a validated QPCR method. To calculate plasmid copy number per μg DNA, standard samples of CpDV-IL2-SPD1/MS plasmid were prepared with DNA extracted from naive mice (range 102–109 copies per reaction) and run on the same PCR plate as the corresponding biodistribution samples.
Statistics were performed with GraphPad Prism software.
RESULT
General safety
All animals survived well during the experiment, and no abnormal clinical signs were observed during the study. No changes were observed in skin, hair, eyes, and mucous membranes. The animals were breathing normally and no changes in respiratory organs were observed at autopsy. The animal's body movement and behavior were normal, indicating that there were no changes in autonomic and central nervous systems. To further determine the safety of the vaccine, we doubled the vaccine dose and the mice remained in good condition. Assessments of weight change after immunization showed weight gain in both vaccinated and control animals (Fig. 1A, B); although there was a slight weight loss in female mice on day 14 in the immunized group, there was no significant difference.
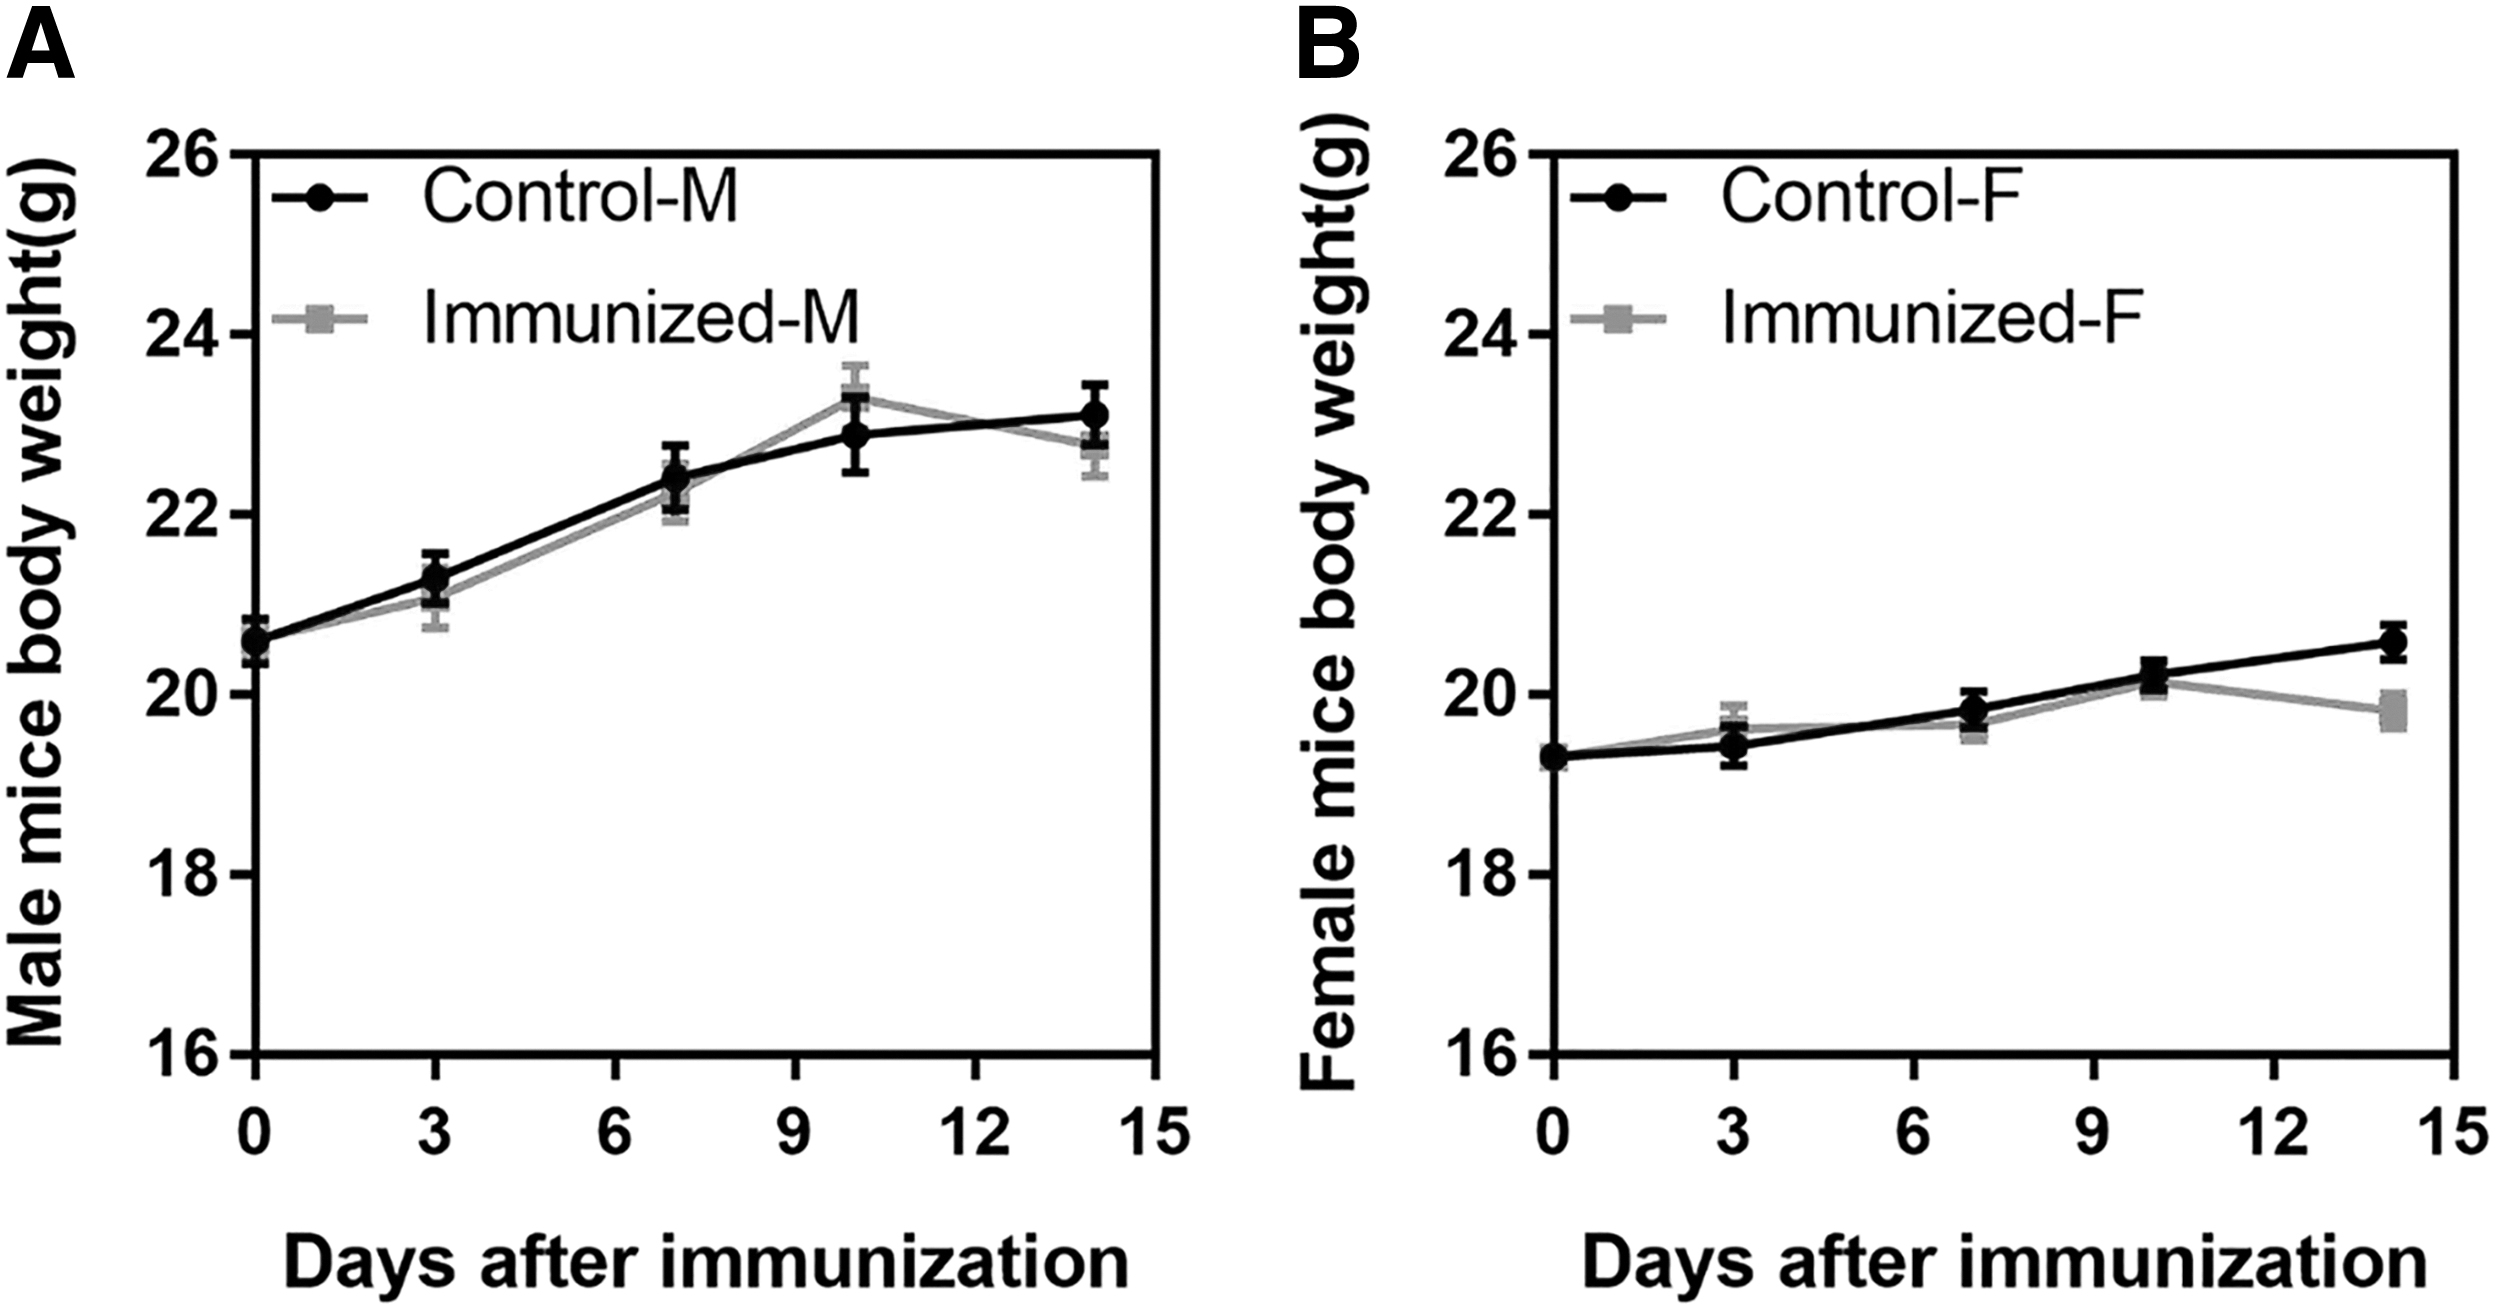
Body weight changes of immunized mice. Mice were intramuscularly injected with DNA vaccine (20 mg/kg) or saline by electroporation on day 0. Body weight changes of male mice
Construction of the SYBR Green I QPCR standard curve
Multiple pairs of specific primers were designed according to the sequence characteristics, and one pair was selected according to the reaction results (Supplementary Table S1), which had no primer-dimer and good amplification efficiency (data not shown). The CpDV-IL2-sPD1/MS was diluted serially in concentrations ranging from 102 to 109 copies/μL, and used for SYBR Green I QPCR. The QPCR amplification curve was constructed under optimal conditions. The Ct value linearly correlated with the logarithm of plasmid copy number (R 2 = 0.999) (Fig. 2A); the correlation stand curve equation was Y = −3.360 × +38.185 (Fig. 2A), and the amplification efficiency (E) was 98.4%. A standard curve slope between −3.6 and −3.1 and E between 90% and 110% with an R 2 above 0.98 is considered acceptable for most QPCR assays.
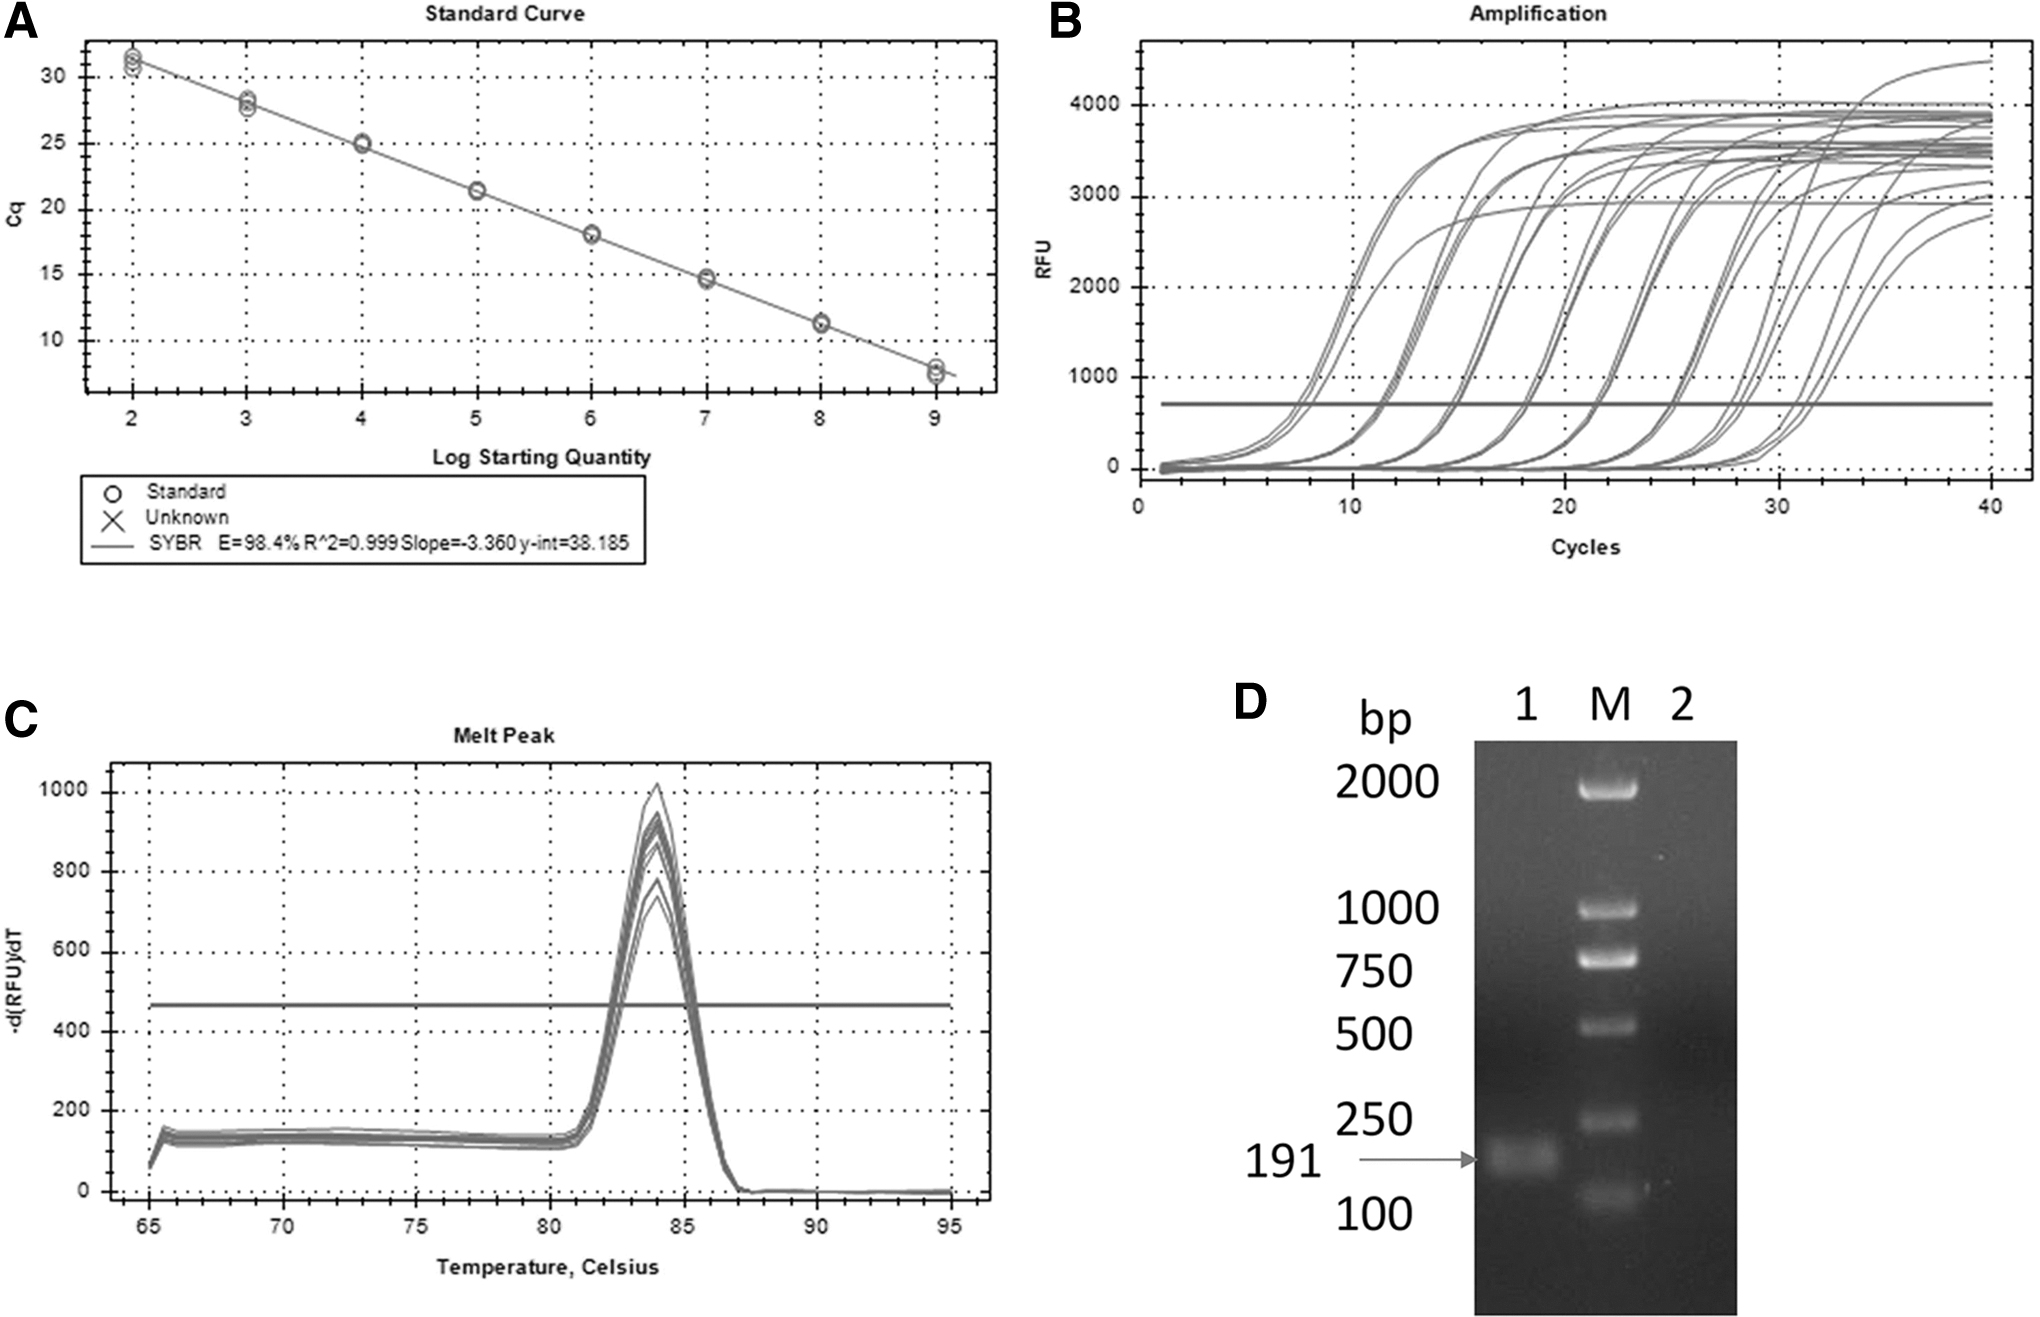
Construction of the standard curves for absolute quantification of plasmid CpDV-IL2-sPD1/MS.
The amplification plots of plasmid at different concentrations are represented (Fig. 2B) and the melt peak temperature was 84.0°C (Fig. 2C) The melt curve analysis was performed to identify the fragment's melting temperature and to detect the presence of nonspecific products. The results showed that the primer amplification was good, no primer dimer, and nonspecific products were produced. The QPCR-amplified products were run on a 1% agarose gel in 1 × TAE electrophoresis buffer (Fig. 2D). There was a band between 100 and 250 bp, consistent with the designed 191 bp amplification (Lane 1), and there were no amplification products in NTC (Lane 2), these results were consistent with the expectation.
Specificity of the SYBR Green I QPCR
We used mouse genomic DNA to verify the specificity of the SYBR Green I PCR. In addition, CpDV-IL2-sPD1/MS was used as a positive control, and ddH2O was used as a negative control (NTC). Only the CpDV-IL2-sPD1/MS group demonstrated a high-intensity fluorescent signal with a Ct value lower than 35 (Fig. 3A). Mouse genomic DNA and the negative control did not show specific amplification. Next, the products were checked using electrophoresis in 1% agarose gels in 1 × TAE buffer (Fig. 3B). The size of the plasmid amplification product was consistent with the design 191 bp (Lane 3), and there were no amplification products in water and genome (Lane 1 and 2).
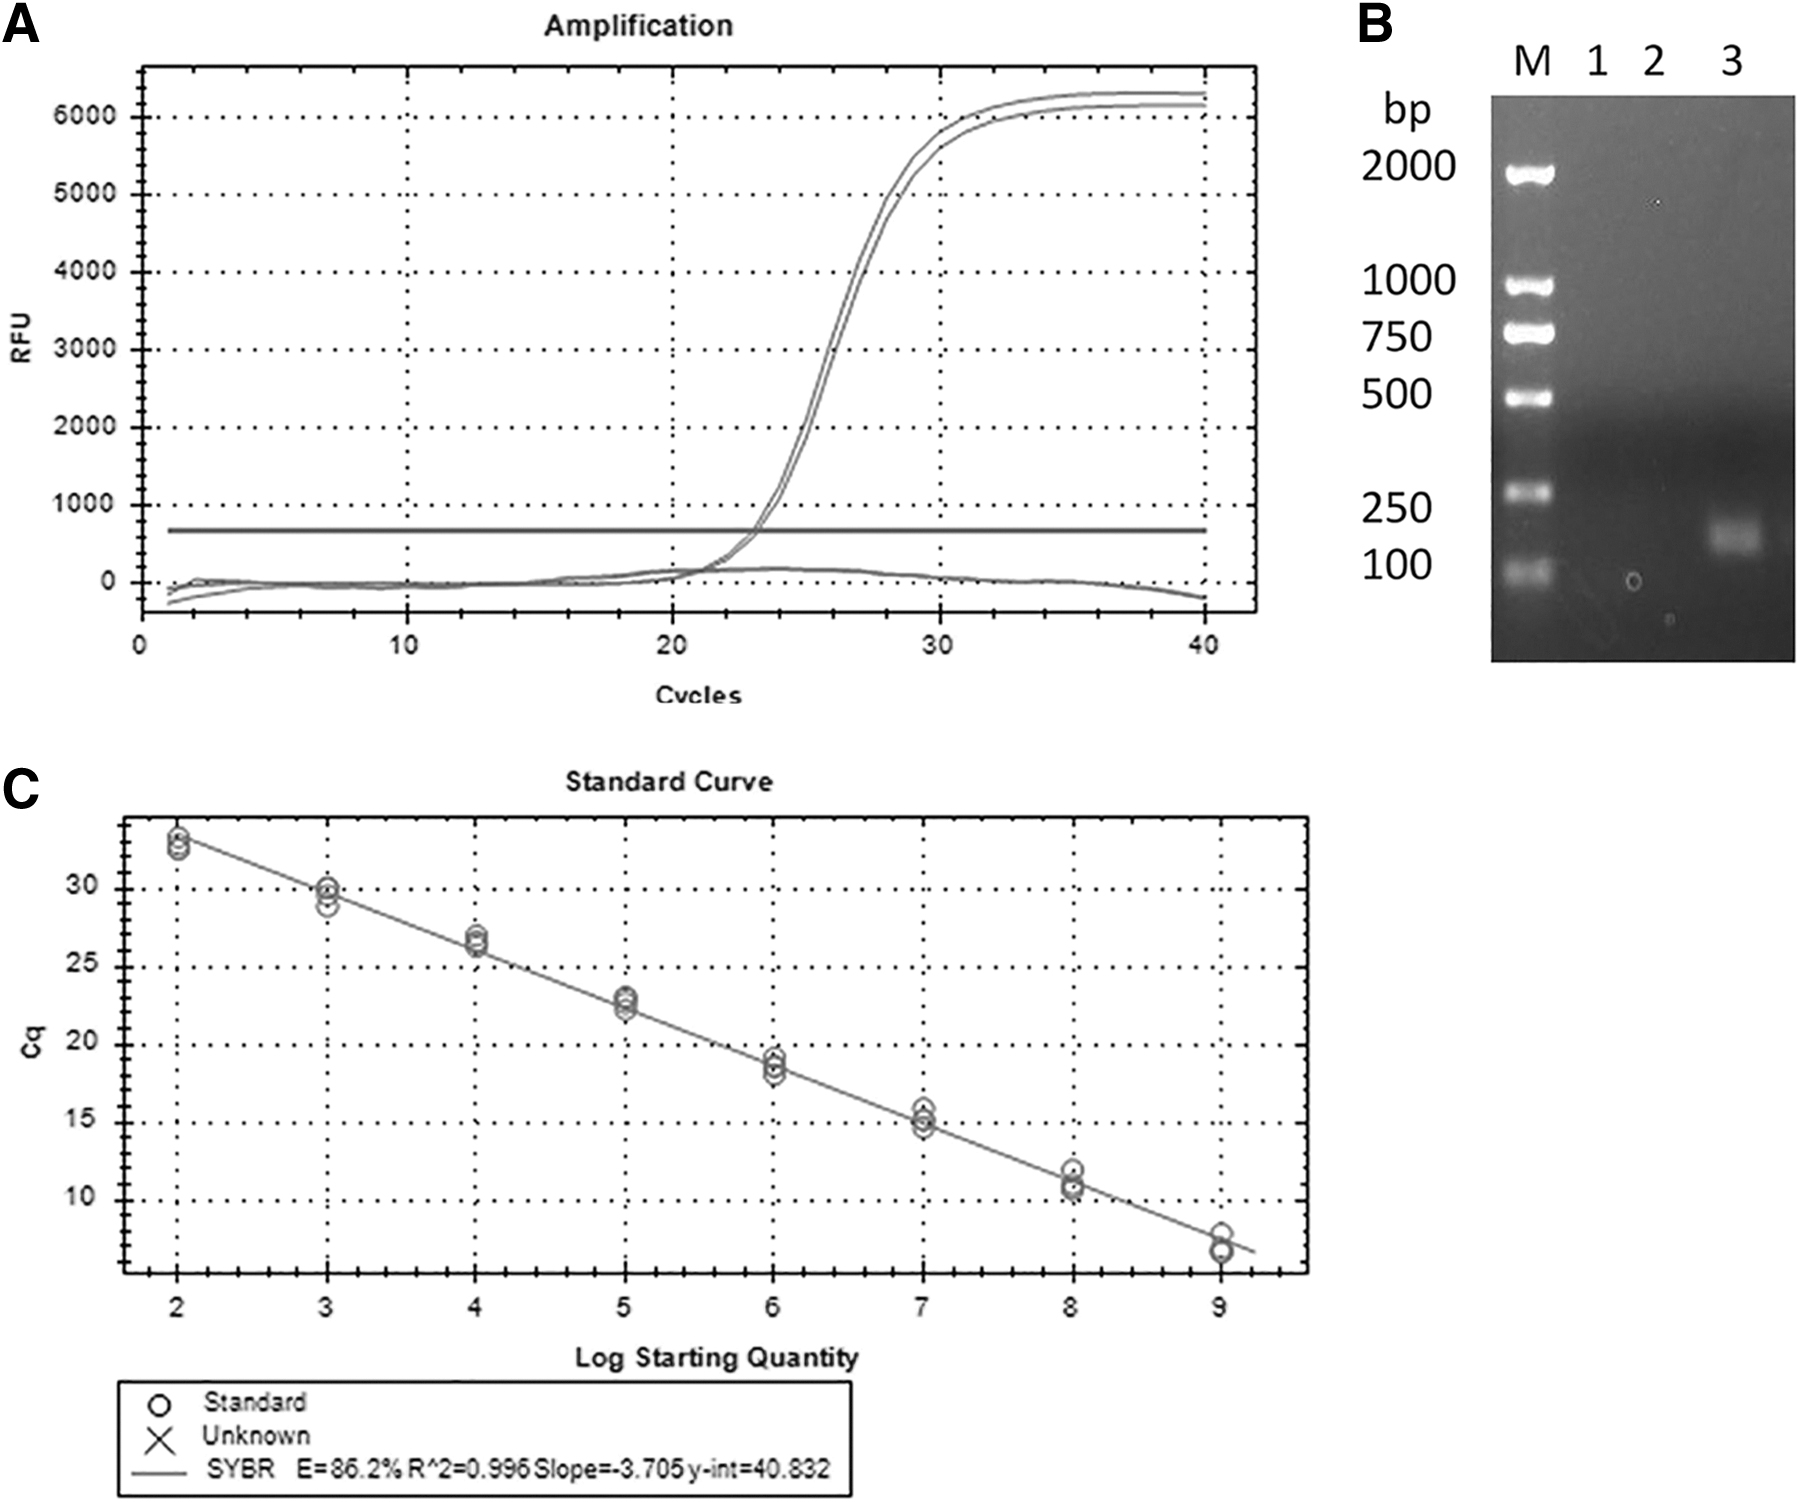
Validation of the QPCR method.
Therefore, the SYBR Green I QPCR established in the study is highly specific.
PCR inhibition caused by gDNA matrix
Considering the influence of background nucleic acids on plasmid amplification, we need to further explore the amount of gDNA that can be added. The inhibiting effect of the gDNA matrix on the amplification efficiency of QPCR has been mentioned in previous studies. 25 The amount of gDNA input is a major determinant. When the amount of gDNA input exceeds the threshold, the amplification efficiency will be reduced and the Ct value will be increased. Different amounts of mouse gDNA input (varying from 100 to 400 ng) extracted from the liver in the same volume were spiked with 105 copies of CpDV-IL2-sPD1/MS for QPCR analysis to monitor the PCR inhibition due to the presence of the gDNA matrix (Supplementary Table S2). When input 400 ng gDNA, the Ct value was 21.7, significantly higher than 20.12, indicating that the addition of 400 ng gDNA had an inhibitory effect on plasmid amplification.
Previous studies and our experiment demonstrated that the plasmid copies spiked into 100 ng gDNA produced nearly the same Ct value as without gDNA (Supplementary Table S2). Therefore, in the following experiments, we set the gDNA input amount to 100 ng.
Accuracy of the QPCR method
To further investigate the effect of the gDNA matrix on the amplification efficiency, we generated standard curves of plasmid CpDV-IL2-sPD1/MS (ranging from 102 to 109 copies/reaction) in the presence of 100 ng gDNA from liver tissue, and other tissues showed similar results (Fig. 3C). The slopes of standard curves generated in these experiments were between −2.98 and −3.53 (E = 100 ± 20%), and the R 2 values were above 0.98. The accuracy was 70–130% (Table 1).
Intra- and interassay variability in cycle threshold values for the QPCR assay
Using an eight-point standard curve from 1 × 10² to 1 × 10⁹ target copies per reaction.
CV, coefficient of variations; SD, standard deviation.
Reproducibility of QPCR method
Three measurements were done for intra-assay and inter-assay variability. The intra-assay and the inter-assay coefficients of variation (CV%) ranged from 0.24% to 1.79% and 0.06% to 2.87%, respectively (Table 2). It achieved low intra-assay and interassay variability. These results indicated that the QPCR method is reproducible and robust.
Accuracy of the SYBR Green I QPCR
Using an eight-point standard curve from 1 × 10² to 1 × 10⁹ target copies per reaction.
Biodistribution and quantification of plasmids in tissues
The QPCR analysis of the animals showed that plasmid DNA was present in the injection site (muscle) of all eight animals after 1 day of administration. The level of plasmid DNA decreased over time but at the end of the experiment, only one of the eight mice still had plasmid DNA at the injection site (Fig. 4A). For reproductive organs, no plasmids existed in the ovary at any time point. On days 7 and 21, only one of the eight samples was detected, respectively (Fig. 4B).
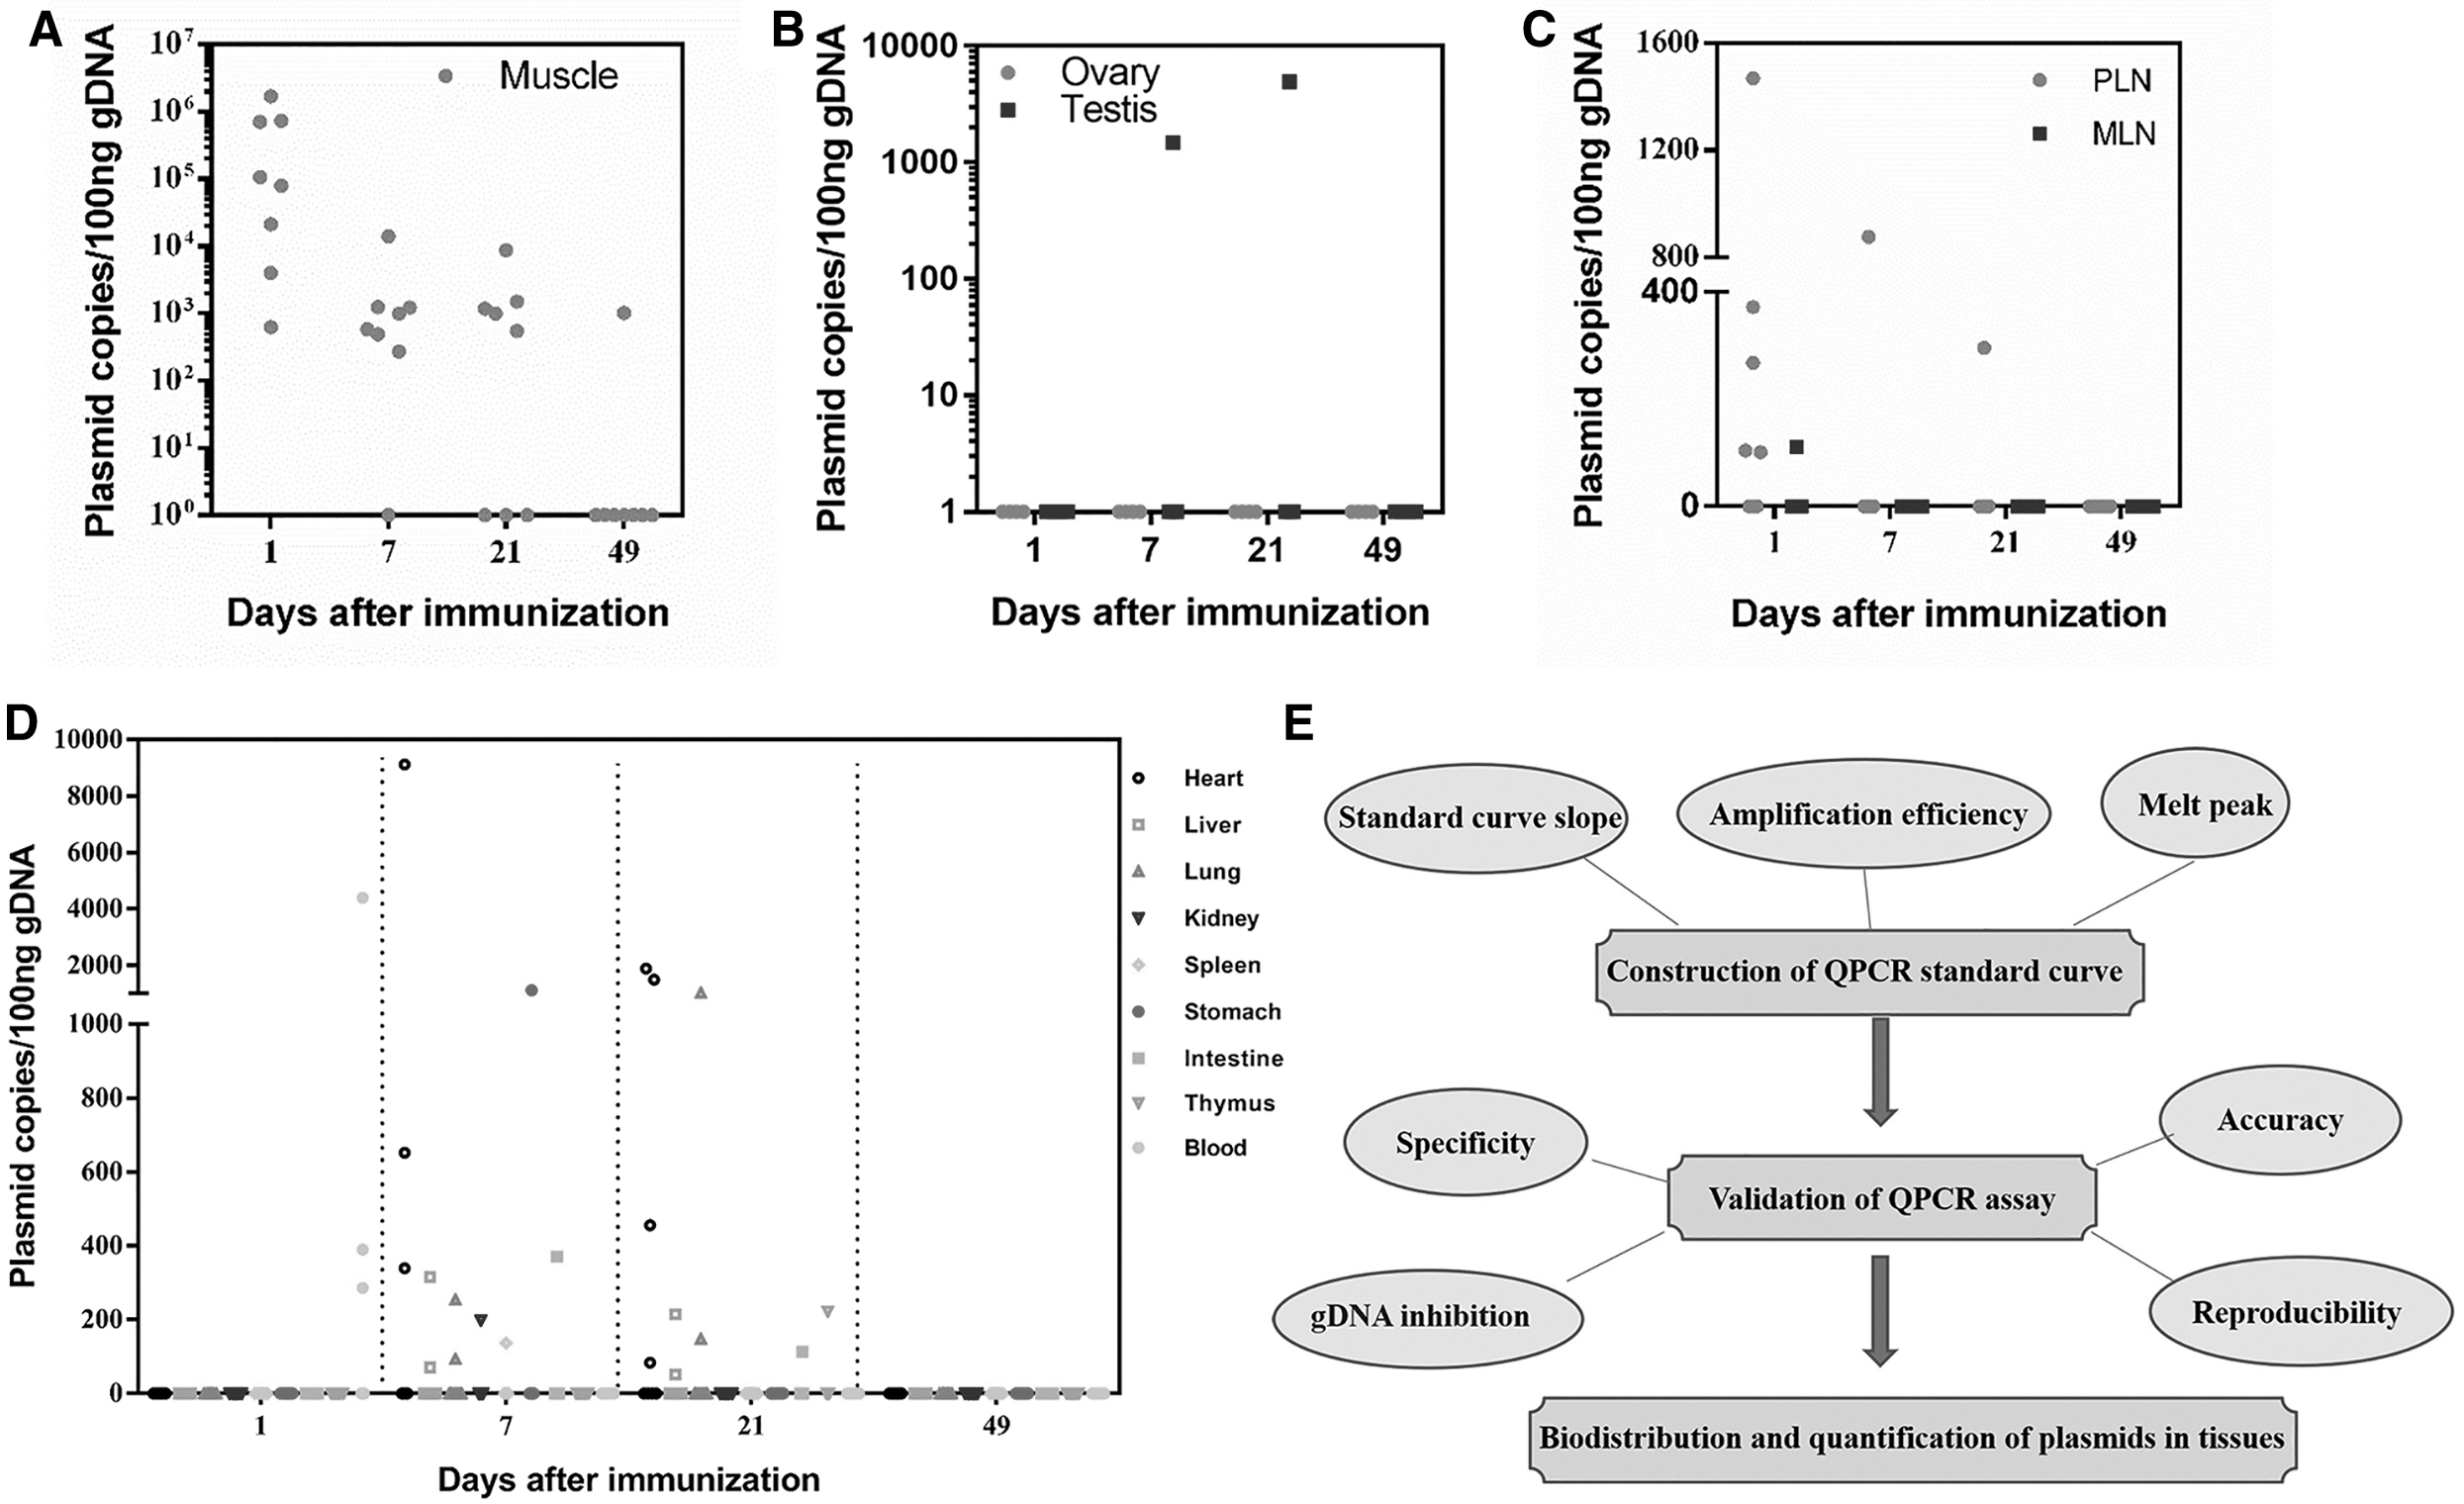
Biodistribution and persistence of plasmid. Mice were intramuscularly injected with DNA vaccine (10 mg/kg) by electroporation, mouse genome was extracted and subjected to QPCR assay detecting the plasmid. Results are shown as several copies of plasmid/100 ng of extracted gDNA at 1, 7, 21, and 49 days after immunization.
We also analyzed the lymph nodes at day 1, and plasmid DNA was detected in the popliteal lymph node (PLN) of the most analyzed animals, but only one animal was detected in the mesenteric lymph node. Only a small amount of plasmid DNA was detectable from one animal on days 7 and 21. At 49 days, plasmid DNA was no longer detectable from the PLNs (Fig. 4C).
On day 1, plasmids were not detectable in the heart, liver, spleen, lung, kidney, and stomach. However, plasmids in the blood can only be detected on the first day. At days 7 and 21, some amounts of plasmids can be detected in the heart, liver, spleen, lungs, kidneys, and stomach but almost no more than 1,000 copies/100 ng gDNA. On day 49 after immunization, Plasmids are eliminated from almost all organs (Fig. 4D). A schematic diagram showing the experimental procedure is shown in Fig. 4E.
DISCUSSION
DNA vaccines have been developed and evaluated in clinical trials for the prevention against, or treatment of, many different infectious diseases and cancers. 26 –29 We previously developed the DNA vaccine (CpDV-IL2-sPD1/MS), which showed excellent antitumor effects in a variety of tumor models. 13,14 In our experiment, electroporation was used to enhance the transfection efficacy and the immunogenicity of vaccines in animal models. 30 However, the improvement in delivery efficiency brought about by electroporation has raised concerns about its safety and the potential for plasmid DNA integration into the host genome. 31,32
In this study, we investigated the general safety, Pharmacokinetics, and biodistribution of a naked plasmid DNA immunized by electroporation in a BALB/c mice model. All mice reached the end of the study with good body conditions. No obvious clinical symptoms and abnormal changes in body weight were observed in the animals after treatment, and no abnormality was found in the animal autopsy after the test. Tissue samples were collected at the necropsy at 1, 7, 21, and 49 days after injection.
To analyze the biodistribution and Pharmacokinetics in mouse tissues after injection of tumor gene vaccine, a real-time quantitative PCR specific for the detection of plasmid CpDV-IL2-sPD1/MS in DNA extracts has been developed. The detection limit of our study was 10 copies/μg of gDNA in all tissues tested, which meets regulatory guidelines. In the USA, FDA guidelines stipulate a QPCR detection limit for DNA vaccine of <100 copies/μg of host DNA. 33 The QPCR assay has a linear range of detection from 109 to 102 copies per reaction and is performed with high efficiency and good repeatability.
We found that plasmid DNA was indeed rapidly cleared from all organs except the site of the injection (muscle), as had been reported by others. 20,31 Most importantly, few plasmids were found in the testis and ovaries probably due to the considerable interindividual variability. Importantly, FDA considers integration studies to be necessary only if the plasmid persists in tissue at levels exceeding 30,000 copies per μg of host DNA by study termination. So, there is no evidence of plasmid integration into the genome. 30,34,35
In summary, electroporation in vivo enhances transfer of DNA vaccines to the muscle, and other tissues resulting in high levels of expression, often with strong immune response and clinical benefits. However, it remains unclear whether DNA vaccines are a viable technology for human use because of safety concerns about the possibility of integration of foreign genetic material. Our experiments prove that the plasmid was rapidly cleared from most tissues (excluding muscle) in mice within about 49 days of electroporation administration at a dose of 200 μg DNA vaccine. Importantly, there was no evidence that the plasmid integrated into the host genome. These results strongly support the further clinical development of CpDV-IL2-sPD1/MS as a therapeutic vaccine for tumor treatment.
Footnotes
AUTHORs' CONTRIBUTIONS
H.Z., W.K., H.W., J.W., and X.Y. designed and supervised the study. L.D., C.L., Y.Z., and S.X. designed primers, established and validated of QPCR method, and performed DNA extraction and detection. L.D., M.F., Y.Q., K.Z., and Z.C. wrote the article.
AUTHOR DISCLOSURE
No competing financial interests exist.
FUNDING INFORMATION
This research was supported by the Key R&D Projects of Science and Technology Department of Jilin Province, China (grant no. 20180201001YY), the National Science and Technology Major Project of the Ministry of Science and Technology of China (grant no. 2014ZX09304314-001), and Projects of Science and Technology Department of Jilin Province, China (grant no. 20210101249JC).
SUPPLEMENTARY MATERIAL
Supplementary Table S1
Supplementary Table S2
References
Supplementary Material
Please find the following supplemental material available below.
For Open Access articles published under a Creative Commons License, all supplemental material carries the same license as the article it is associated with.
For non-Open Access articles published, all supplemental material carries a non-exclusive license, and permission requests for re-use of supplemental material or any part of supplemental material shall be sent directly to the copyright owner as specified in the copyright notice associated with the article.