
Abstract
This study was aimed to analyze the diagnostic, therapeutic, and prognostic value of the suppressor of cytokine signaling 3 (SOCS3) in pancancer, especially in esophageal carcinoma (ESCA), and investigate the role of SOCS3 in the tumorigenesis and progression of ESCA. We used a variety of bioinformatics methods to explore the expression of SOCS3 in 33 kinds of cancers and evaluate its potential role in the pathogenesis, prognosis, immune microenvironment, immune evasion, and therapeutic response of cancers. The results indicated that SOCS3 was upregulated in 10 cancers, downregulated in 12 cancers, and upregulated in ESCA. Mutation and amplification were the main causes of abnormal expression of SOCS3 in pancancer. In ESCA, expression of SOCS3 was negatively correlated with methylation. The analysis showed that ESCA patients with low SOCS3 levels had better overall survival. Furthermore, the SOCS3 level was positively related to the ESTIMATE score, immune score, stromal score, and negatively related to tumor purity. In ESCA, a significant association was found between SOCS3 and several immune checkpoint genes. In addition, SOCS3 was associated with sensitivity to 59 drugs. Next, the role of SOCS3 in ESCA was investigated in ECA109, EC9706 cells, and in xenografted mouse model. SOCS3 was confirmed to be upregulated in ESCA cells. Knockdown of SOCS3 decreased the proliferation, migration, and invasion of ESCA cells while increasing apoptosis. Meanwhile, downregulation of SOCS3 activated the nuclear factor kappa-B signaling pathway and inhibited ESCA tumorigenesis in vivo. In conclusion, high SOCS3 expression is closely related to the occurrence and progression of ESCA and can be used as a therapeutic target and prognostic biomarker for ESCA.
INTRODUCTION
Esophageal tumors are a set of diverse neoplasms involving mucosal and submucosal tissue layers. WHO statistics indicate that esophageal carcinoma (ESCA) is the ninth most prevalent malignancy and the sixth most common cancer-related death globally. 1 The treatment efficacy for cancer is affected by various factors, such as histological features, lesion size, and anatomical stage. Despite advances in surgery and radiotherapy, within the age group of 40–65 years, the incidence of ESCA has increased in recent years. 2 Therefore, it would be necessary to explore further estimations and molecular biomarkers for prevention plans, control, and treatment strategies.
Suppressor of cytokine signaling 3 (SOCS3) is a member of the SOCS family, which negatively regulates a variety of cytokines and their signaling pathways and ultimately affects cell proliferation, apoptosis, and other biological processes (BP). 3 In total, eight members were involved in the SOCS family, including cytokine-inducible SH2 protein and SOCS-1 to SOCS-7. 4 Studies have shown that the expression of SOCS3 is significantly decreased in lung cancer, 5 gastric cancer, 6 pancreatic cancer, 7 ovarian cancer, 8 and other types of solid tumors and is significantly associated with poor prognosis. Overexpression of SOCS3 can inhibit the proliferation of these tumor cells and promote apoptosis by negatively regulating the activity of the JAK-STAT signaling pathway, suggesting that SOCS3 may be a tumor suppressor. 5 –8
However, in contrast, SOCS3 has been found to be overexpressed in glioblastoma, and the downregulation of SOCS3 expression can increase the radiosensitivity of glioblastoma. 9 In addition, the positive proportion of SOCS3 in astrocytoma tissues is up to 92.4%, and its expression level is positively correlated with histological grade and degree of necrosis. 10 These studies suggest that the expression levels of SOCS3 in different tumors may be diverse and regulate tumor progression through different pathways. At present, the role of SOCS3 in ESCA has not been illustrated. Therefore, it is necessary to conduct systematic studies on SOCS3 to clarify its role in tumor progression and its possible mechanism.
In this study, we aimed to analyze the role of SOCS3 in different cancers, especially ESCA, through bioinformatics analysis. In addition, in vitro and in vivo experiments were conducted to evaluate the effect of SOCS3 on the tumorigenesis and progression of ESCA. Moreover, the potential effect of SOCS3 on the nuclear factor kappa-B (NF-κB) signaling pathway was determined. In general, this research suggests that SOCS3 might be a potential therapeutic target and prognostic biomarker for ESCA.
MATERIALS AND METHODS
Data sources and differential analysis
The RNA-sequencing data of pancancers were downloaded from databases, including The Cancer Genome Atlas (TCGA), Genotype-Tissue Expression (GTEx), and Cancer Cell Line Encyclopedia (CCLE), based on the UCSC Xena platform (
Mutation analysis
The cBioPortal tool is an open resource, 13 and the distribution and mutation rate of SOCS3 in different exons involved in TCGA pancancer data were analyzed. Moreover, the association of the gene mutation and copy number aberrations (CNA), methylation, and mRNA transcription was investigated, and all results were visualized via the R “ggplot2” package.
Clinical correlation analysis
All involved tumor patients were divided into high- and low-expression groups divided by the mean expression level of SOCS3. After that, the survival curves for the two groups were further created using the “survminer” and “survival” packages in R statistics software. When p < 0.05, we defined that the difference between the two groups was statistically significant.
Enrichment analysis
To explore the potential role of SOCS3 in ESCA, the genes coexpressed with SOCS3 were explored using the cBioPortal database and Multi-Experiment Matrix (MEM). Furthermore, gene set enrichment analysis (GSEA) was performed, and the analysis included Kyoto Encyclopedia of Genes and Genomes (KEGG) pathway, 14 Gene Ontology (GO) functional analysis, and reactome using clusterProfiler in the R package. GO is organized into three categories with partially overlapping, including molecular functions, BP, and cellular components.
Immune infiltration analysis
Immune Cell Abundance Identifier (ImmuCellAI) is a tool for estimating the abundance of 24 immune cell types based on gene set signature. 15 The association of SOCS3 and immune cell types was evaluated by this tool. Four types of scores were evaluated in immune ingredient proportion analysis using ESTIMATE (R script package), including StromalScore, Tumor Purity, ESTIMATE Score, and ImmuneScore. 16 Pearson correction analysis was performed to investigate the association of immune ingredients in ESCA and SOCS3 expression levels. Furthermore, the association was visualized using the “ggplot2” package. Meanwhile, the correlation between SOCS3 and immune cell infiltration, major histocompatibility complex (MHC), immunosuppressive genes, chemokines, and chemokine receptors across cancers was also calculated using the “ggplot2” package. Correlations between SOCS3 and immune cell infiltration and immune checkpoint-related genes in ESCA were analyzed and visualized by Spearman correlation using the “circlize” package. 17
Drug sensitivity analysis
To explore the drugs affecting SOCS3 expression levels, the Genomics of Drug Sensitivity in Cancer (GDSC) database was used in the study, which is a public resource providing drug sensitivity information in cancer cells. 18 Furthermore, the Spearman correction coefficient was used to assess the association of SOCS3 and drug sensitivity based on data from the GDSC database. p < 0.05 was defined as the threshold for assessing statistical significance.
Cell culture
HEEC (RRID: CVCL_0F63), TE-1 (RRID: CVCL_1759), EC9706 (RRID: CVCL_E307), and ECA109 (RRID: CVCL_6898) cells were purchased from the Type Culture Collection of the Chinese Academy of Sciences (Shanghai, China) and routinely cultured in Dulbecco's modified Eagle's medium (Invitrogen, Carlsbad, CA, USA) supplemented with 10% fetal bovine serum (Life Technologies, Gaithersburg, MD, USA) in a humidified cell incubator at 37°C with 5% CO2. All cell lines were certified by professional identification institutions and were identified without mycoplasma contamination.
Quantitative real-time-PCR
The expression levels of SOCS3 in three human ESCA cell lines (EC9706, ECA109, TE-1) were analyzed to investigate the role of SOCS3 in ESCA, and human normal esophageal epithelial cells (HEEC) was used a control.
First, total RNA was isolated using the TRIzol® Plus RNA Purification Kit (Invitrogen, Carlsbad, CA, USA). After measuring the quality of RNA, quantitative real-time‒PCR was performed following previously published data. 19 cDNA was first obtained using 500 ng of total RNA. Then, real-time PCR was performed using SYBR Green PCR Master Mix on a Step One Plus Real-Time PCR System (Applied Biosystems, Carlsbad, CA, USA). GAPDH was used as a housekeeping gene, and the target gene expression levels were normalized. The comparative CT method (2−△△CT) was adopted to calculate the expression level of the gene. Primers were synthesized by Sangon Biotech (Shanghai) Co., Ltd. The primer sequences were as follows: SOCS3 Forward: 5′-AGACAGTAGGTCGACTTGTA-3′, Reverse: 5′-GAAGATGTGCATCGTCAGAG-3′; GAPDH Forward: 5′-AGGACATGATGACCTCCTGAACT-3′; Reverse: 5′-TGTAATTGTAAGTATCTTGGTGCCT-3′.
Western blot assay
The cells were first lysed, and the concentration of total protein was quantified by using a BCA kit (Beyotime, Shanghai, China). Then, 20 μg of protein from each sample was injected into the sample hole and separated by 10% sodium dodecyl sulfate–polyacrylamide gel electrophoresis. The separated protein was then transferred to a polyvinylidene difluoride (PVDF) membrane and incubated with 5% milk for 1 h at room temperature. After that, PVDF was incubated with rabbit polyclonal antibodies at 4°C overnight. All antibodies used in this research were purchased from Proteintech (Chicago, USA). The catalog number and dilution rate of the primary antibodies were as follows: anti-SOCS3 (14025-1-AP; 1:2,000), anti-NF-κB p65 (10745-1-AP; 1:1,000), anti-p52 (15503-1-AP; 1:500), anti-p50 (15506-1-AP; 1:500), anti-inhibitor kappa B alpha (IKB-α) (10268-1-AP; 1:2,000), anti-tumor necrosis factor alpha (TNF-α) (26405-1-AP; 1:1,000), anti-glyceraldehyde 3-phosphate dehydrogenase (GAPDH) (10494-1-AP; 1:20,000), and anti-α-tubulin (11224-1-AP; 1:3,000). After washing, the PVDF membranes were incubated with horseradish peroxidase-conjugated goat anti-rabbit Immunoglobulin G (SA00001-2; 1:5,000) for 1 h at 37°C.
Finally, the membrane was visualized using the developer of enhanced chemiluminescence. The densitometric values of the bands were analyzed using ImageJ software, and each band was repeated three times. GAPDH and α-tubulin were designed as the controls.
Transfection and grouping
SiRNAs were designed and synthesized, and the detailed sequences of siRNAs were designed as follows: hSOCS3 siRNA-1 forward: 5′-3′: CCUGGACUCCUAUGAGAAATT; reverse: 5′-3′: UUUCUCAUAGGAGUCCAGGTT; hSOCS3 siRNA-2 forward: 5′-3′: CCAAGAACCUGCGCAUCCATT; reverse: UGGAUGCGCAGGUUCUUGGTC; hSOCS3 siRNA-3 forward: 5′-3′: AGAGCCUAUUACAUCUACUTT; reverse: AGUAGAUGUAAUAGGCUCUTC. SiCtrl forward: 5′-3′: GAUGACCAUAGUCGACUAAGC; reverse: UAGCAAGUAUUGCAGUACGAU. SiRNAs were transfected using Lipofectamine RNAiMAX (Invitrogen, Grand Island, USA) when 40% confluence was reached. In the analysis, negative control siRNA (siCtrl) transfection was set as the negative control group.
CCK-8 assay for cell proliferation detection
The cells in the logarithmic growth stage of each transfection group were inoculated for 24 h, 48 h, and 72 h and 96 h and 120 h. Then, 2 h before the end of culture at the corresponding time point, 10 μL CCK-8 solution was added to the corresponding well and continued to culture for 2 h in the incubator. Finally, cell proliferation was measured by a microplate reader (Tecan, Groedig, Austria) with absorbance at 450 nm, and each experiment was repeated three times.
Flow cytometry assay for cell apoptosis detection
An Annexin V-FITC/PI apoptosis assay kit was purchased from NeoBioscience Technology Co., Ltd. (Shenzhen, China). The cells at the logarithmic growth stage of each transfection group were inoculated and fused to 90%, and then, the cells were washed with precooled phosphate-buffered saline (PBS) three times, digested with EDTA-free trypsin, and collected by centrifugation. The cells were resuspended using binding buffer, and the cell density was adjusted to 5 × 10⁵/mL. Then, 195 μL of cell suspension was mixed with Annexin V-FITC and reacted in the dark for 10 min. Then, the cells were washed and stained with 5 μL propidium iodide (PI). Finally, the cells were detected using a flow cytometer (BD FACSCanto, New Jersey, USA).
Cell scratch assay for cell migration ability detection
To estimate the migration ability of tumor cells, a cell scratch test was designed. On the monolayer of adherent cells cultured in vitro, the central area of cell growth was scratched with a micropipette head. After removal of the central part of the cell, the cells were cultured for 0, 24, and 48 h. ImageJ software was used to analyze the scratch area. The migration index was calculated as follows: the migration index = the area of scratch reduction in the experimental group/the area of scratch reduction in the control group.
Transwell assay for cell invasion ability detection
A 200 μL cell suspension (5 × 10⁴ cells/well) was added to the upper chamber of the Transwell, and 600 μL complete medium containing 20% serum was added to the lower chamber. The plates were incubated in incubators at 37°C for 24 h, followed by medium removal in each well and cleaning of the lower surface of the chamber with PBS. The cells on the lateral side of the chamber were observed with inverted microscopes.
FACS-based PI measurement
For FACS-PI cell cycle analysis, cells were pelleted by centrifugation for 5 min at 1,000 rpm. After that, these cells were resuspended in 1 mL DNA staining solution [40 × PI (2 mg/mL): 100 × RNase (10 mg/mL): 1 × D-hanks = 25:10:1,000] and incubated for 15 min at room temperature. Then, the suspension was analyzed by flow cytometry.
In vivo assay for tumorigenesis
In total, 200 μL of ESCA cell suspension with stable SOCS3 siRNA (2E+7 cells) was subcutaneously injected into BALB/c nu/nu mice. After 2 weeks, the mice were euthanized by an overdose of 2% sodium pentobarbital. Cervical dislocation was further treated to confirm death. Then, the tumor volume was plotted. The animal experimental scheme of this study was approved by the Ethics Committee of Fujian Medical University Union Hospital.
Statistical methods
Data were analyzed as the means ± standard error of the mean using SPSS 19.0 (SPSS, Inc., IL, USA). Two-tailed Student's t tests were used to analyze the significant difference between two groups. Analysis of variance (ANOVA) was used to analyze the difference among three or more groups. A p-value <0.05 was defined as the threshold.
RESULTS
The expression levels of SOCS3 across different types of tumors
The expression levels of SOCS3 in TCGA, GTEx, and CCLE were analyzed (Fig. 1A–D). Compared with corresponding nontumor samples, dysregulated expression levels of SOCS3 were found in 22 types of cancers out of 33 kinds of cancers in TCGA database.
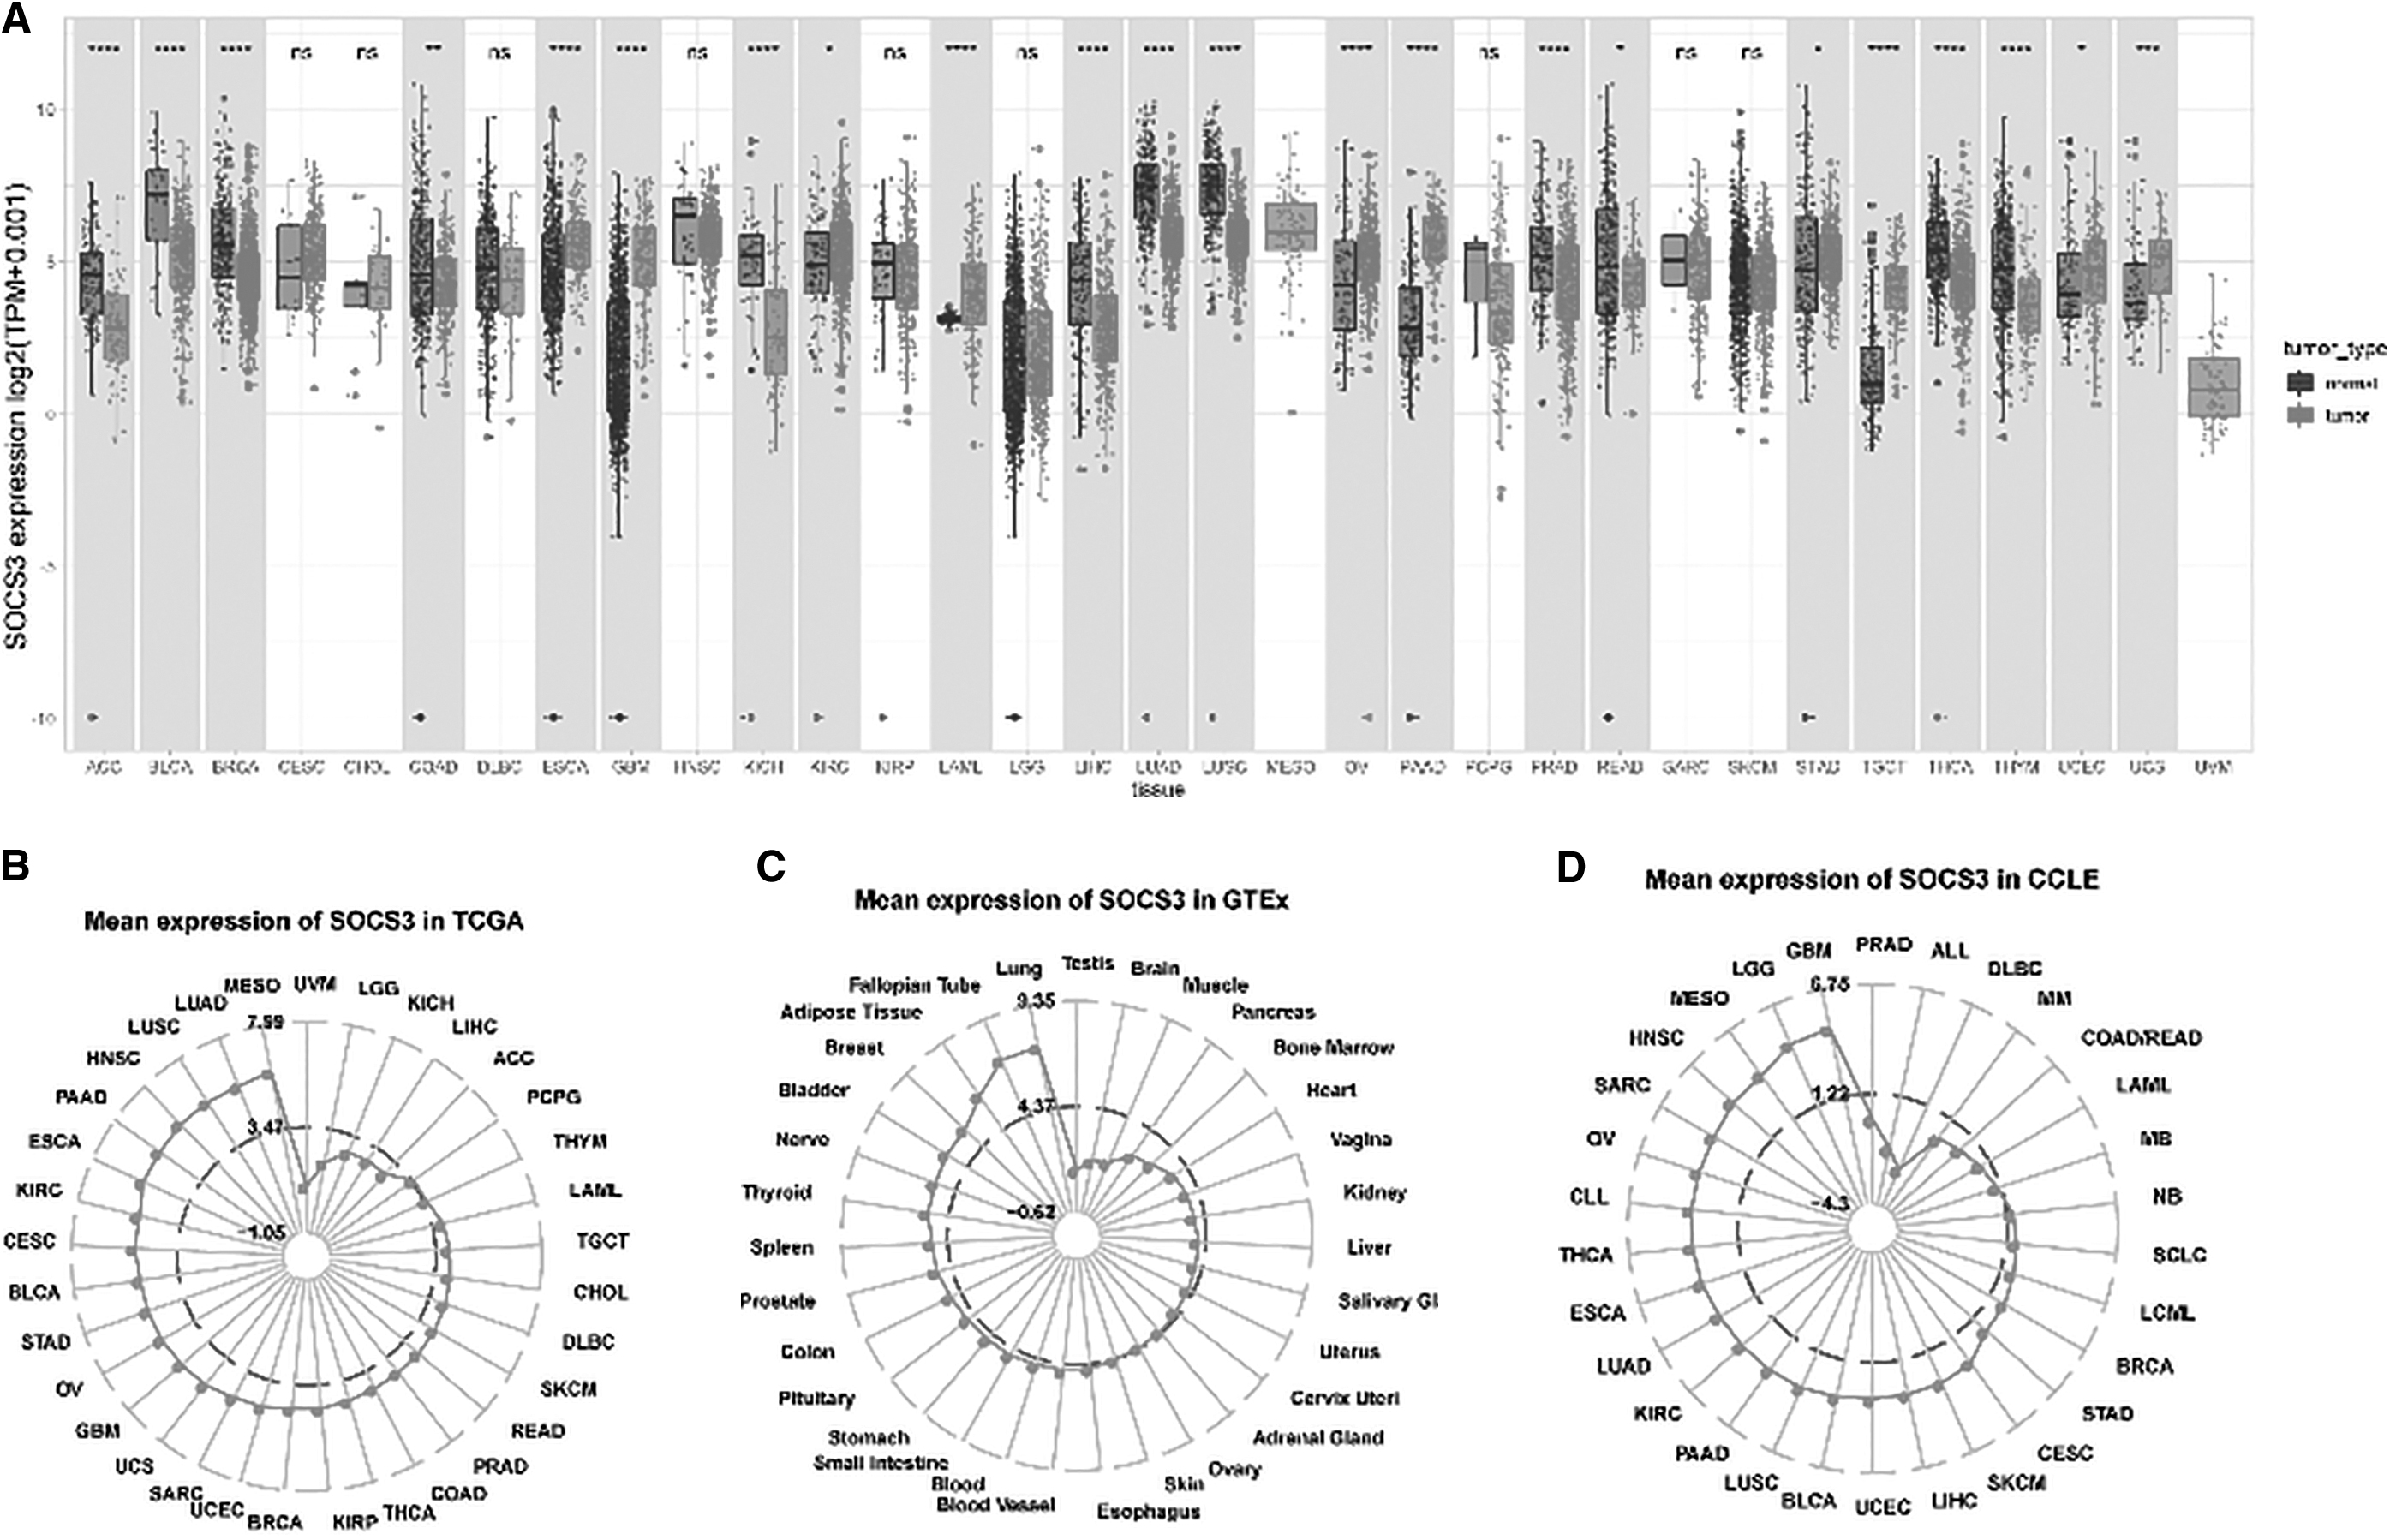
The expression levels of SOCS3 in tumor tissues and normal tissues based on TCGA, GTEx, and CCLE and its possible reason for the dysregulated expression levels.
Among them, SOCS3 was downregulated in 12 types of cancers, including thymoma (THYM), thyroid carcinoma (THCA), rectum adenocarcinoma (READ), prostate adenocarcinoma (PRAD), lung squamous cell carcinoma (LUSC), lung adenocarcinoma (LUAD), liver hepatocellular carcinoma (LIHC), kidney chromophobe (KICH), colon adenocarcinoma (COAD), breast invasive carcinoma (BRCA), adrenocortical carcinoma (ACC), and bladder urothelial carcinoma (BLCA). SOCS3 was overexpressed in 10 types of cancers, including uterine carcinosarcoma (UCS), uterine corpus endometrial carcinoma (UCEC), testicular germ cell tumors (TGCT), stomach adenocarcinoma (STAD), pancreatic adenocarcinoma (PAAD), ovarian serous cystadenocarcinoma (OV), acute myeloid leukemia (LAML), kidney renal clear cell carcinoma (KIRC), glioblastoma multiforme (GBM), and ESCA.
Mutations associated with SOCS3 in pancancers
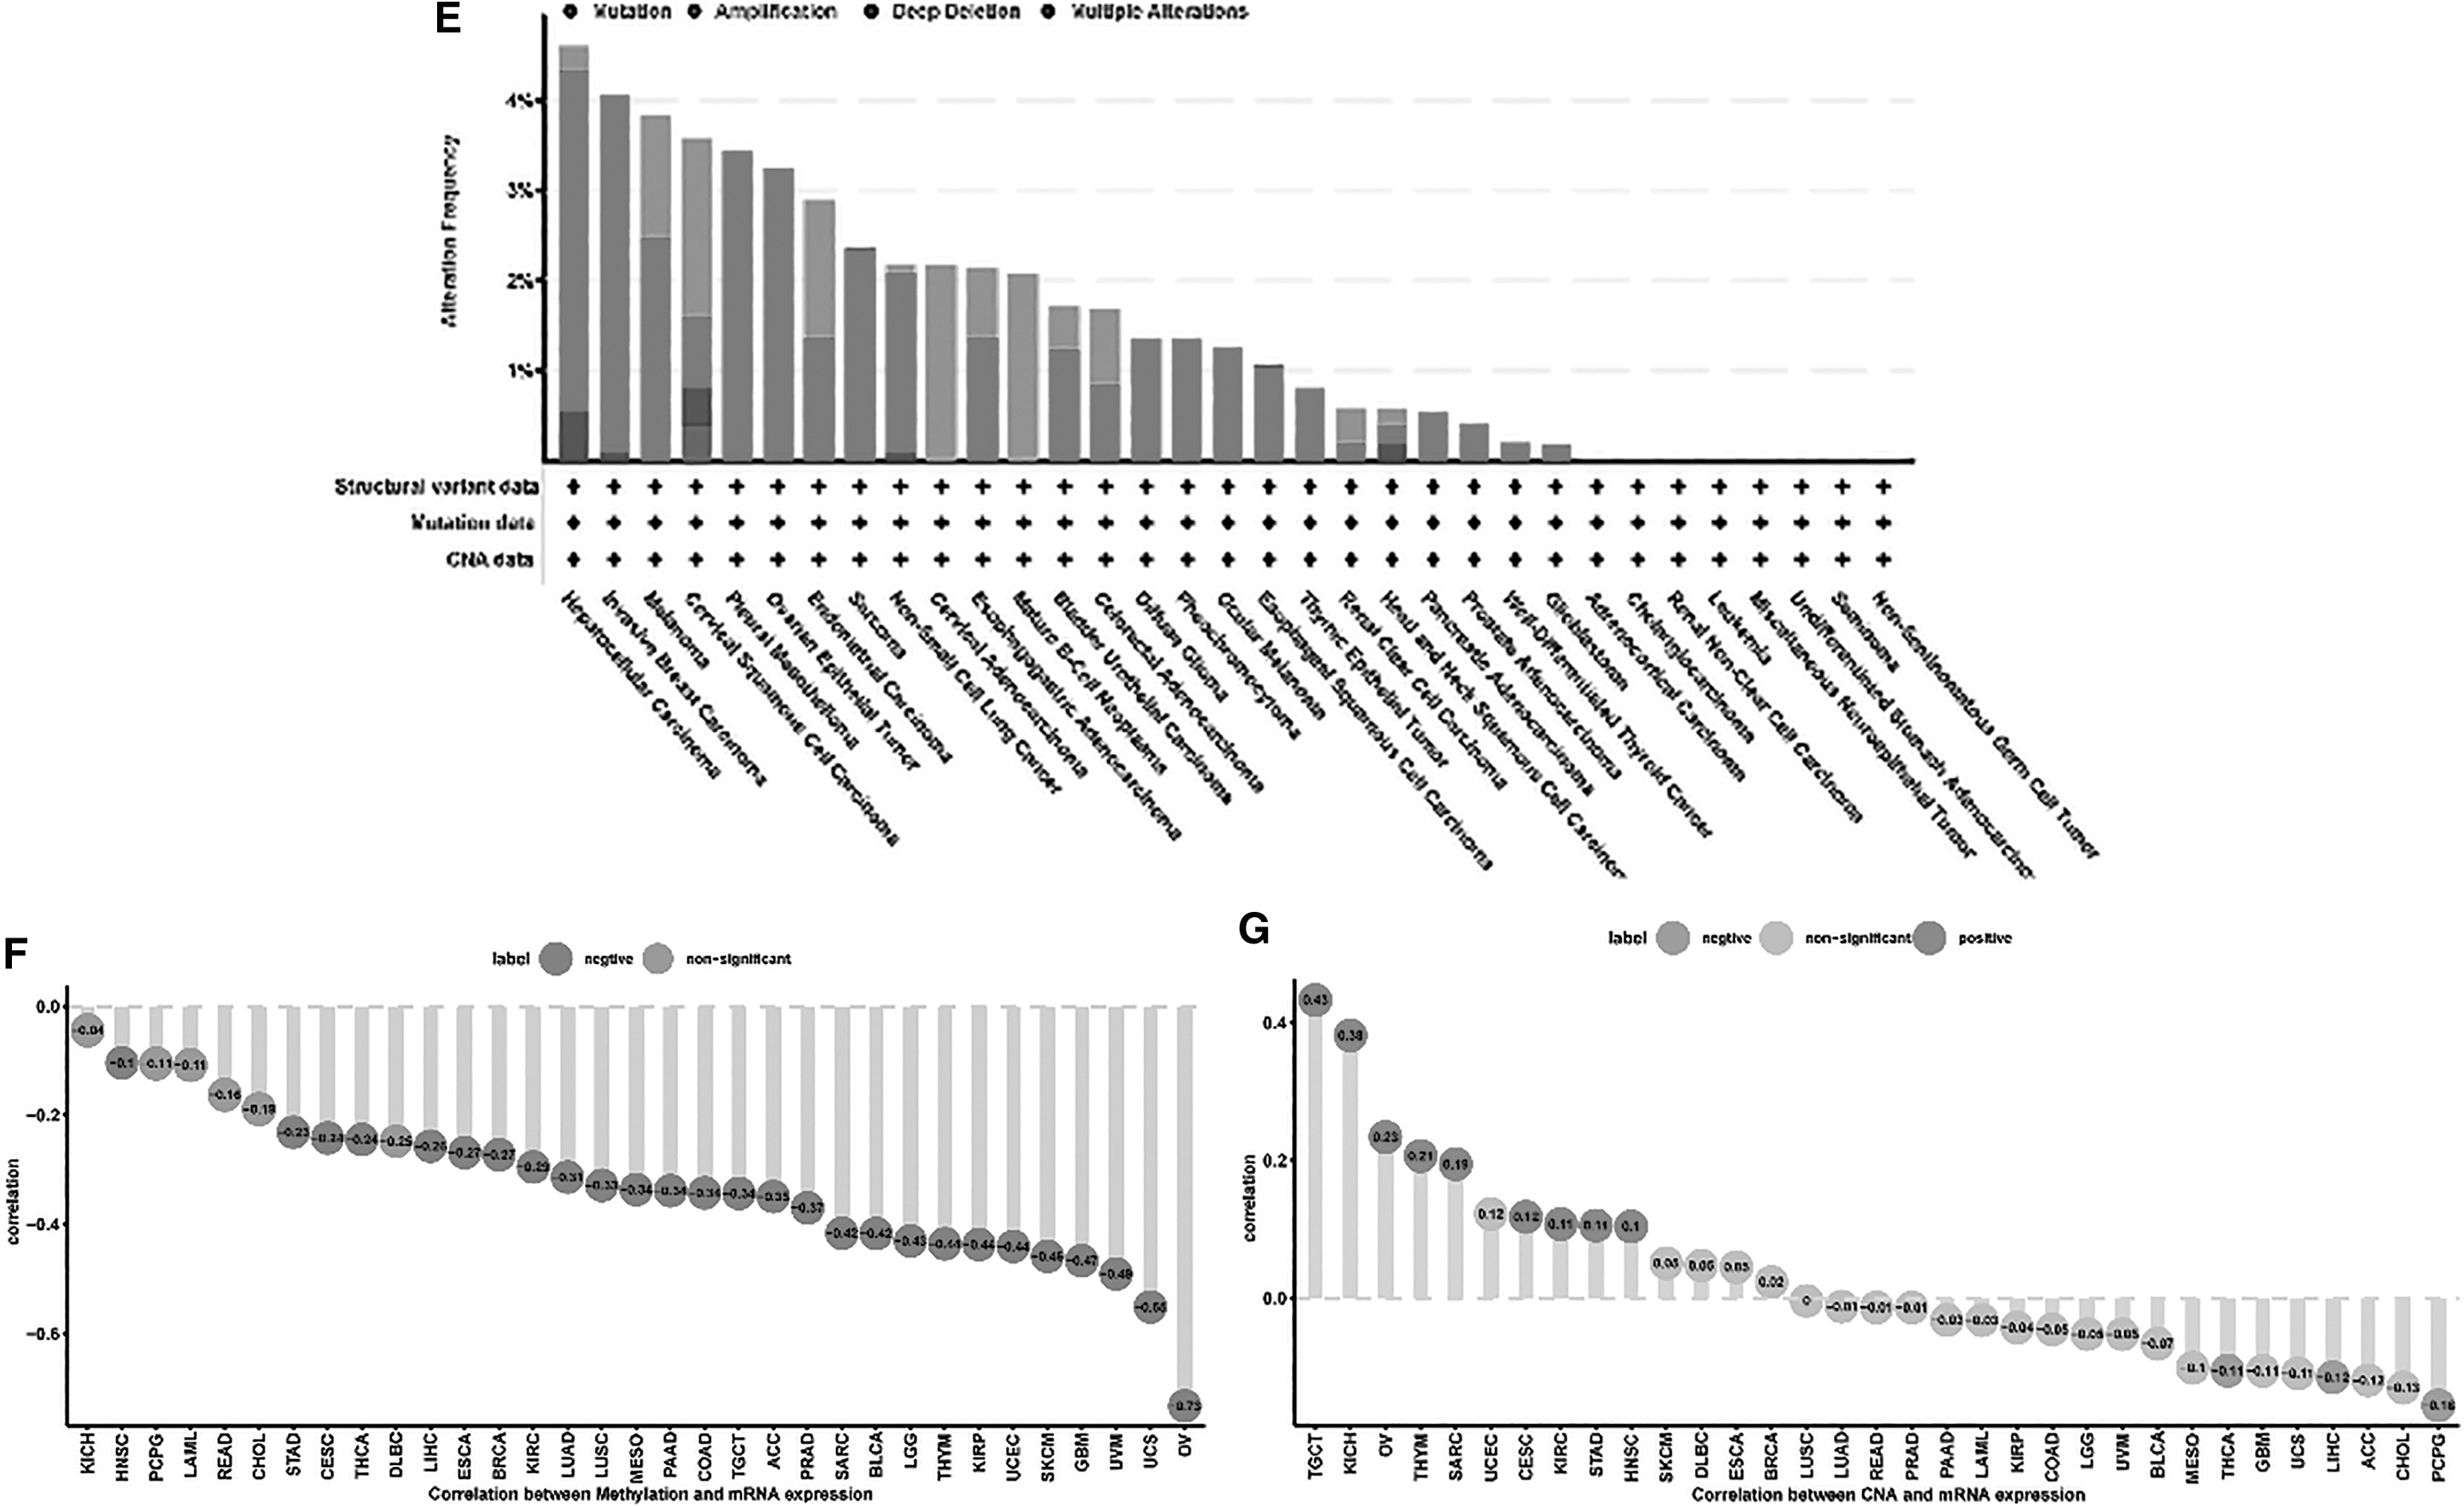
As shown in Figure 1E–G, amplification was one of the causes of the dysregulated expression in all cancers. In ESCA, SOCS3 mutation and amplification were observed as the main reasons for dysregulated SOCS3 expression. Figure 2B shows that methylation levels in 27 out of 33 kinds of cancers were negatively related to SOCS3 expression, including ESCA, and methylation levels in the other six kinds of cancer had no relationship with SOCS3 expression. In addition, CNA in nine kinds of cancers was positively related to SOCS3 expression levels, including TGCT, KICH, OV, THYM, SARC, CESC, KIRC, STAD, and HNSC. CNA in three kinds of cancers was negatively related to SOCS3 expression levels, including THCA, LIHC, and PCPG. In ESCA, no relationship was found between CNA and SOCS3 expression levels (Fig. 1G).
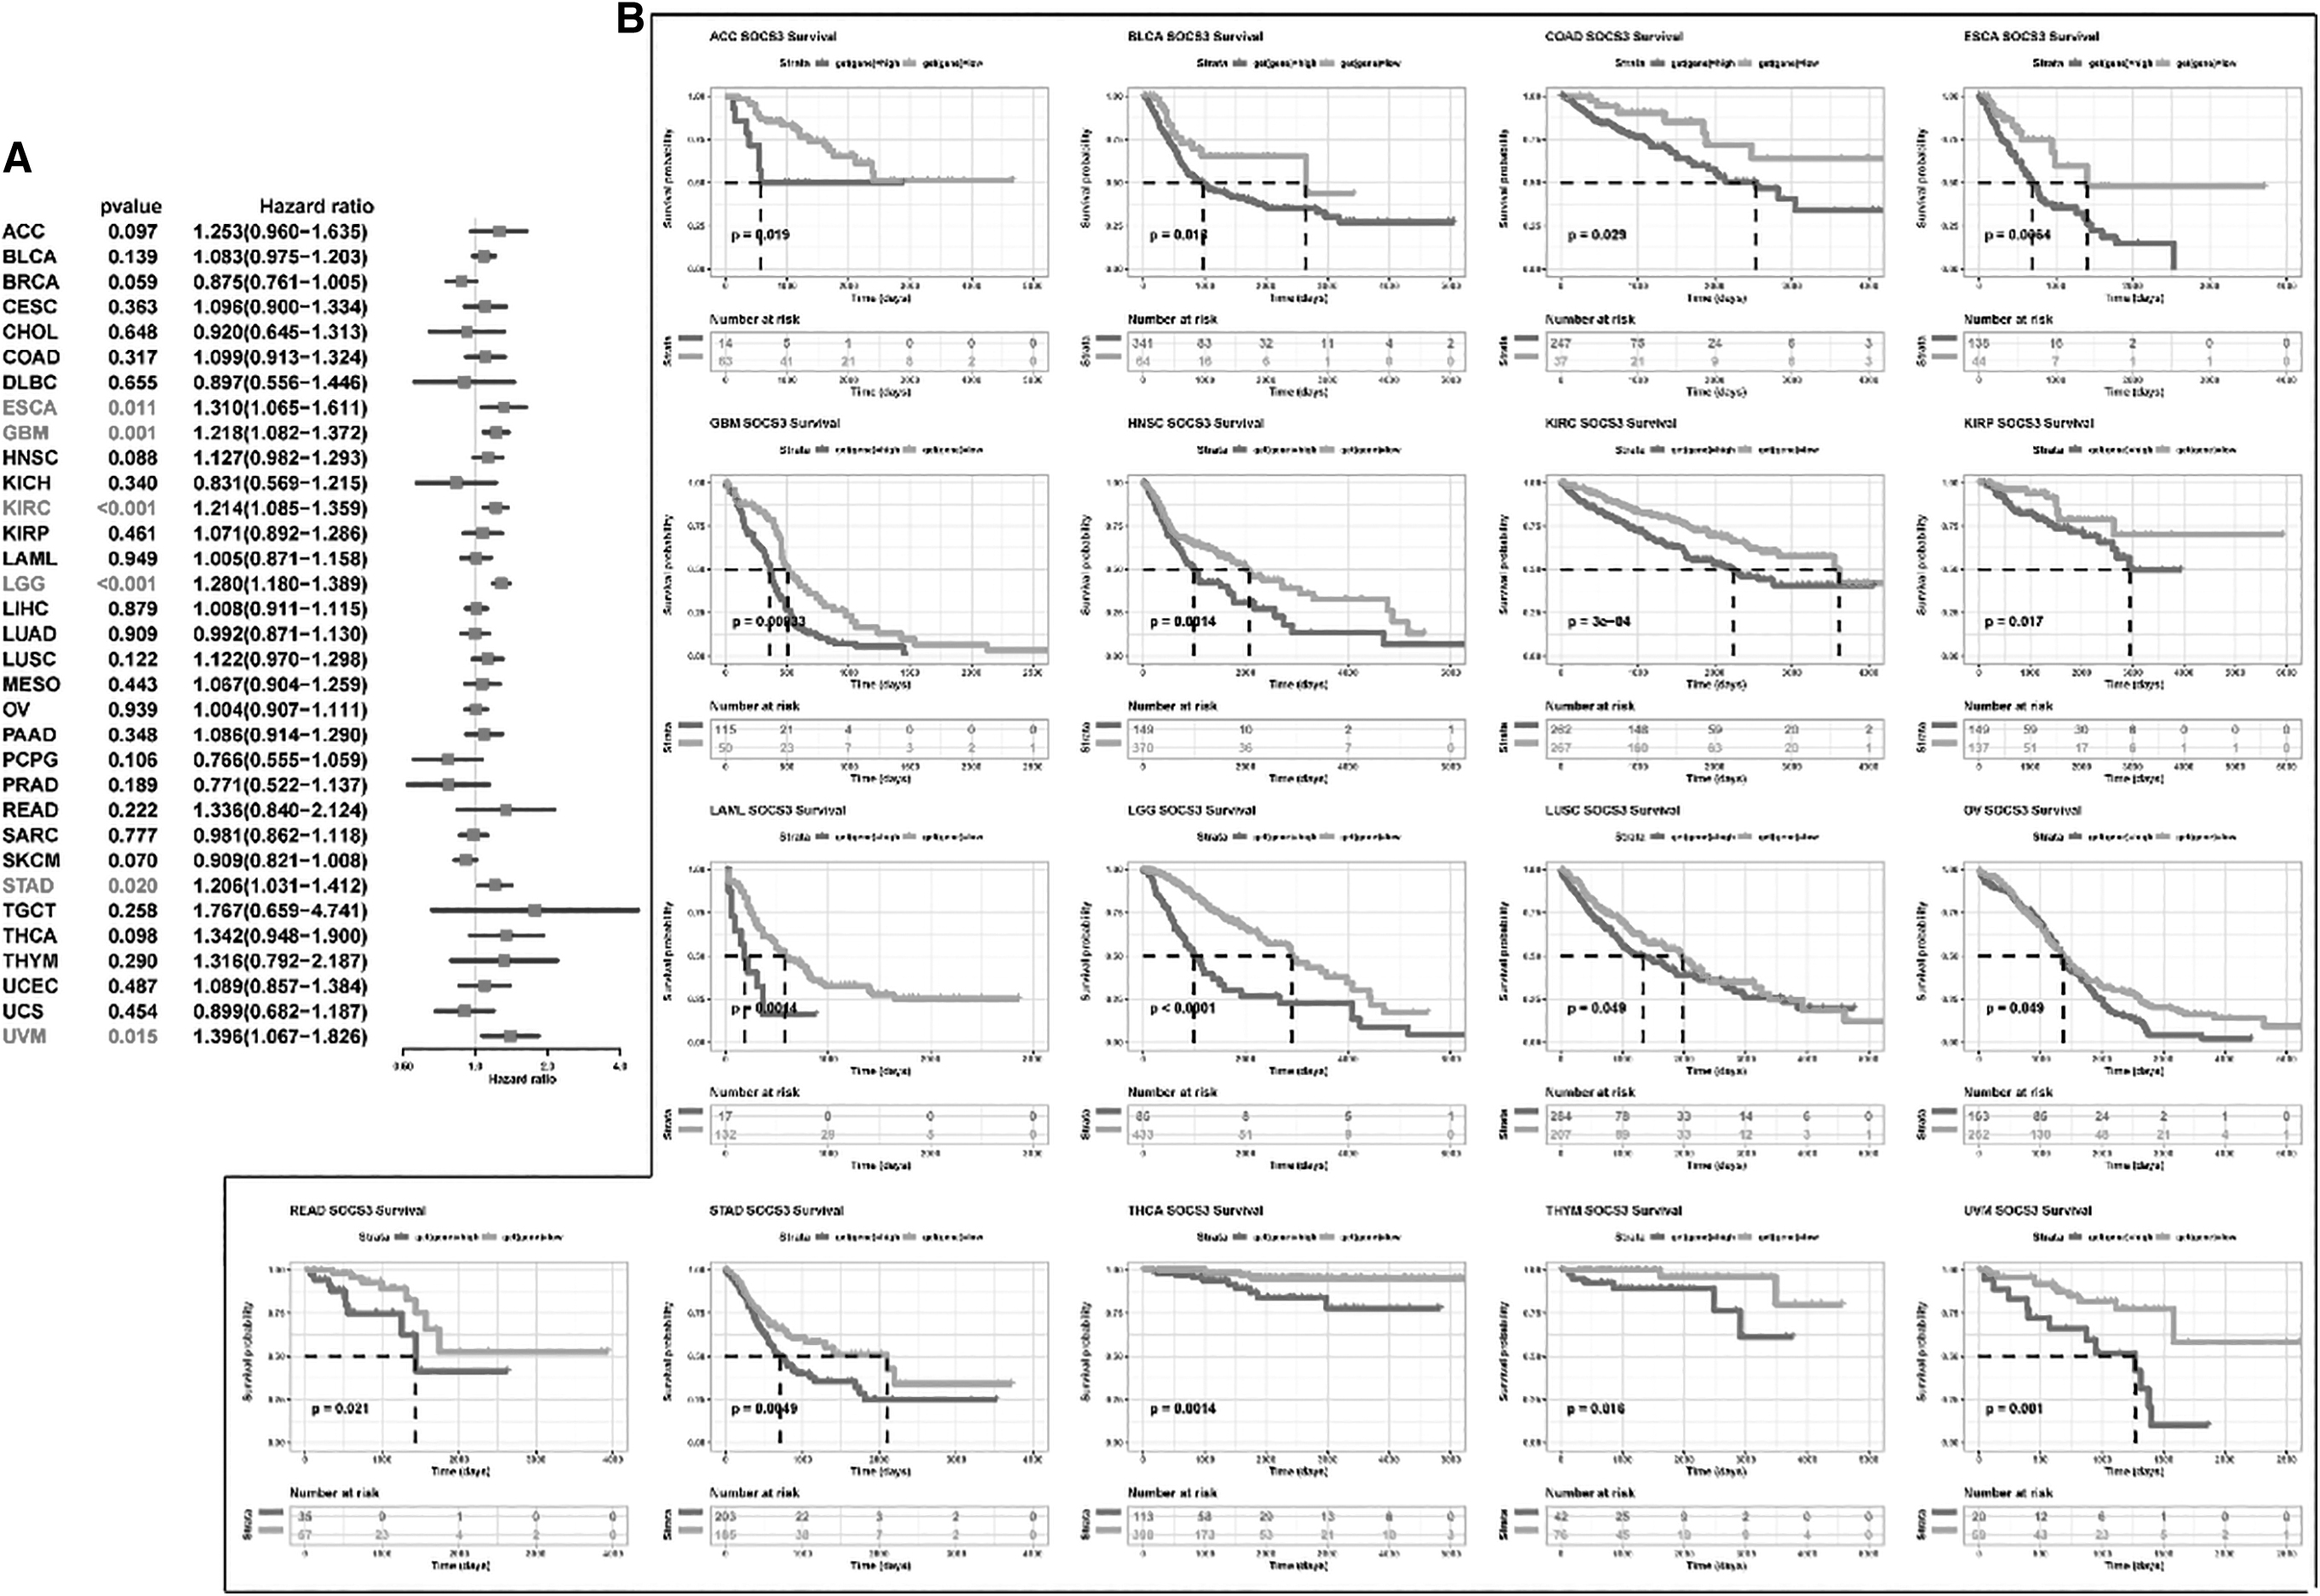
Survival analysis between high- and low-SOCS3 mRNA expression groups.
Correlation between the SOCS3 expression level and prognosis
According to the median expression value of each type of cancer, the samples were divided into two groups: a high-expression group and a low-expression group. Figure 2A shows that the expression level of SOCS3 was significantly associated with six types of cancers, including ESCA (p = 0.011), GBM (p = 0.001), KIRC (<0.001), LGG (<0.001), STAD (p = 0.020), and UVM (p = 0.015). ESCA patients with low expression levels of SOCS3 showed better overall survival than patients with high expression levels of SOCS3 (Fig. 2B).
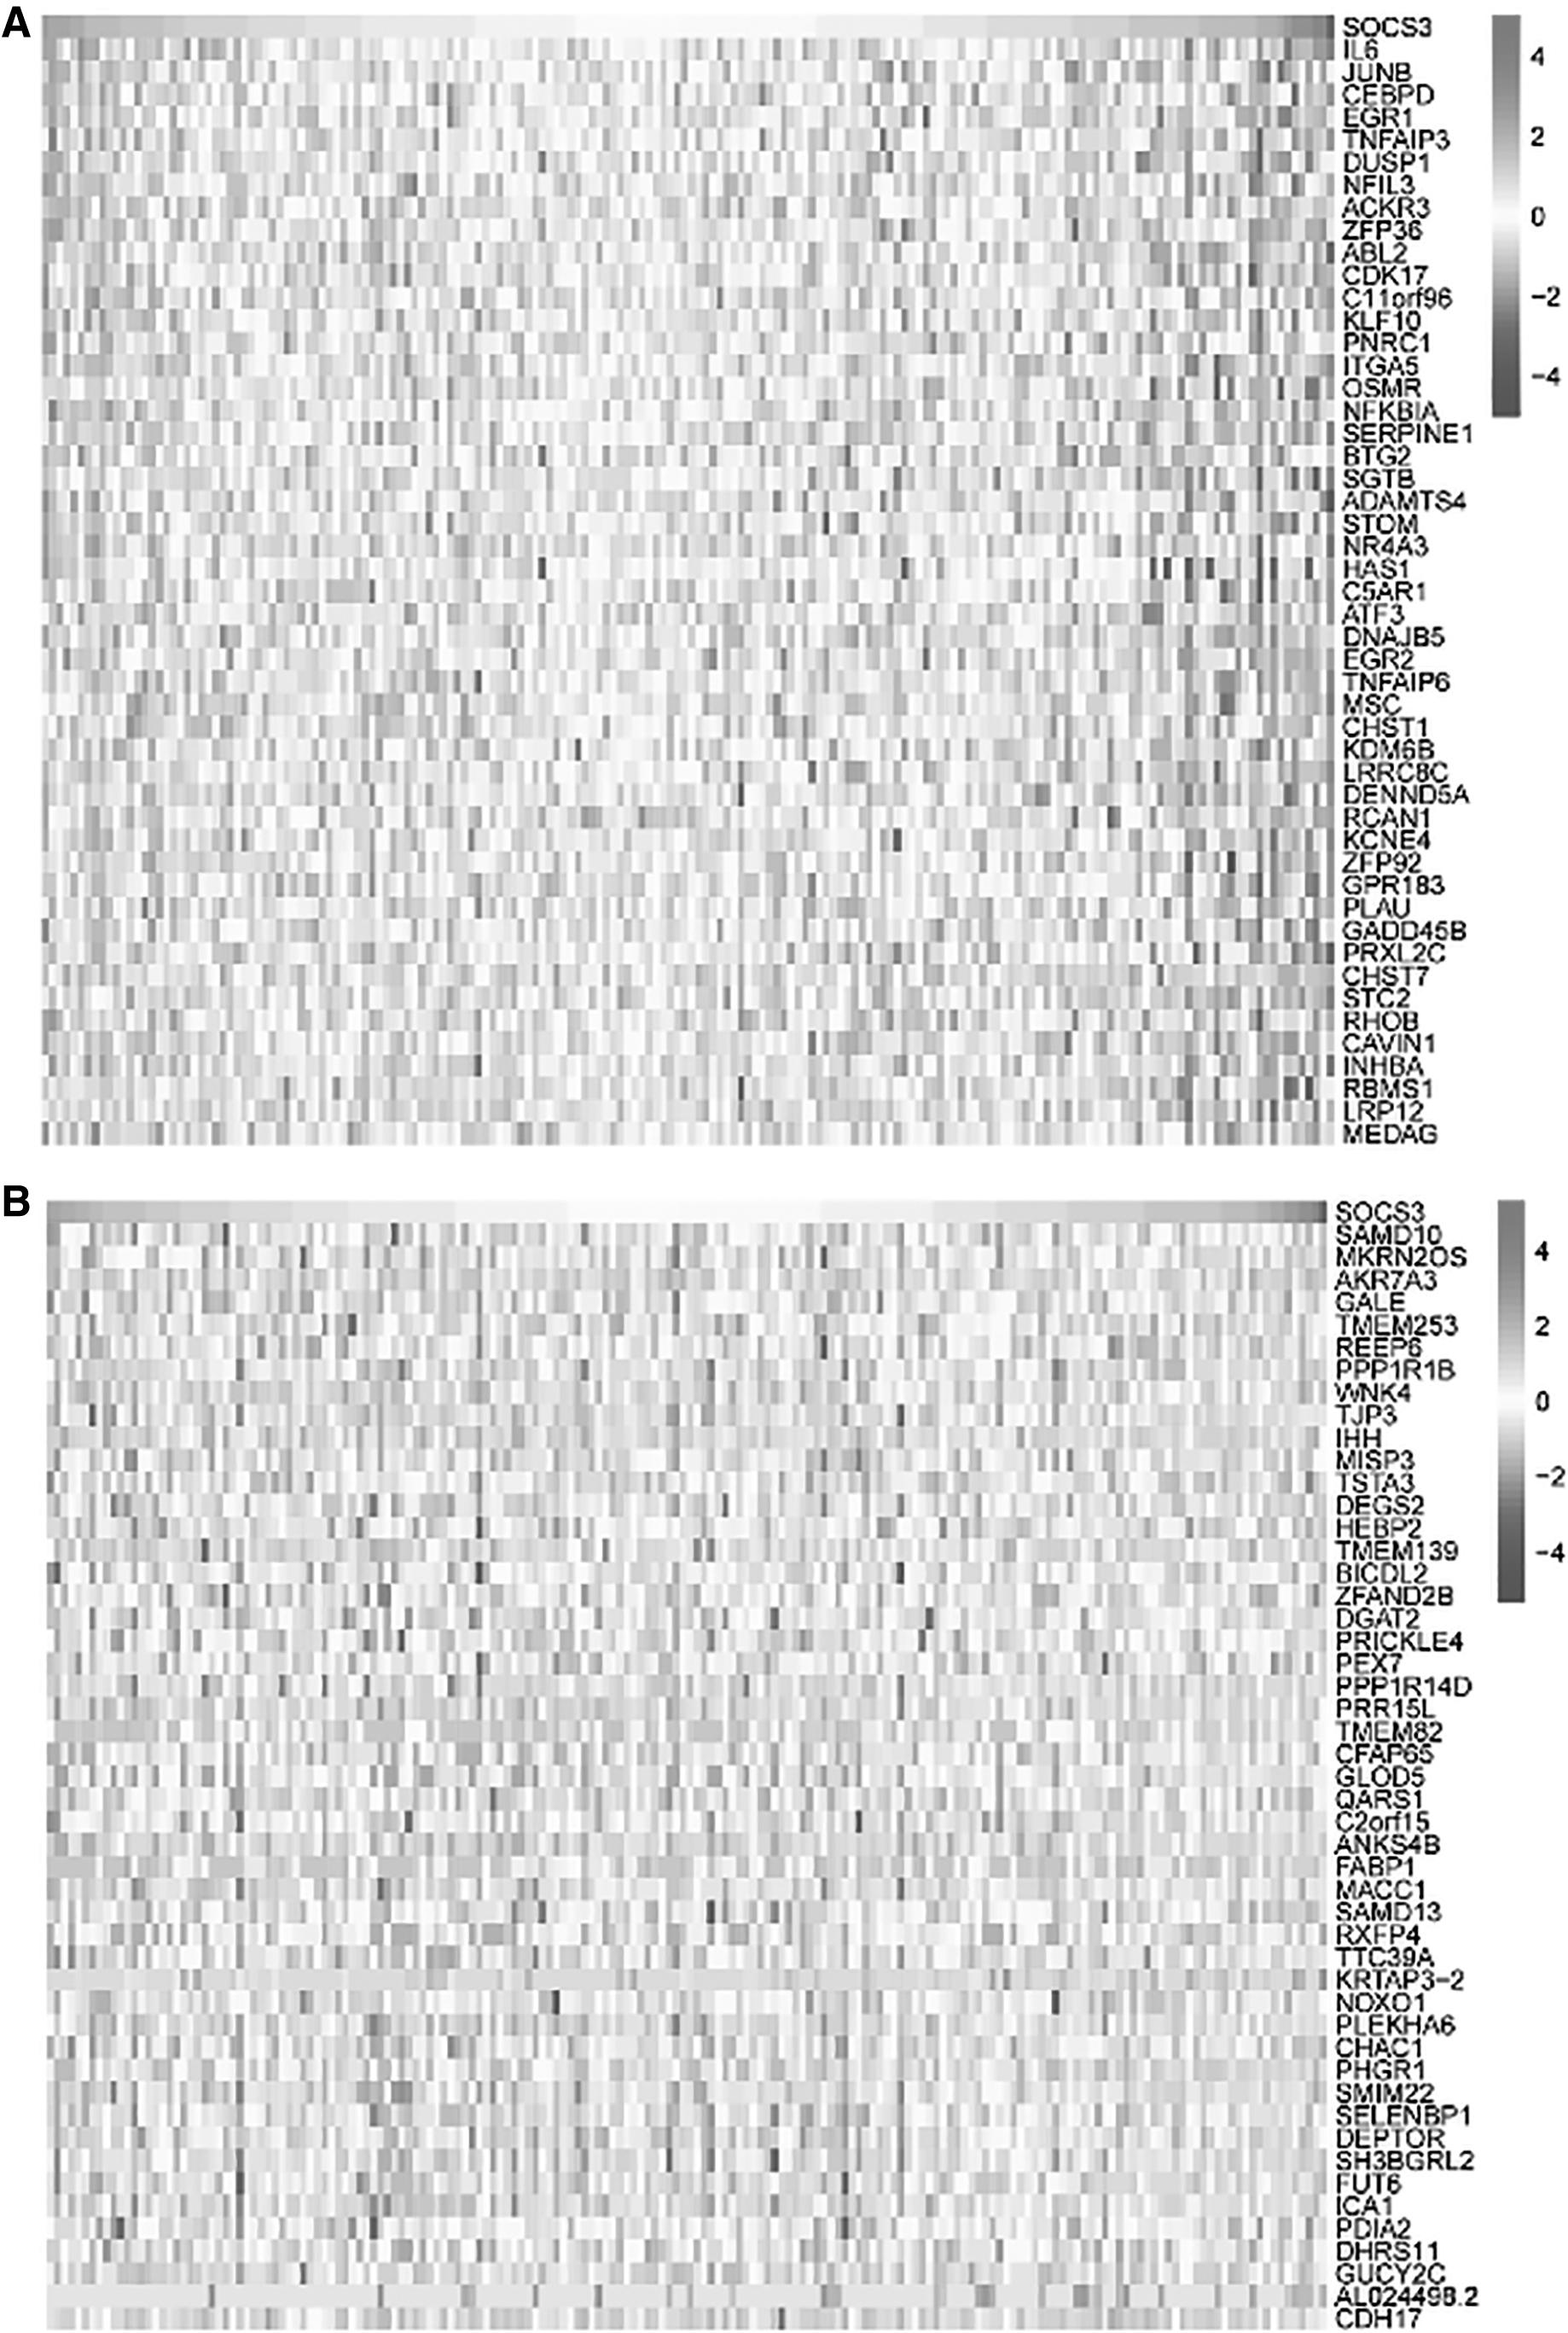
Functional analysis associated with SOCS3 in ESCA
In ESCA, the genes related to SOCS3 were investigated. Figure 3A shows the top 50 genes positively related to SOCS3 in ESCA, including IL-6, JUNB, and CEBPD, and Figure 3B shows the top 50 genes negatively related to SOCS3 in ESCA, including SAMD10, MKRN2OS, and AKR7A3. Furthermore, the positively related genes were significantly enriched in GO BP, such as extracellular structure organization, extracellular matrix organization, and response to molecules of bacterial origin. The significantly enriched KEGG pathways by SOCS3 positively related genes included proteoglycans in cancer, the PI3K-Akt signaling pathway, and Kaposi sarcoma-associated herpesvirus infection (Fig. 3C–F).
Genes significantly related with SOCS3 and GSEA of SOCS3 positively related genes in ESCA.
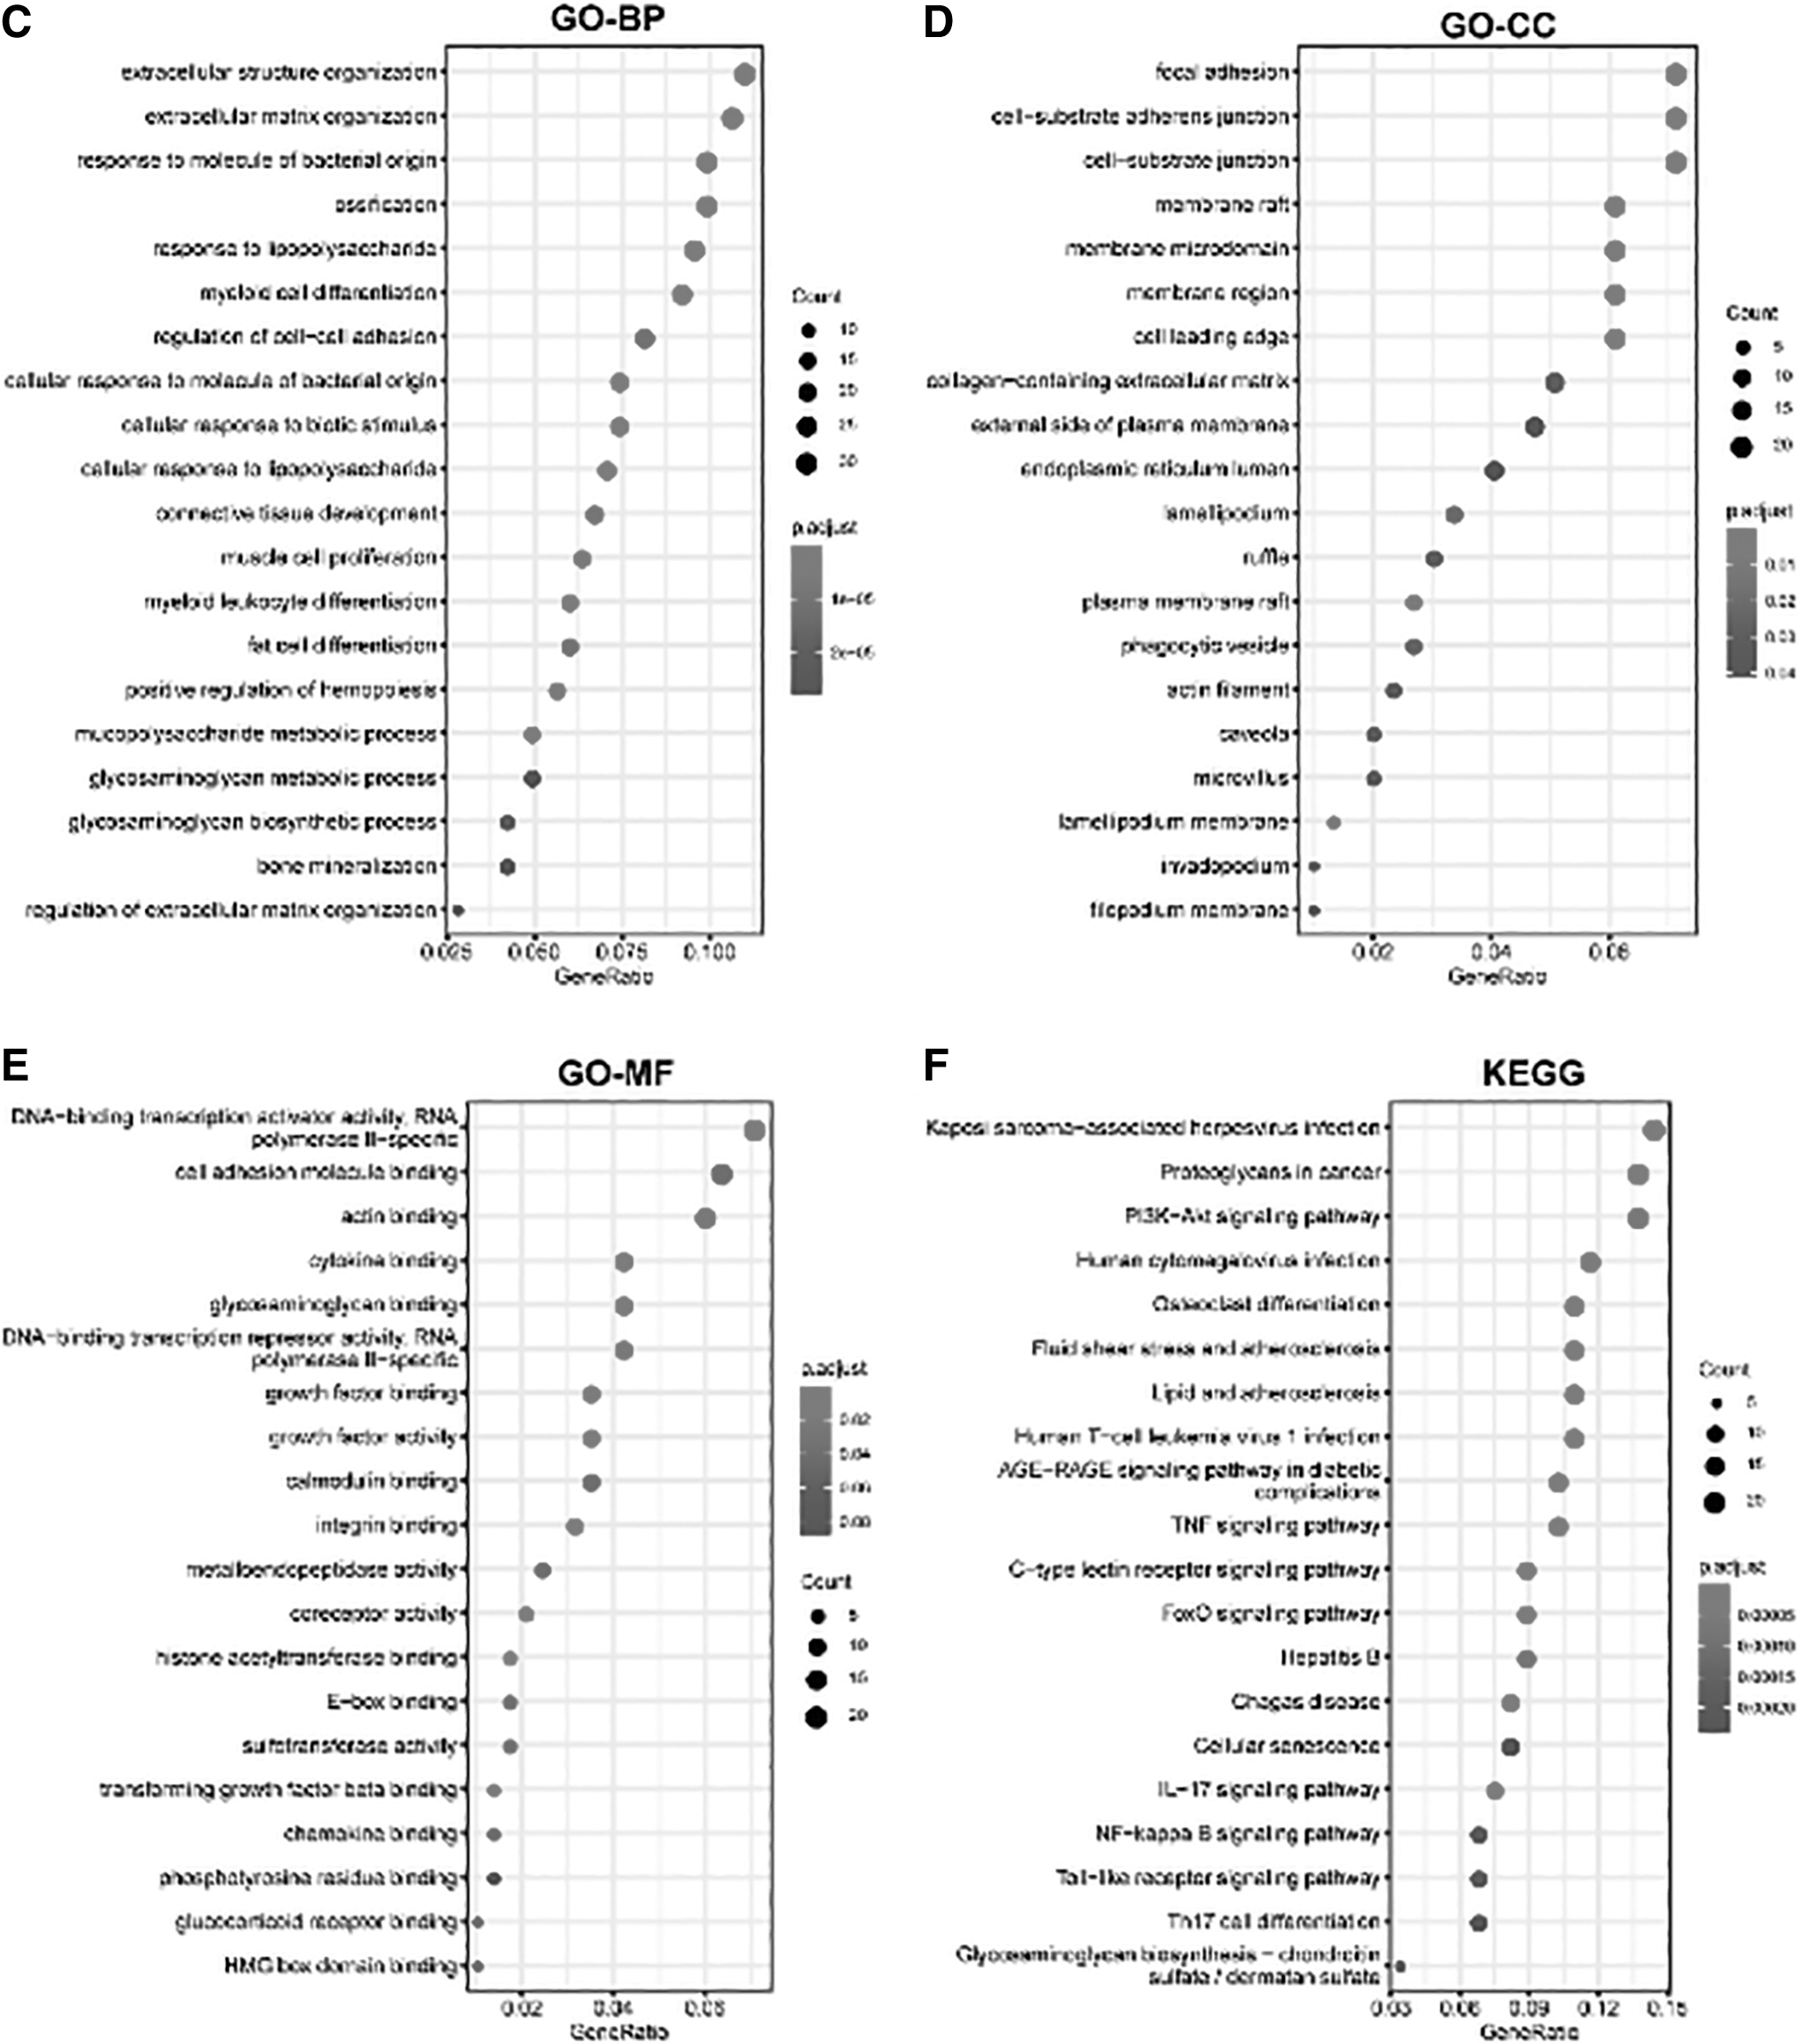
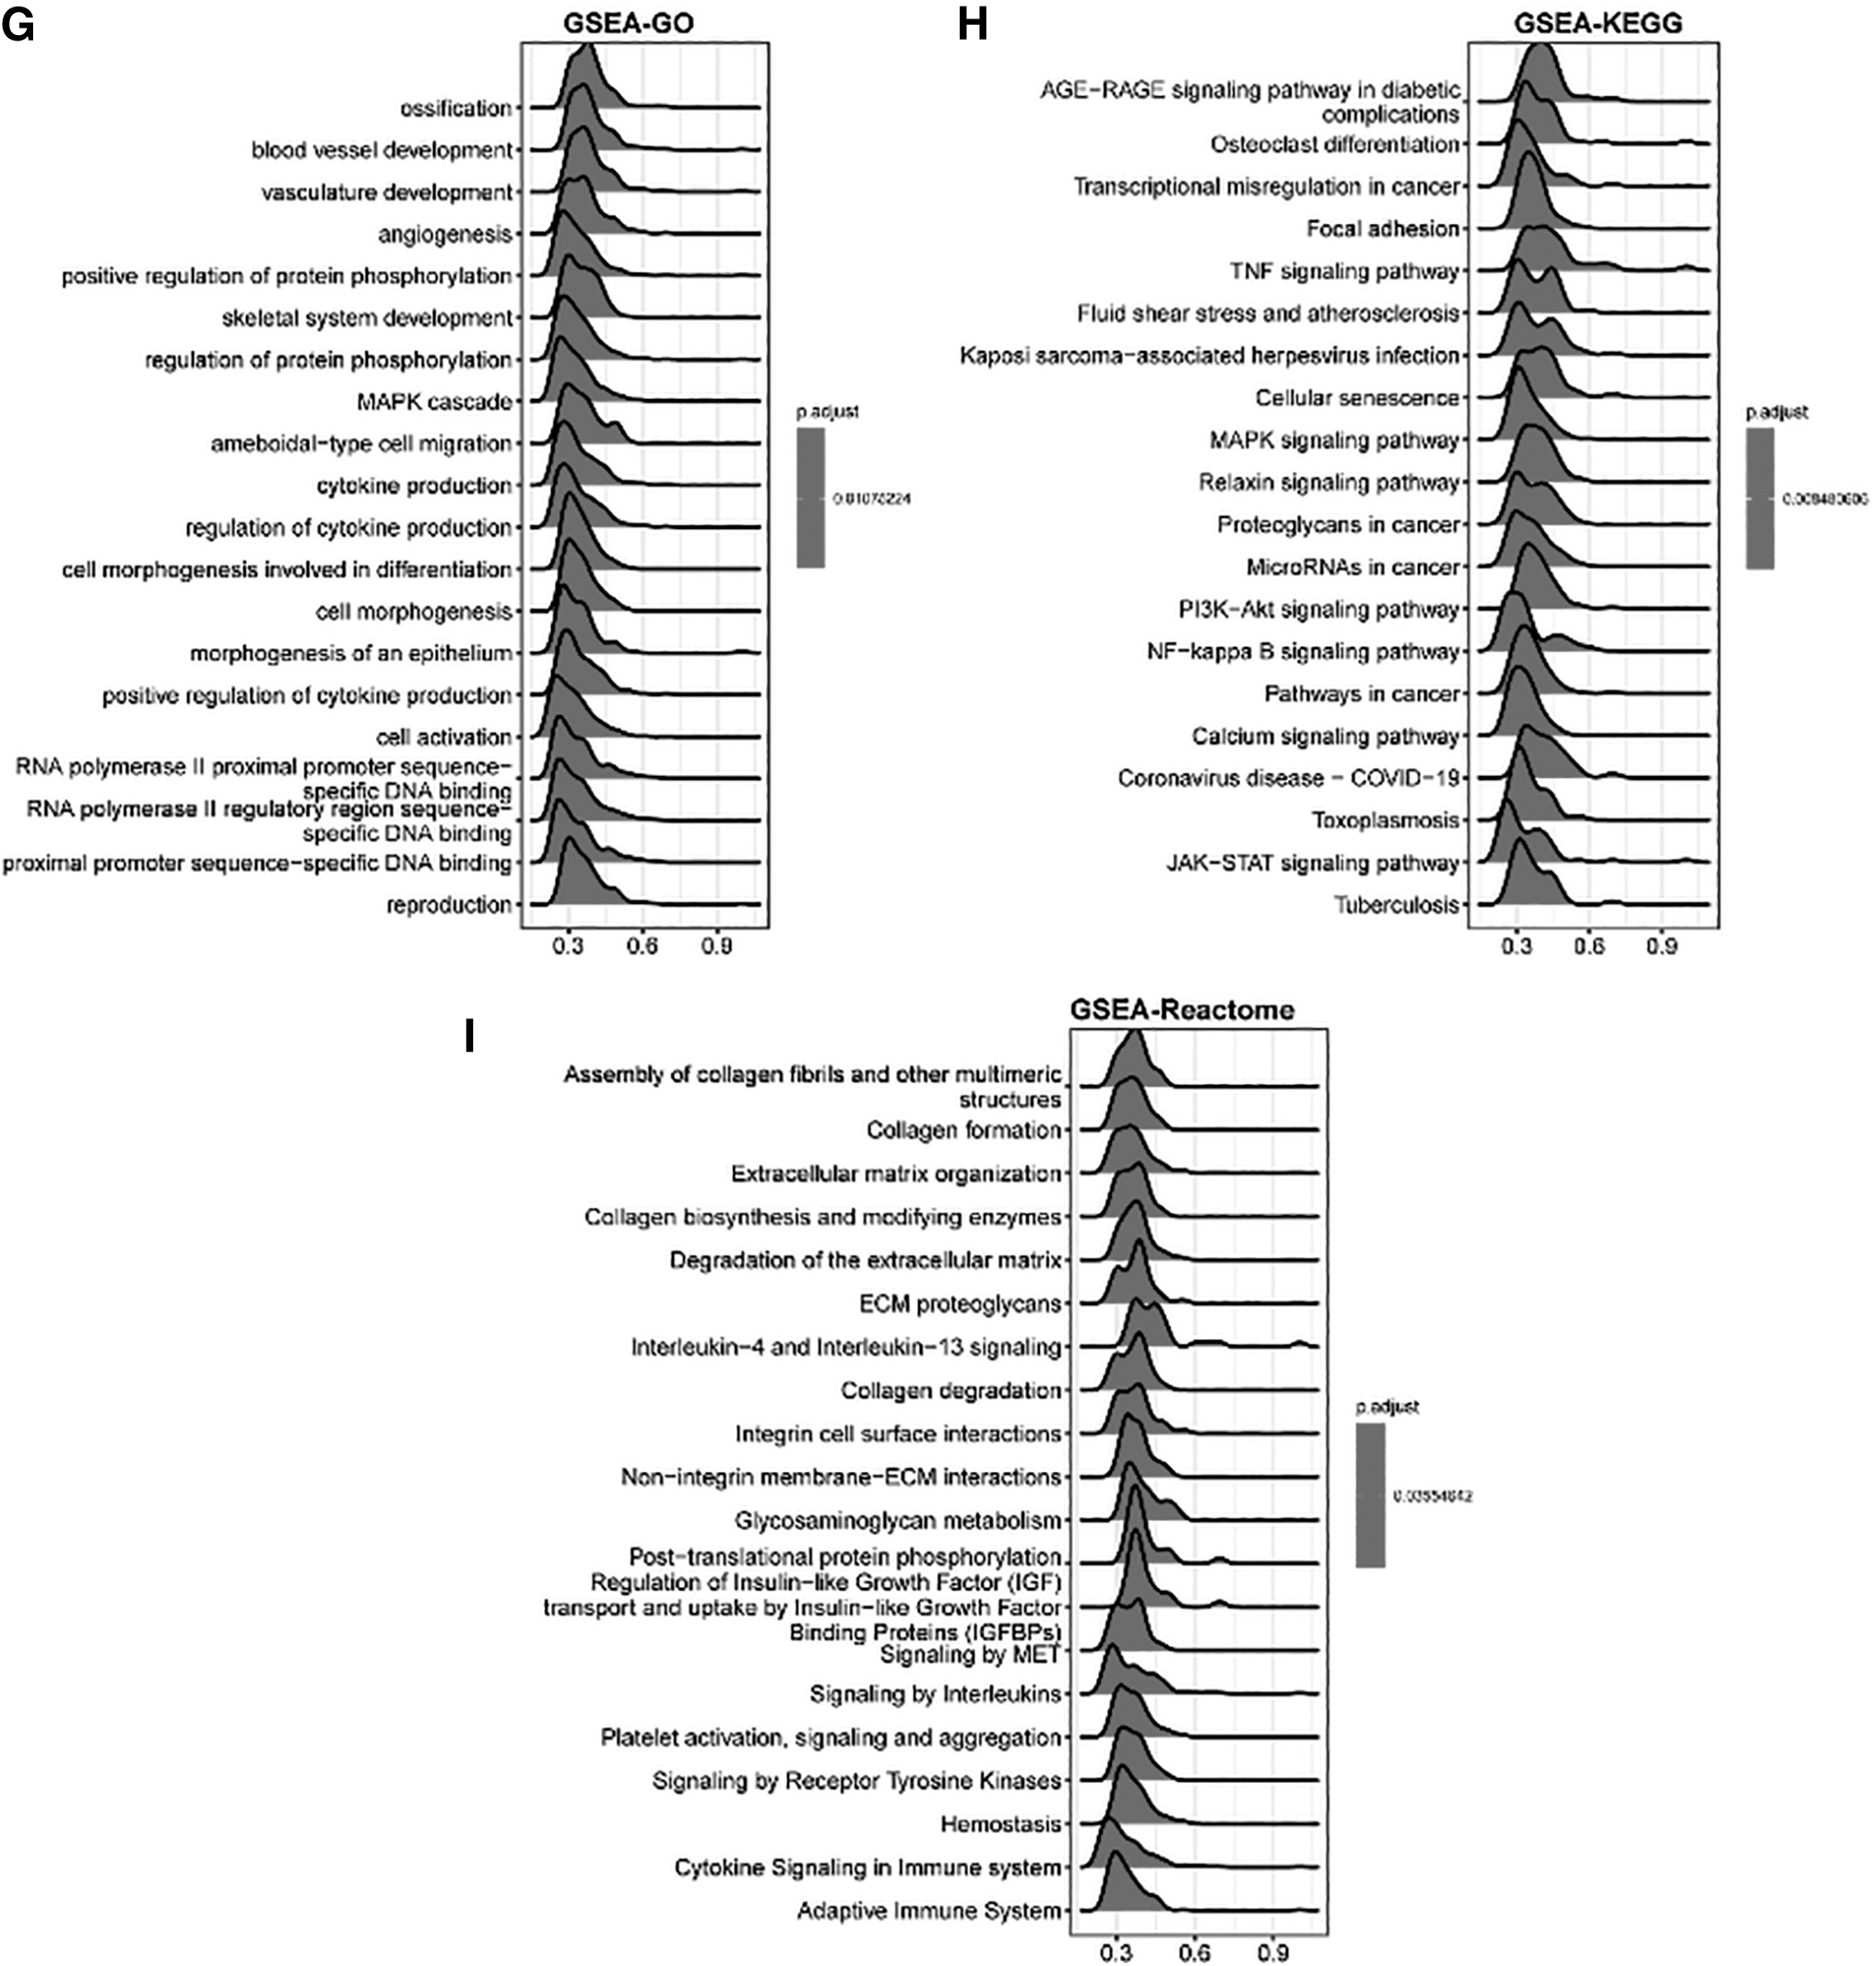
Furthermore, functional analysis of SOCS3-related genes was performed. These genes were significantly enriched in GO terms such as ossification (Fig. 3), KEGG pathways such as the AGE-RAGEA signaling pathway in diabetes, and the reactome such as the assembly of collagen fibrils and other multiple elements.
Tumor microenvironment and SOCS3 expression level
As shown in Figure 4, we also tested known signatures within the ESCA dataset to better describe the functionality of the tumor microenvironment signature genes. These analyses confirmed that the SOCS3 expression level was significantly associated with immune-relevant signatures and stromal-relevant signatures (Fig. 4A, B). Furthermore, the ESTIMATE algorithm was used to analyze the stromal score, immune score, ESTIMATE score, and tumor purity based on transcriptome expression profiles of SOCS3 across cancers. In total, 26 out of 33 TCGA cancers were significantly related to all four scores associated with immune ingredients. Moreover, in ESCA, we observed that the SOCS3 expression level was positively related to the ESTIMATE score, immune score, and stromal score (all p < 0.01). The expression level of SOCS3 was negatively related to tumor purity (p < 0.01; Fig. 4C).
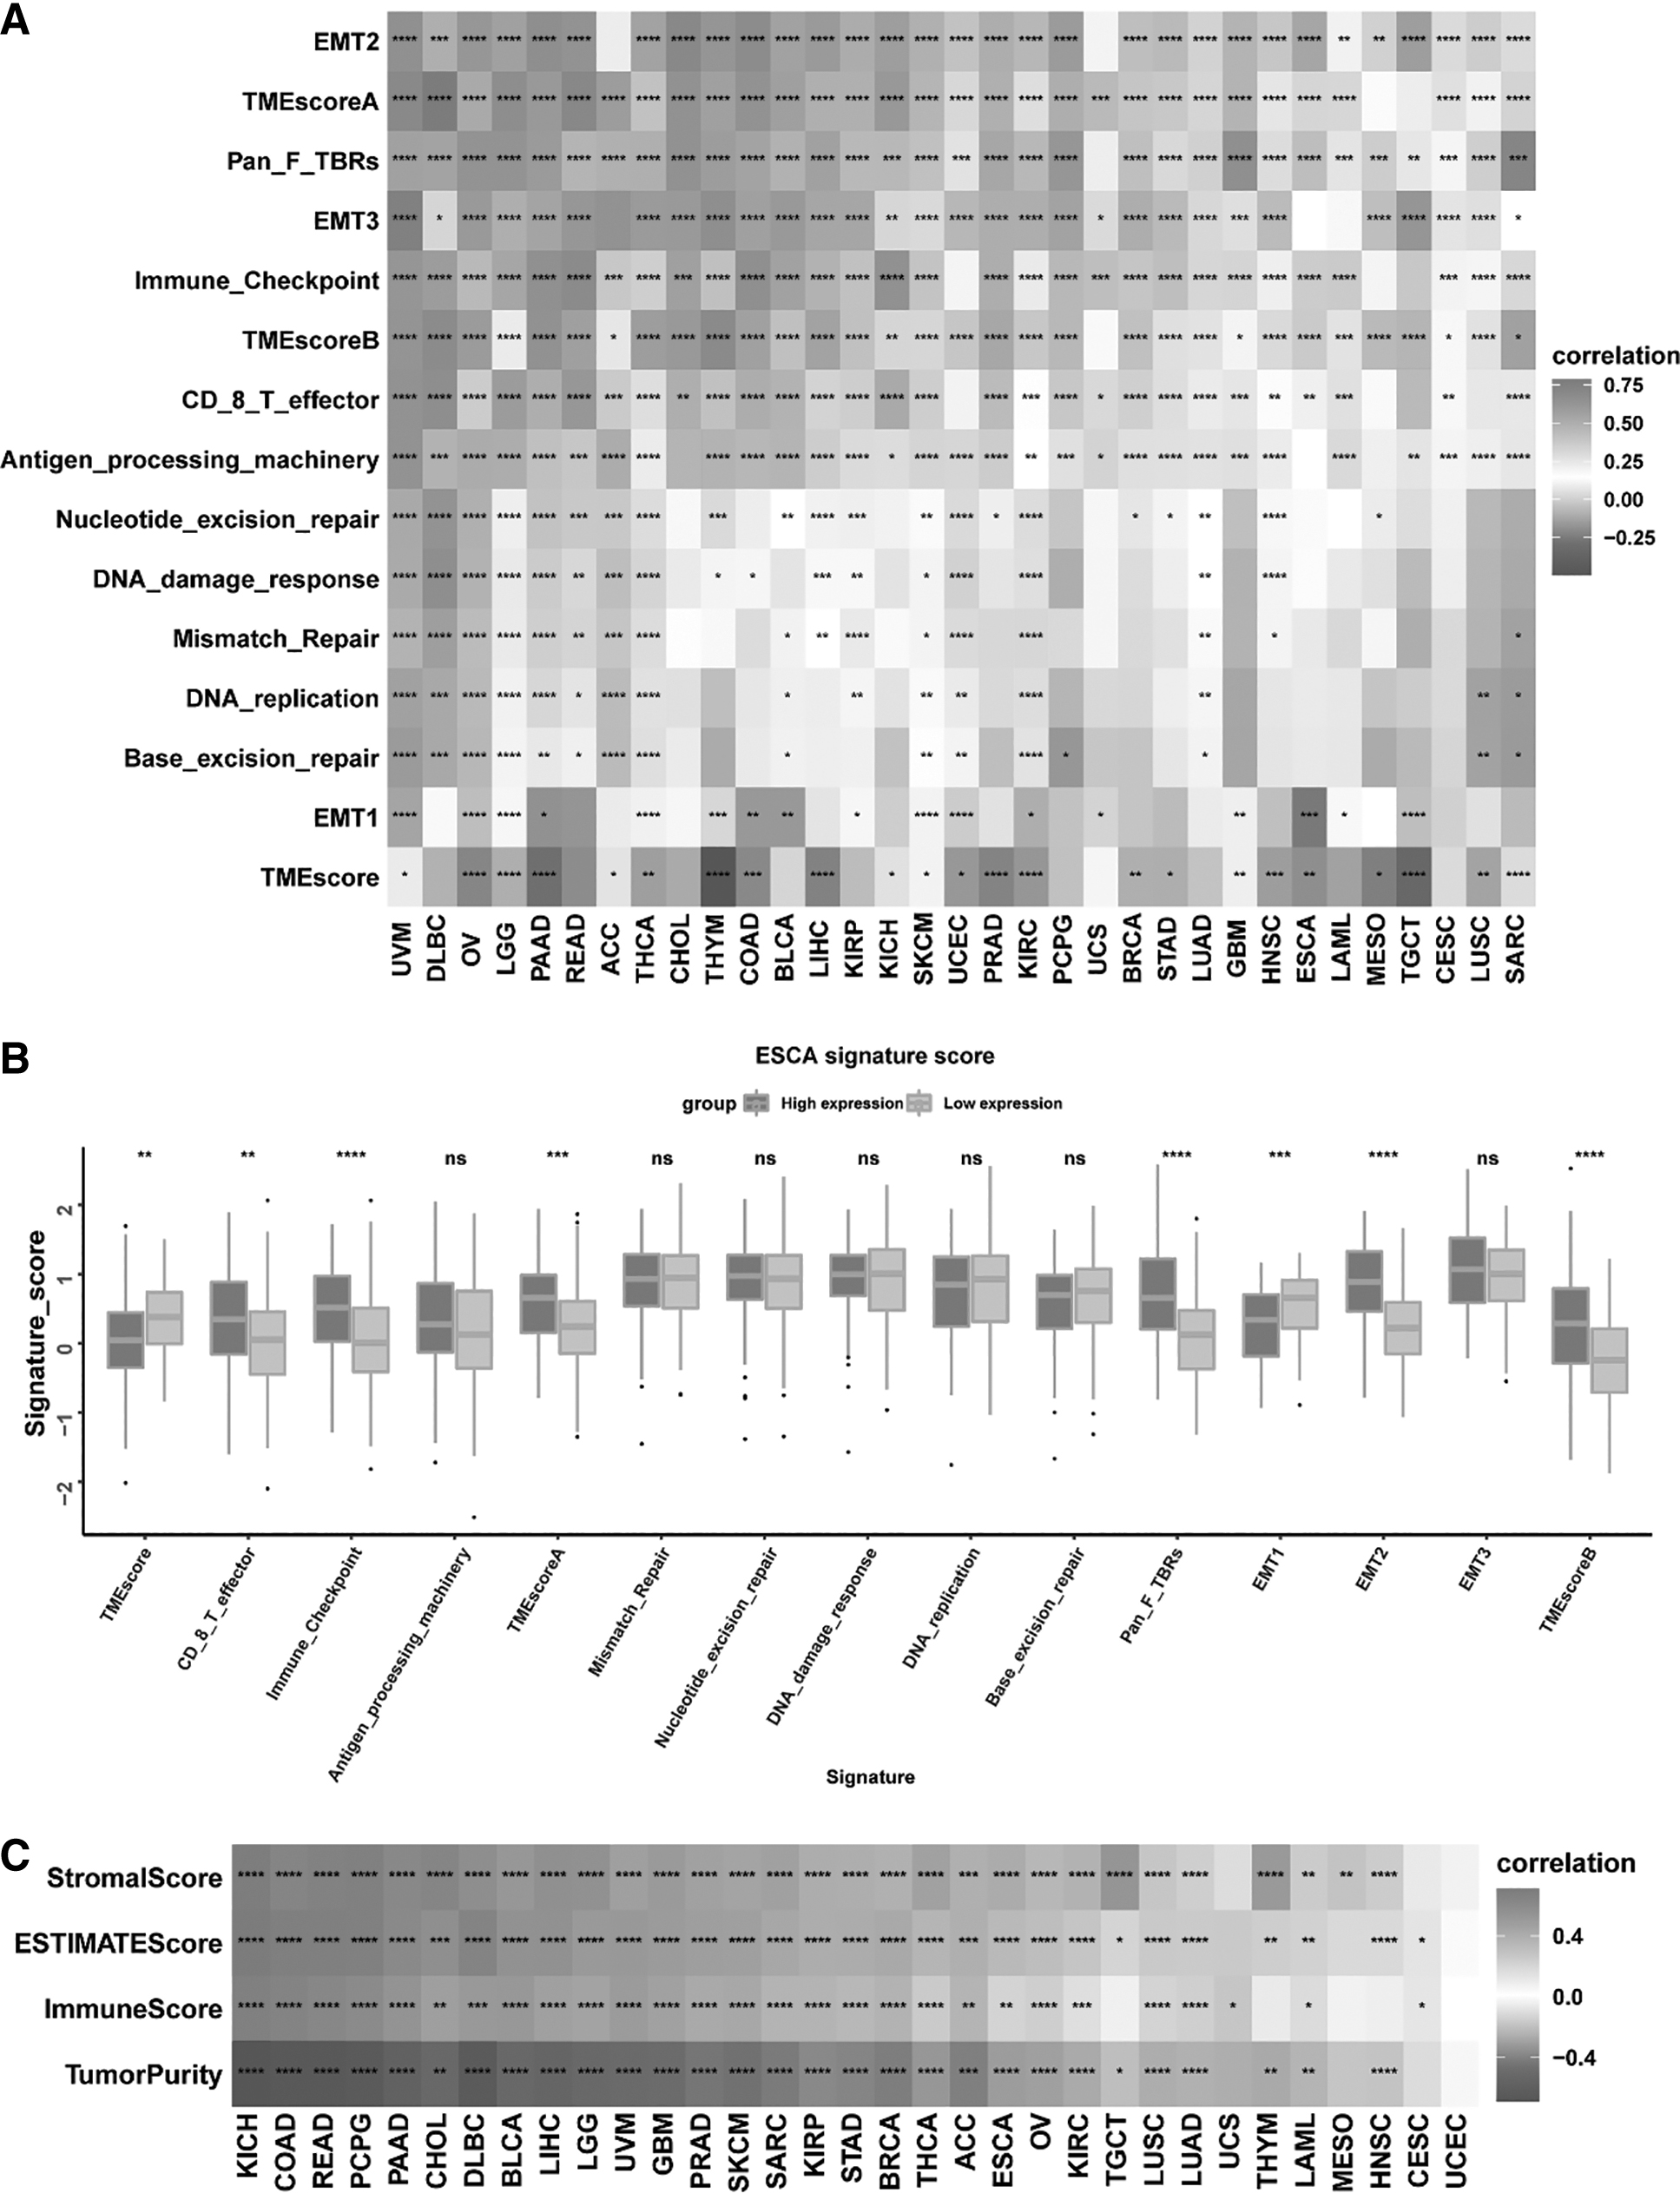
Construction of tumor microenvironment signatures and functional annotation.
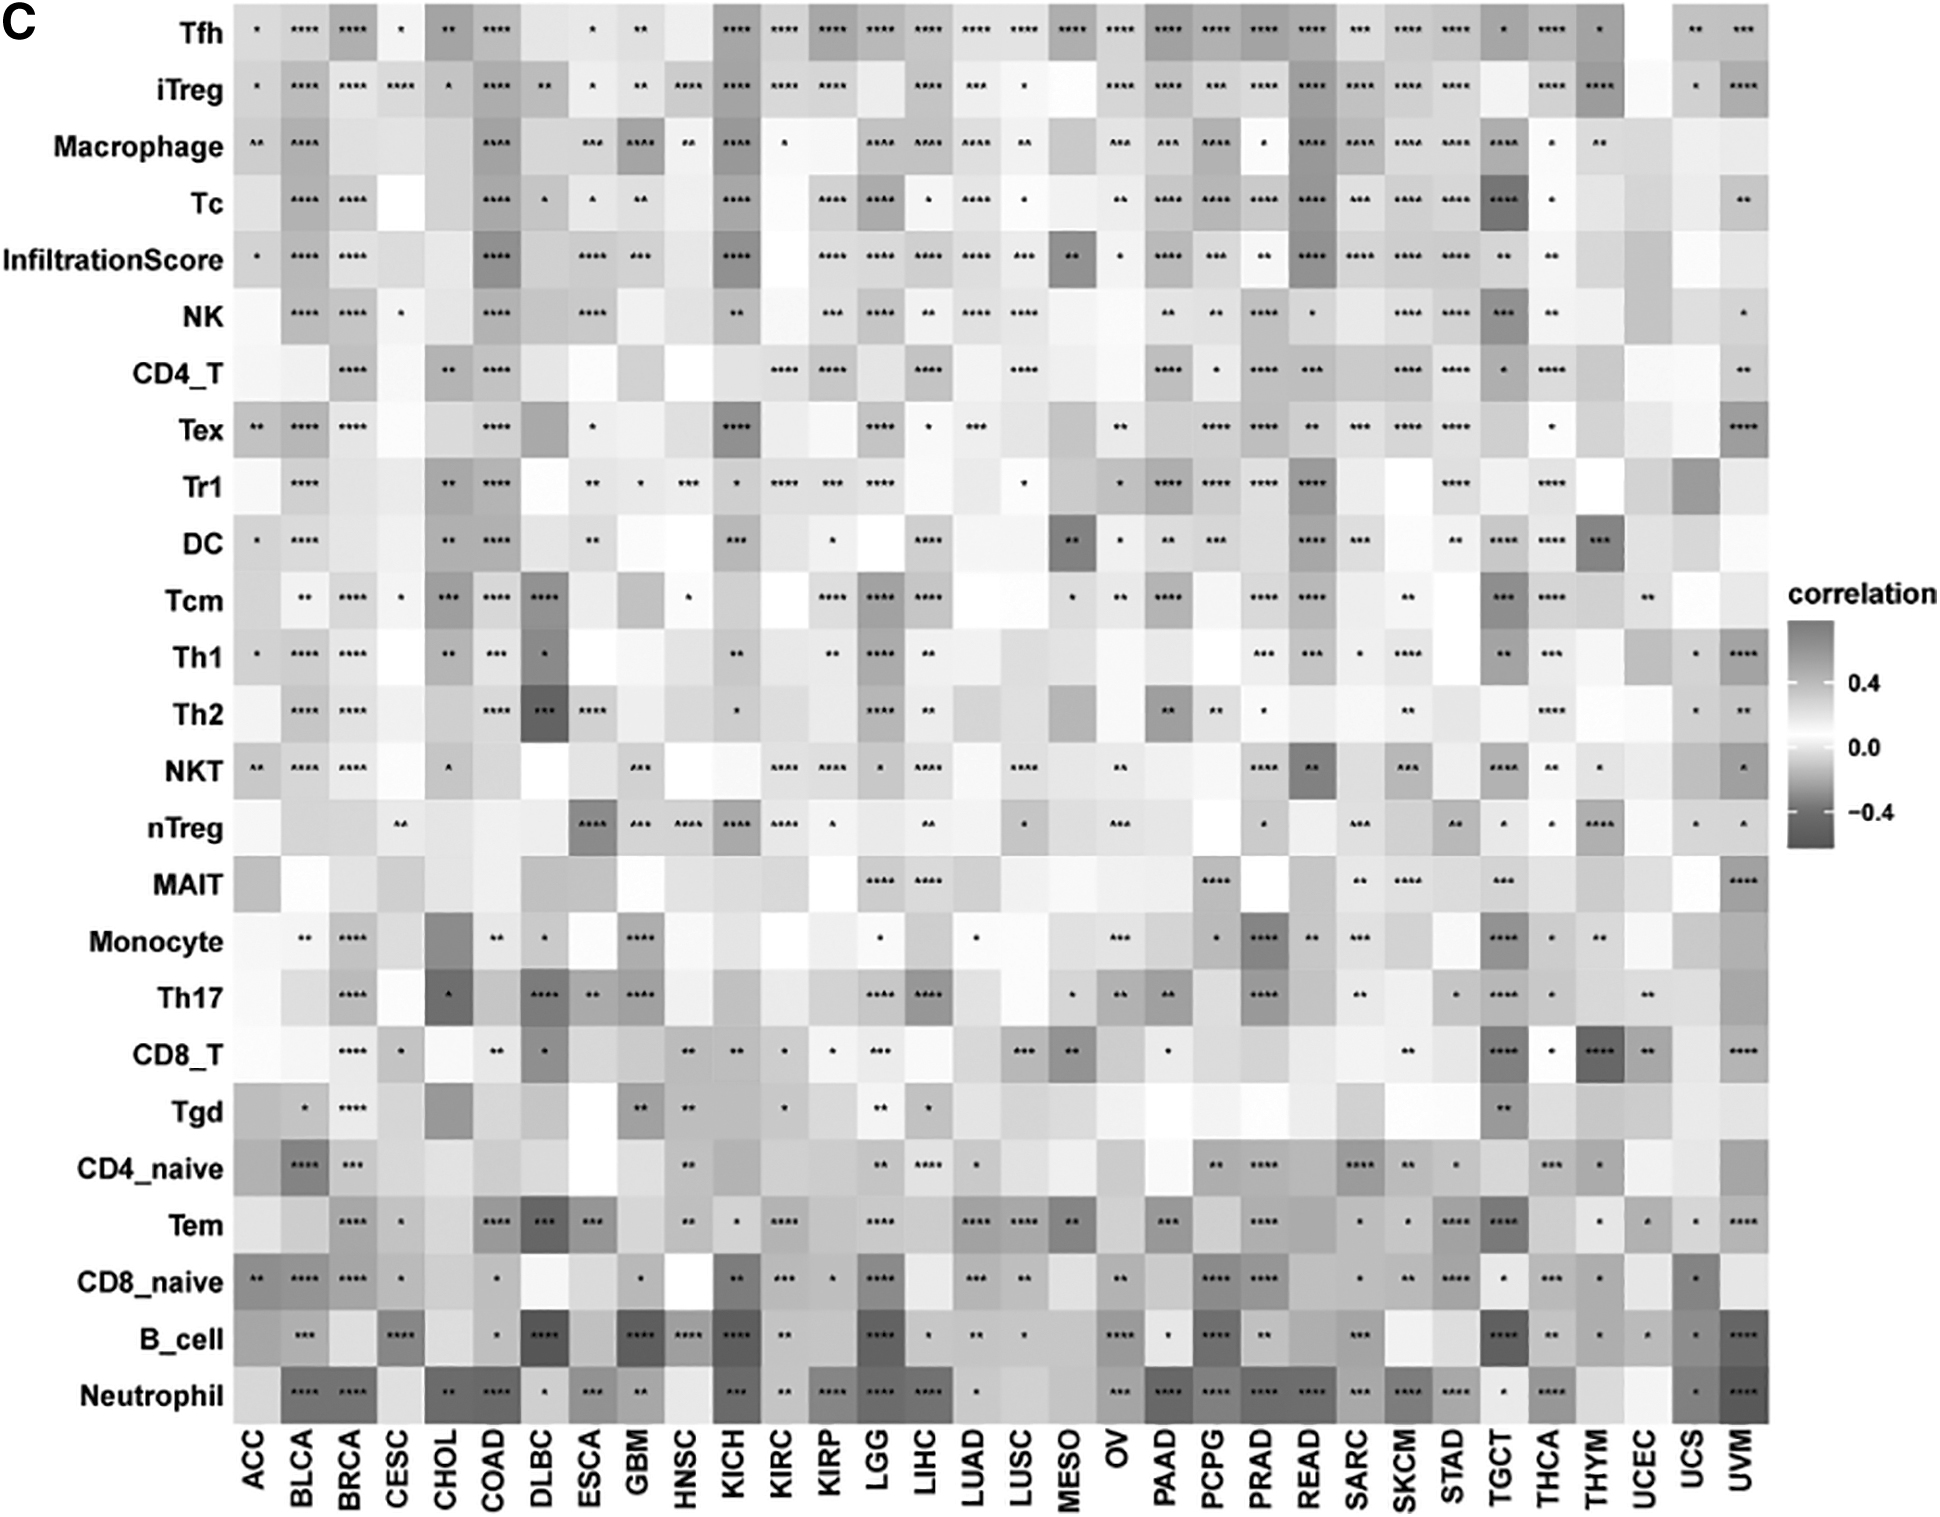
The relationship between SOCS3 and macrophages (Fig. 5A) and fibroblasts (Fig. 5B) was explored, and the results showed that SOCS3 was related to macrophages and fibroblasts in most kinds of cancers. Furthermore, we assessed the association between SOCS3 and tumor-infiltrating immune cells in cancer. Figure 5C shows that SOCS3 had a higher correlation with Tfh cells, iTregs, and macrophages. In ESCA, SOCS3 was significantly related to macrophages, the infiltration score, and NK cells.
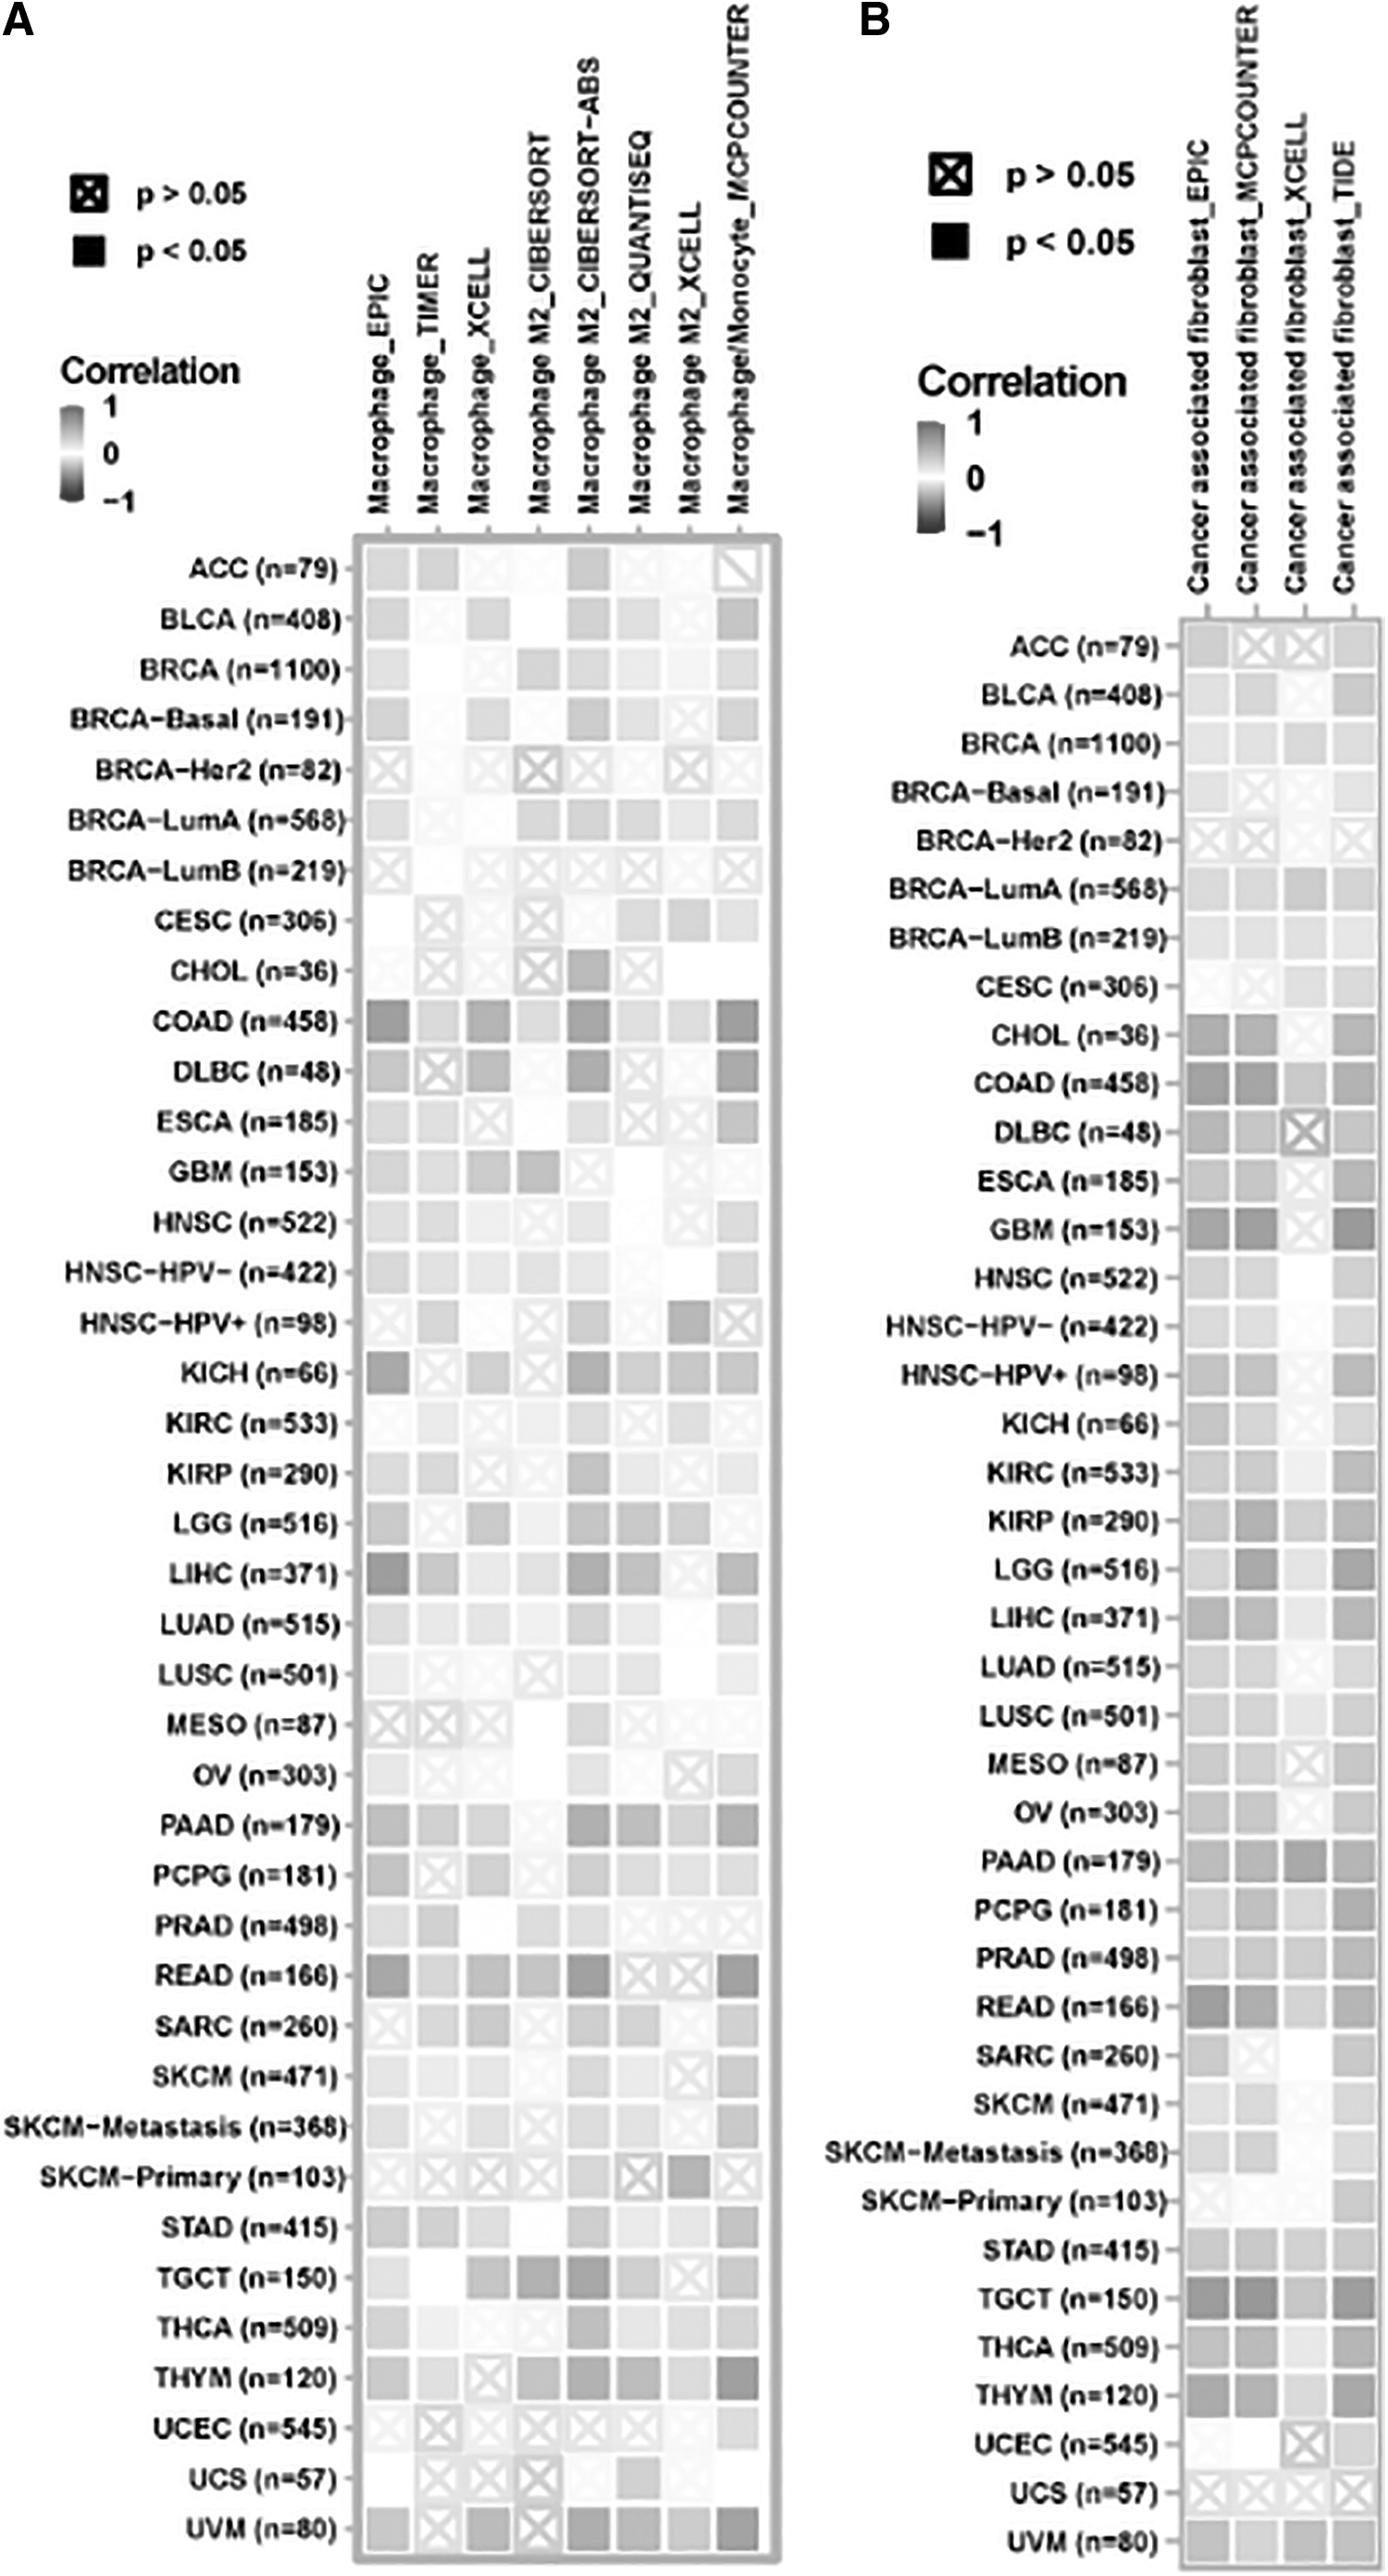
The association of tumor-infiltrating immune cells and SOCS3 expression in pancancers.
Expression of certain immune checkpoint genes and SOCS3
Immune checkpoints are a class of inhibitory molecules that provide protection for the human immune system. The mRNA sequence database allowed us to assess the link between SOCS3 expression and checkpoint gene expression levels.
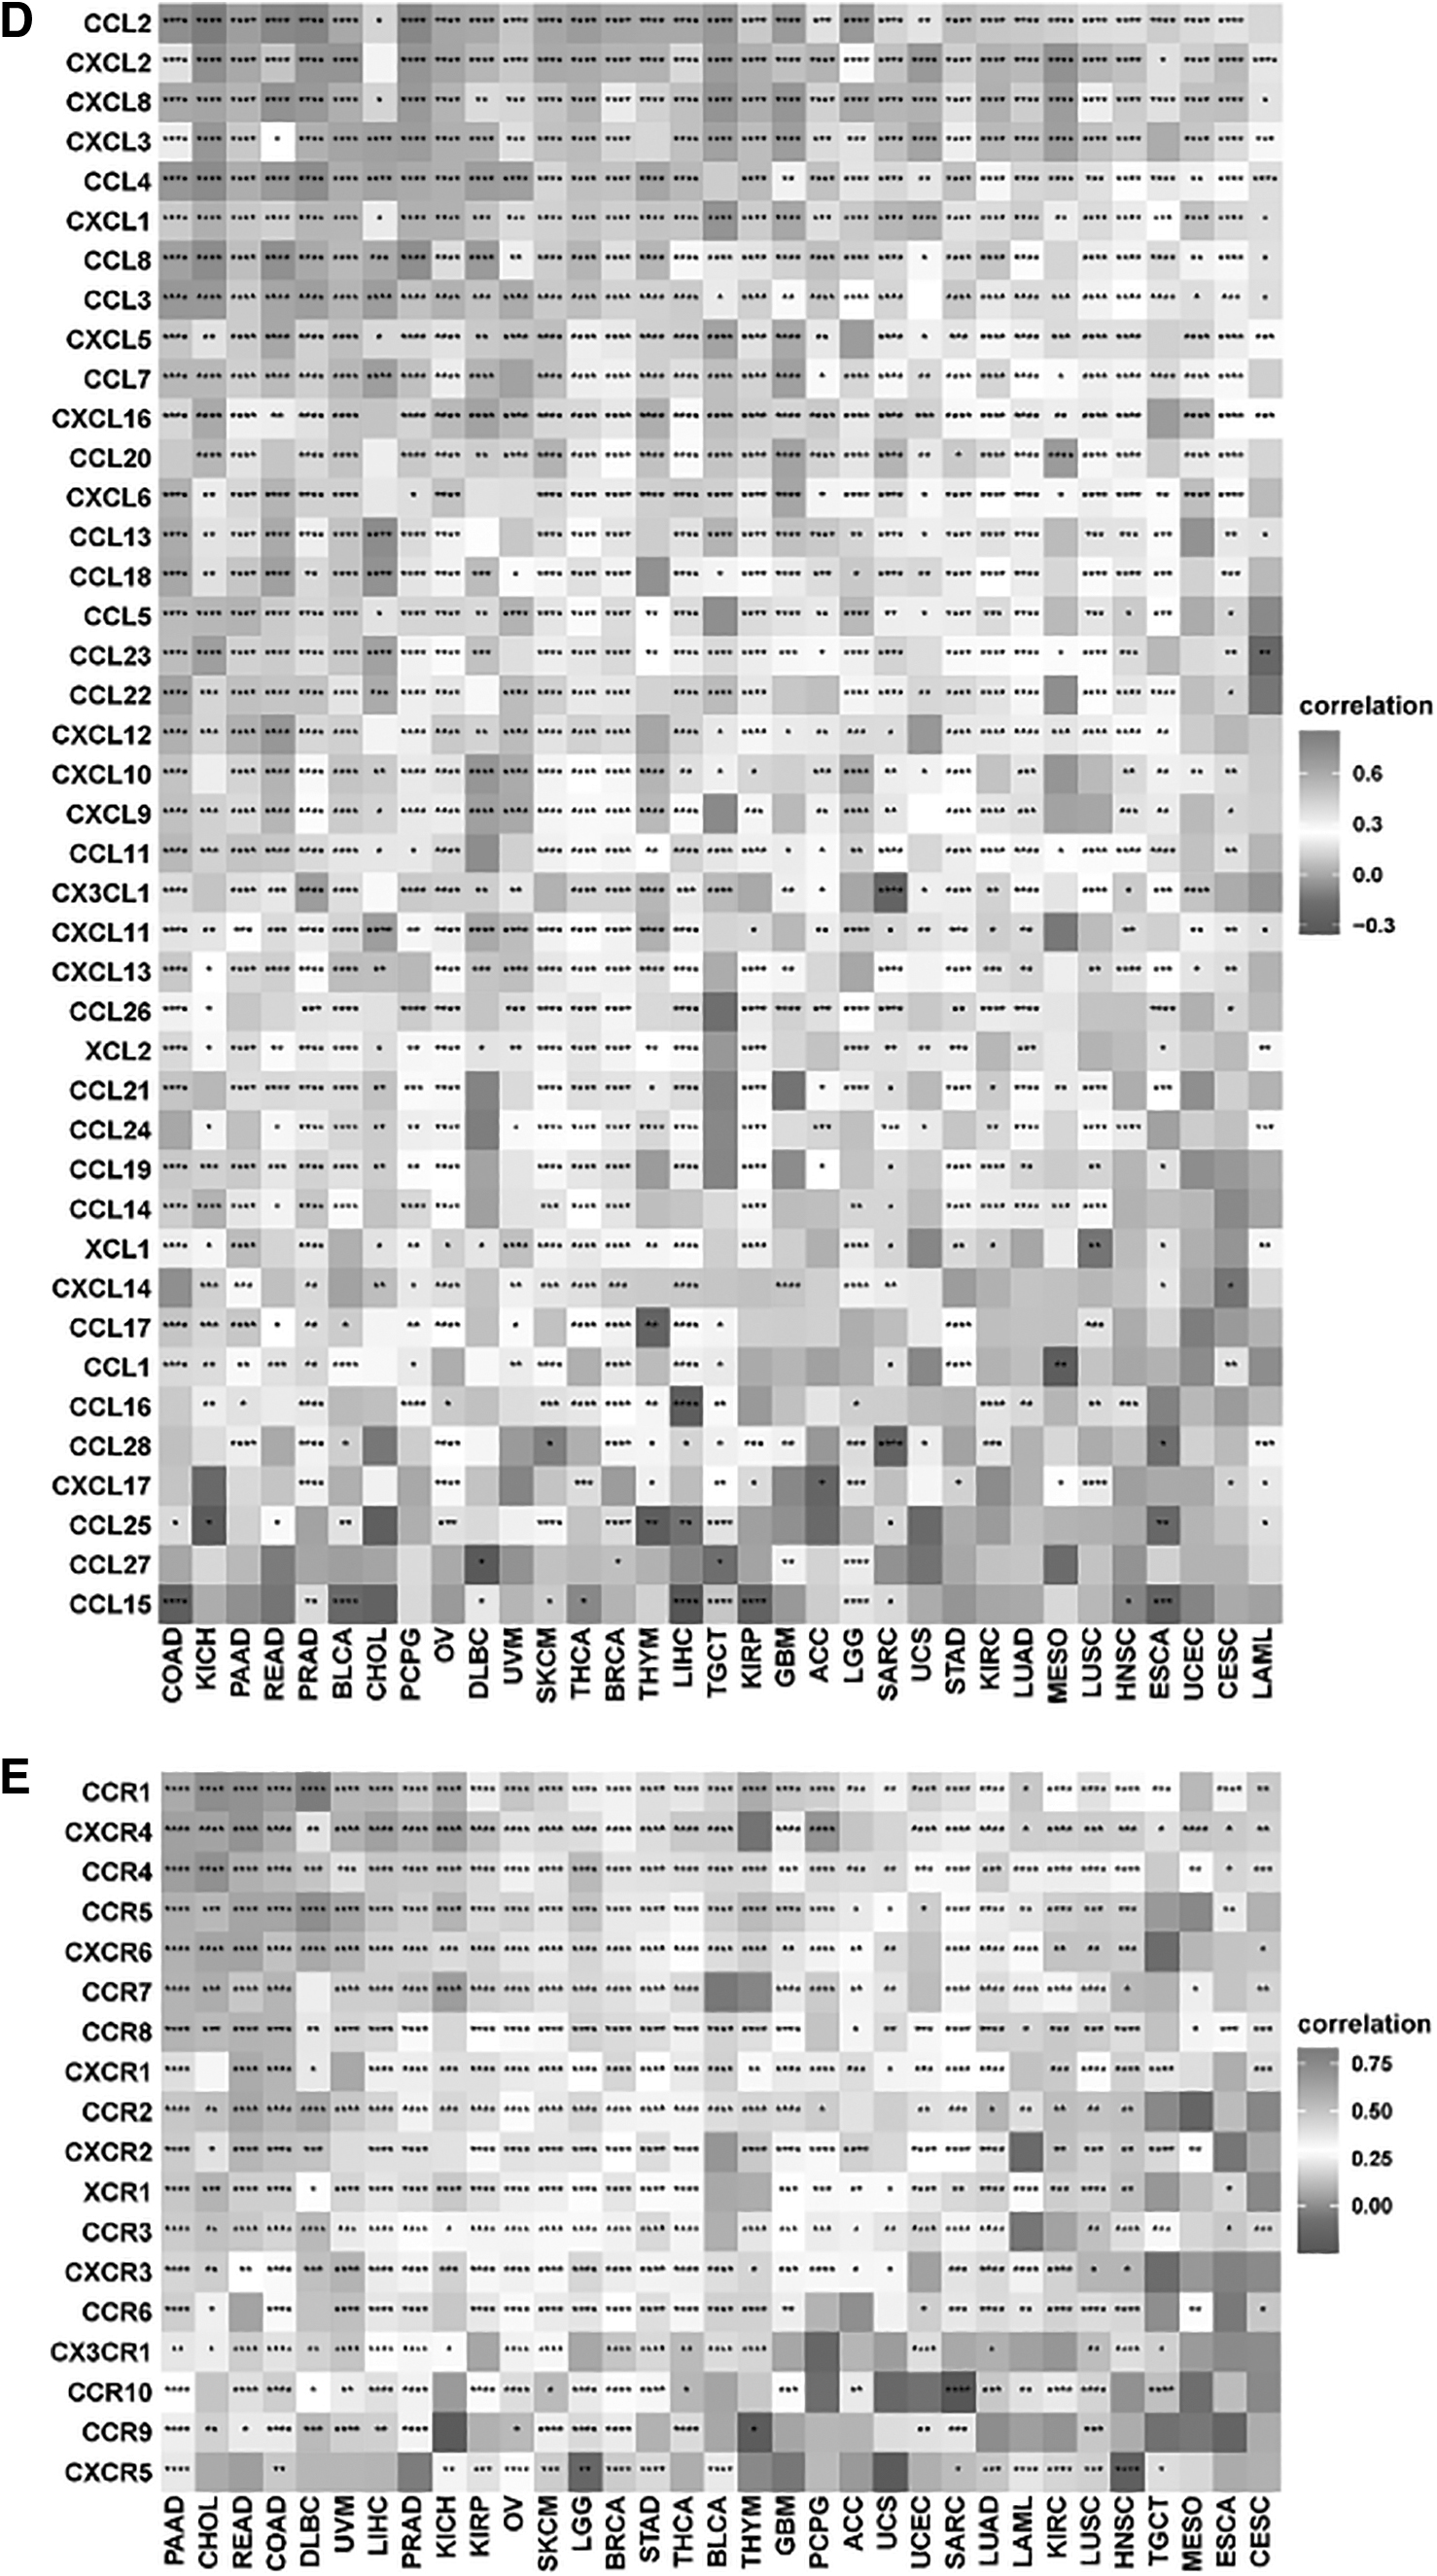
Figure 6A shows that in ESCA, a significant association between SOCS3 and a variety of immune checkpoint genes was detected, including LAG3, TIGIT, CTLA4, and PDCD1. Across cancers, SOCS3 was correlated with most genes involved in MHC, immunosuppressive genes, chemokines, and chemokine receptors (Fig. 6B–E).
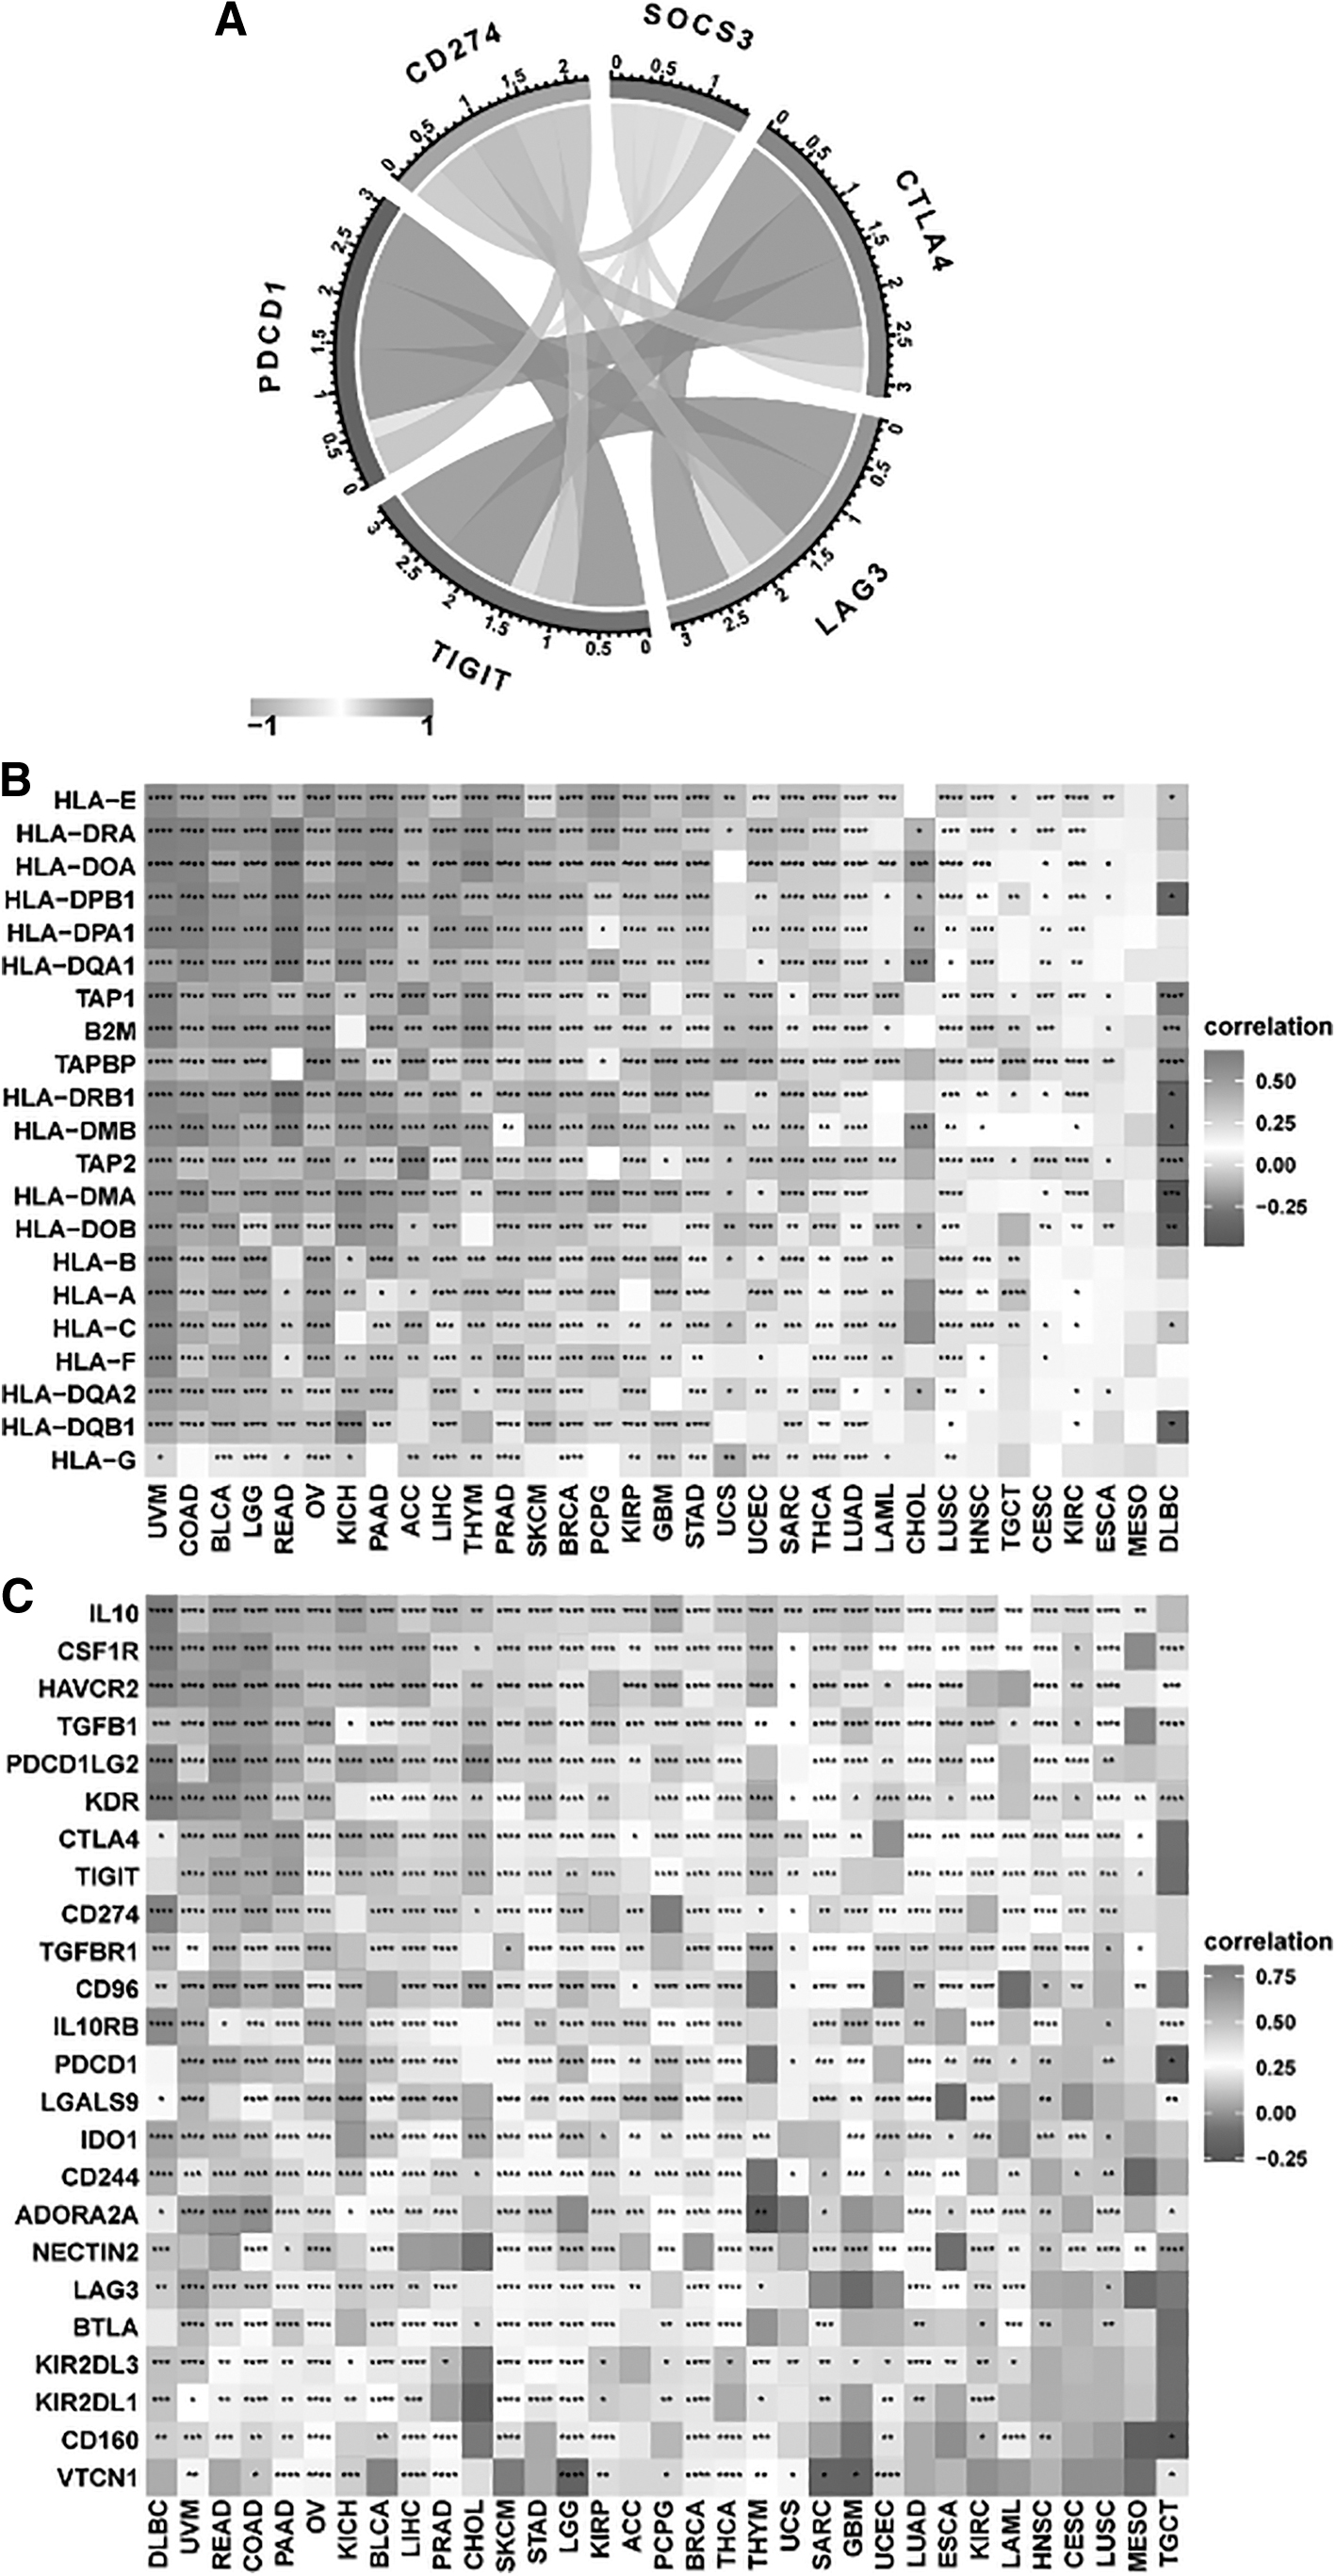
Relationship between immune checkpoints, MHC, immunosuppressive gene, chemokine, chemokine receptor, and SOCS3 mRNA expression levels in pancancers.
Meanwhile, Fig. 7 shows that the three most common mutations that occurred in ESCA patients with dysregulated SOCS3 expression were TP53, TTN, and MUC16 (Fig. 7A, B). Significantly different expression levels of NFE2L2 and DNAH11 were found between high SOCS3 expression and low SOCS3 expression in ESCA patients (Fig. 7C).
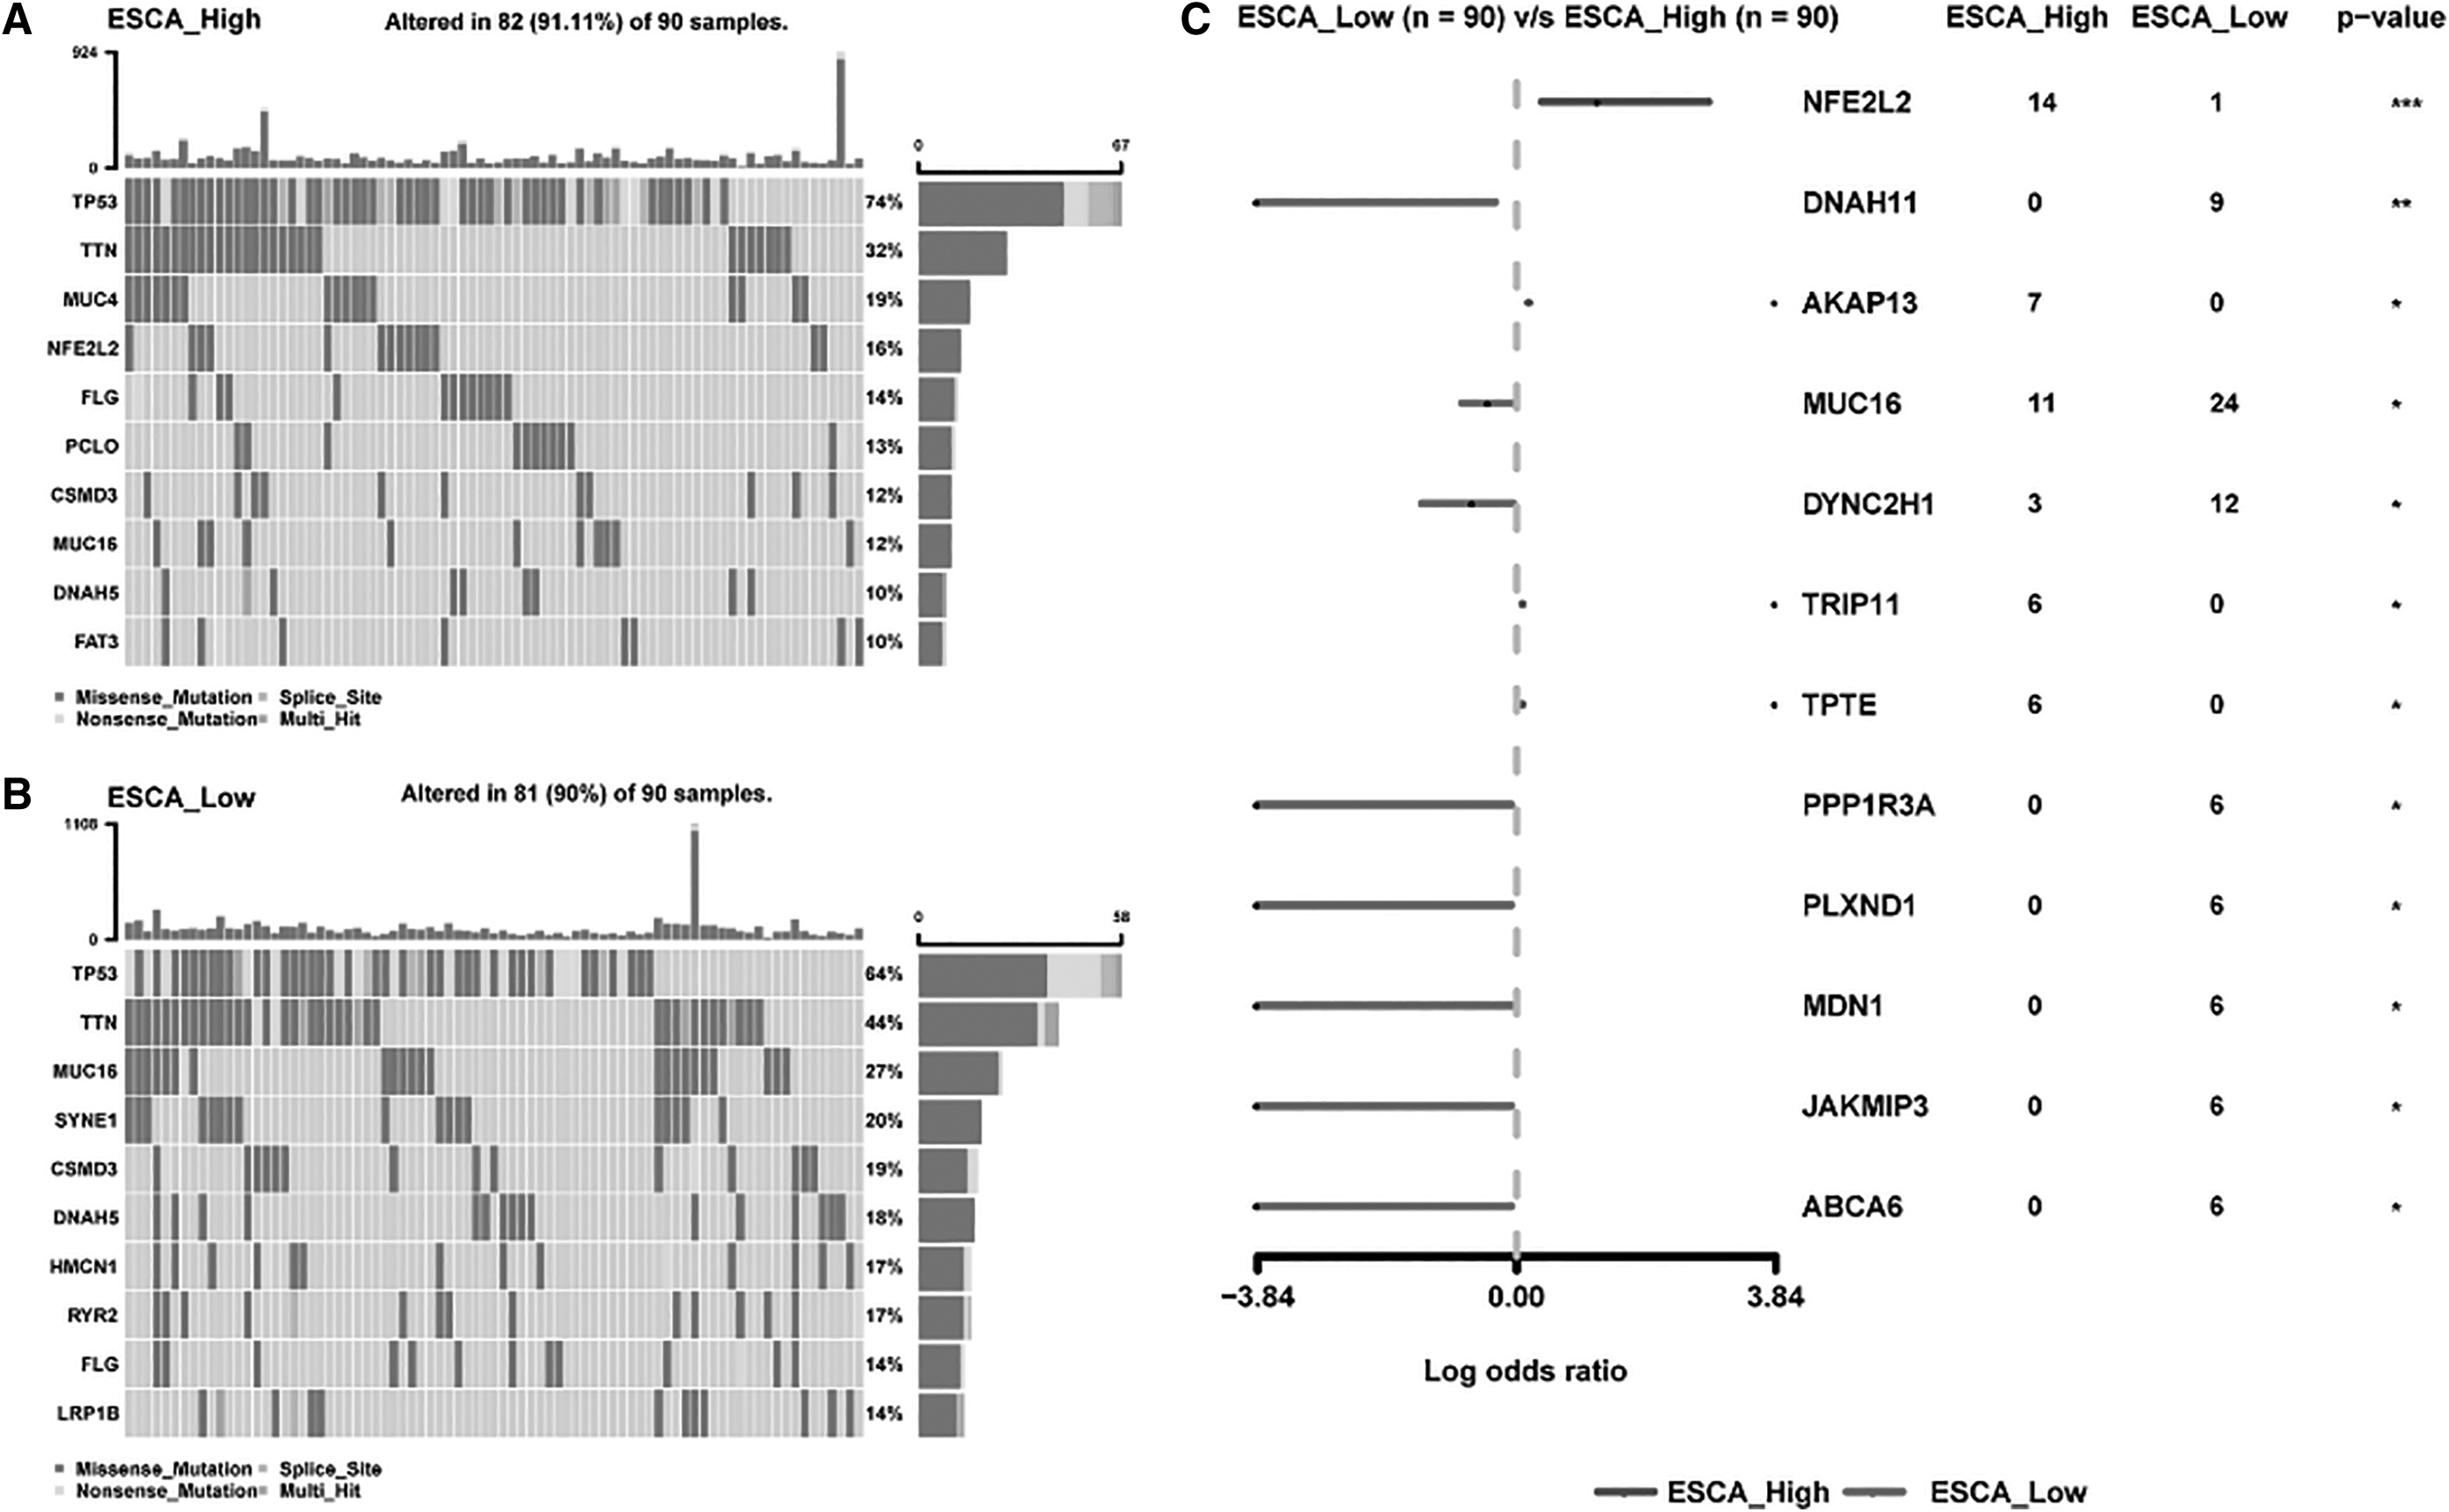
Top 10 mutation genes in high- and low-SOCS3 expression in ESCA.
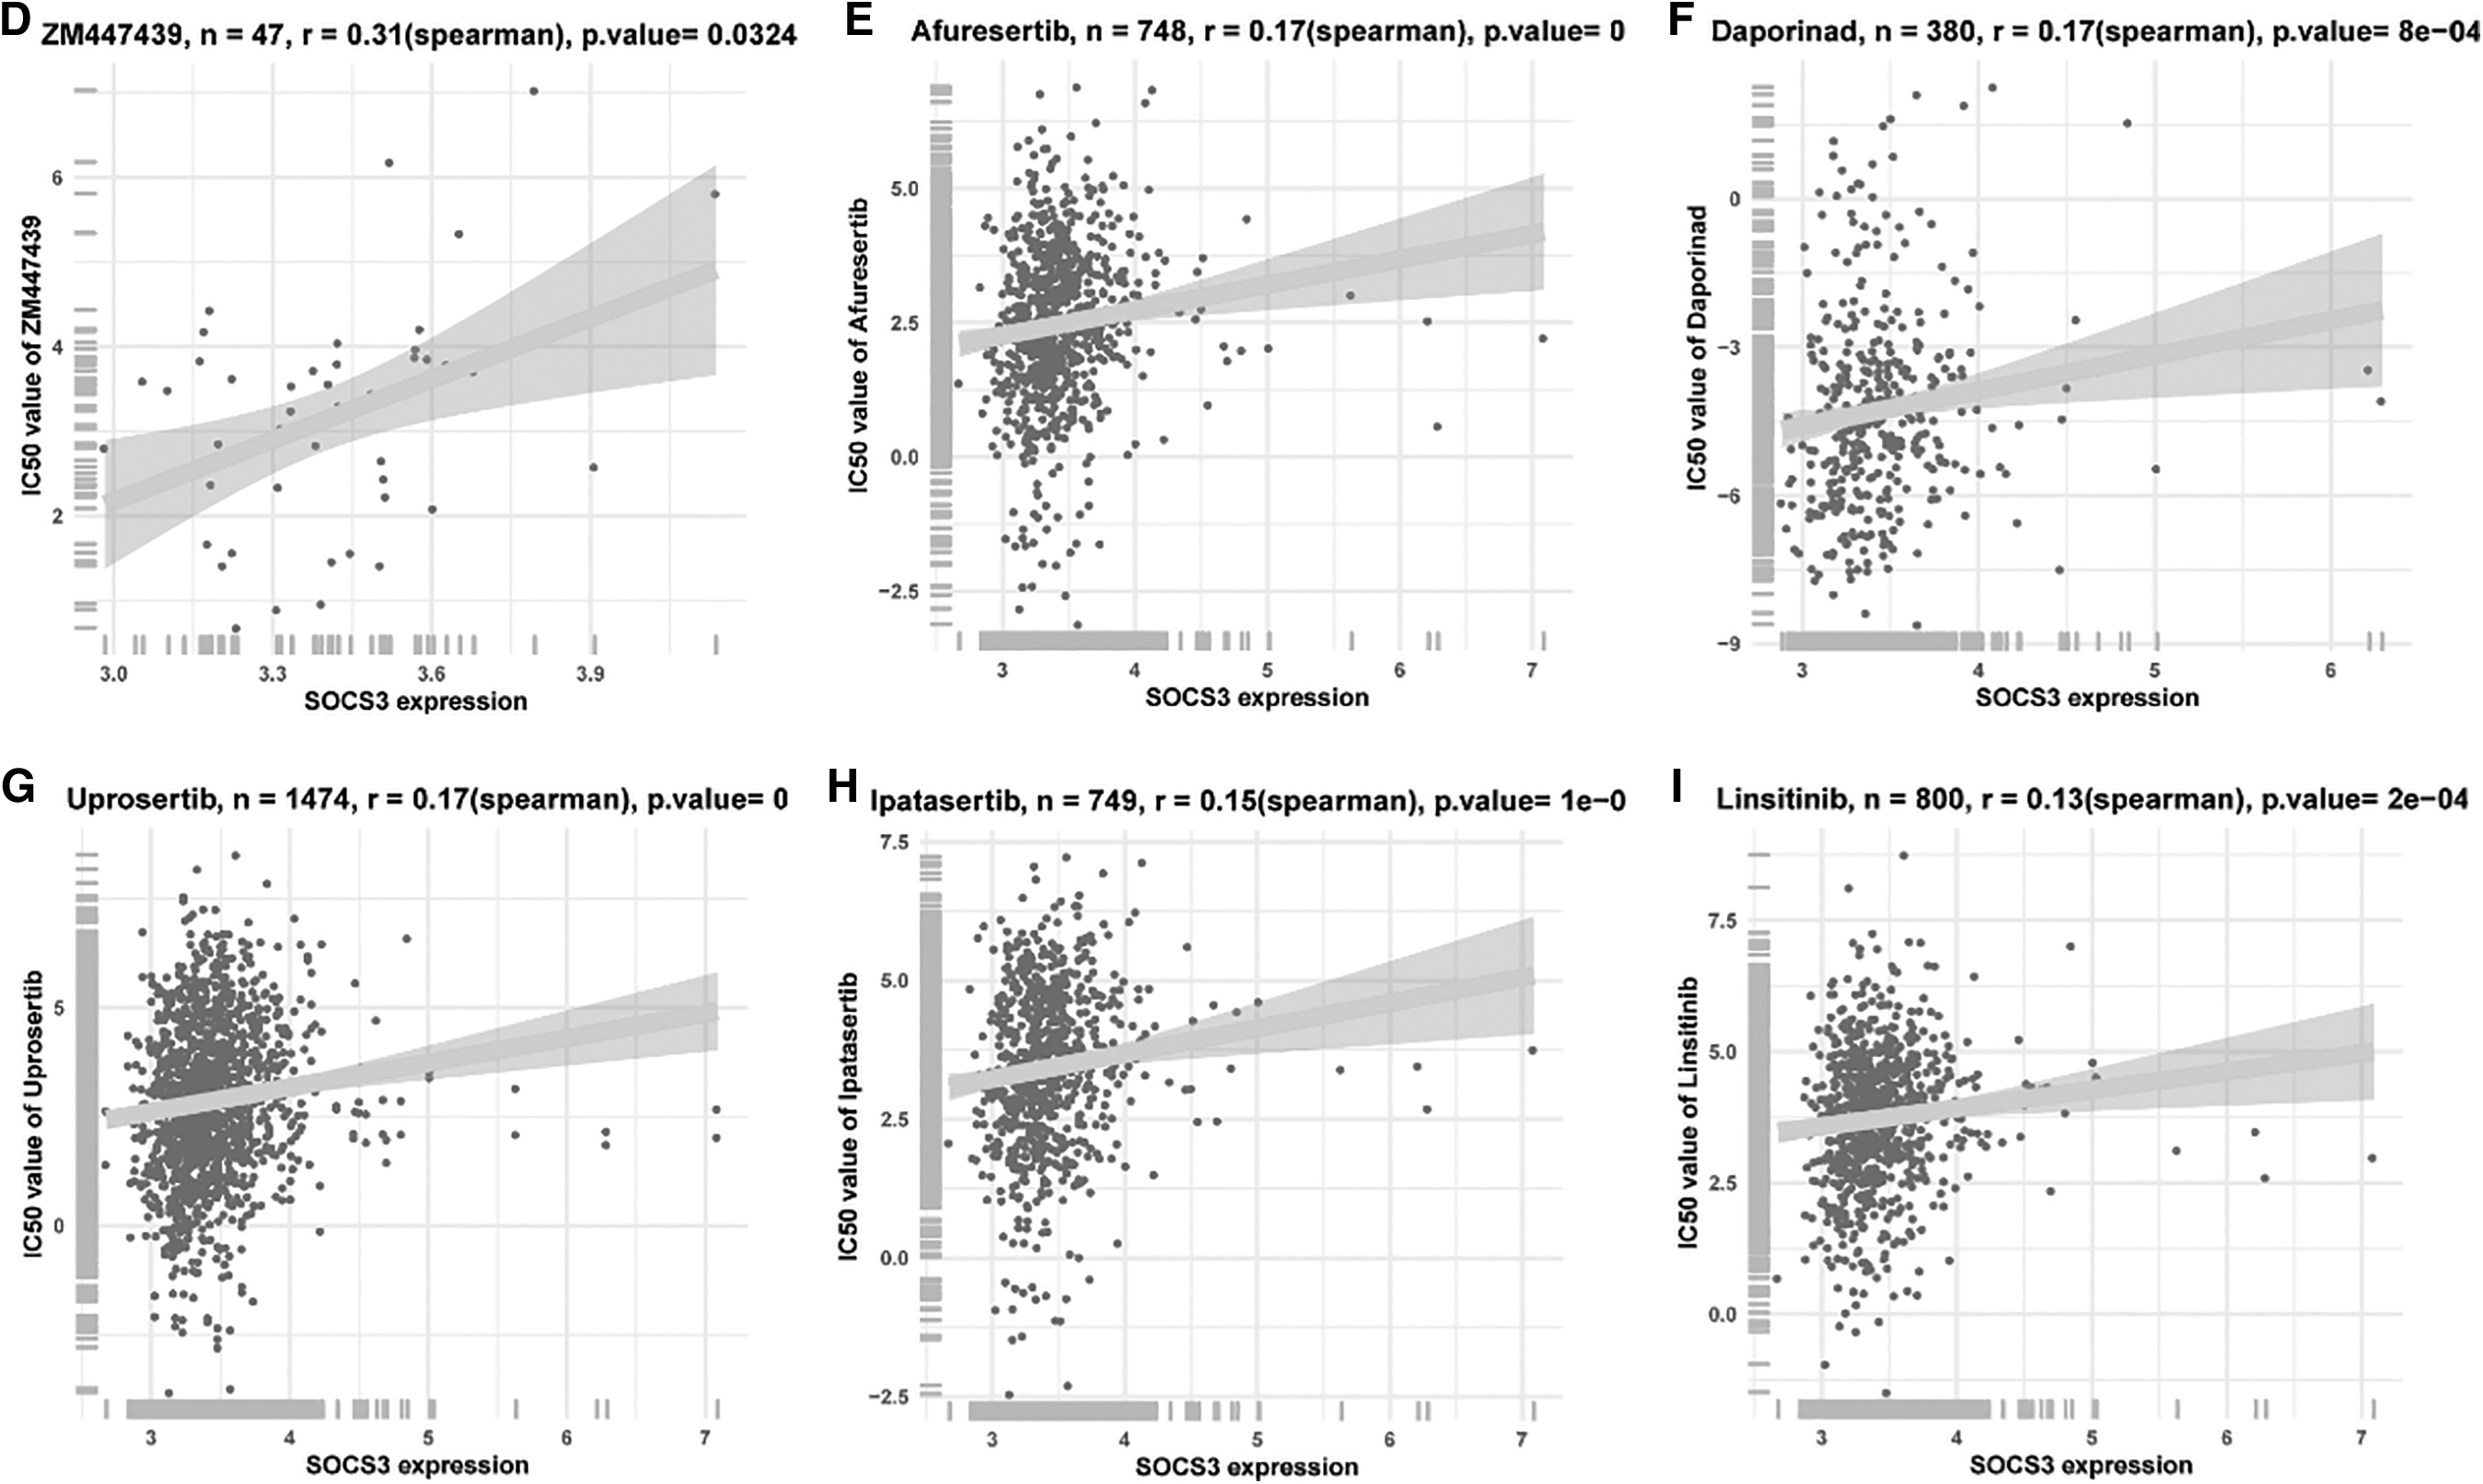
Analysis of drug sensitivity related to SOCS3
The sensitivities of 198 kinds of drugs related to SOCS3 were investigated. SOCS3 was found to be related to 59 kinds of drug sensitivities (Supplementary Table S1), including ZM447439 (r = 0.31, p = 0.0324), afuresertib (r = 0.17, p < 0.001), daporinad (r = 0.17, p < 0.001), uprosertib (r = 0.17, p < 0.001), lpatasertib (r = 0.15, p < 0.001), and linsitinib (r = 0.13, p < 0.001; Fig. 7D–I).
Upregulated SOCS3 expression levels
Compared with that in HEECs, SOCS3 mRNA levels were significantly upregulated in EC9706 and ECA109 cells. Meanwhile, the expression level of SOCS3 protein was also assessed using Western blotting, and the results showed that the expression level of SOCS3 in ECA109 and EC9706 cells was significantly higher than that in HEECs (Fig. 8A, B). Furthermore, to validate the classical ESCA tissue microarray methodology, we directly compared SOCS3 expression on the tissue microarray in 96 tumor cases, 96 corresponding adjacent tissues, and 1 normal tissue. We found that SOCS3 expression was upregulated in most tumor tissues (Fig. 8C).
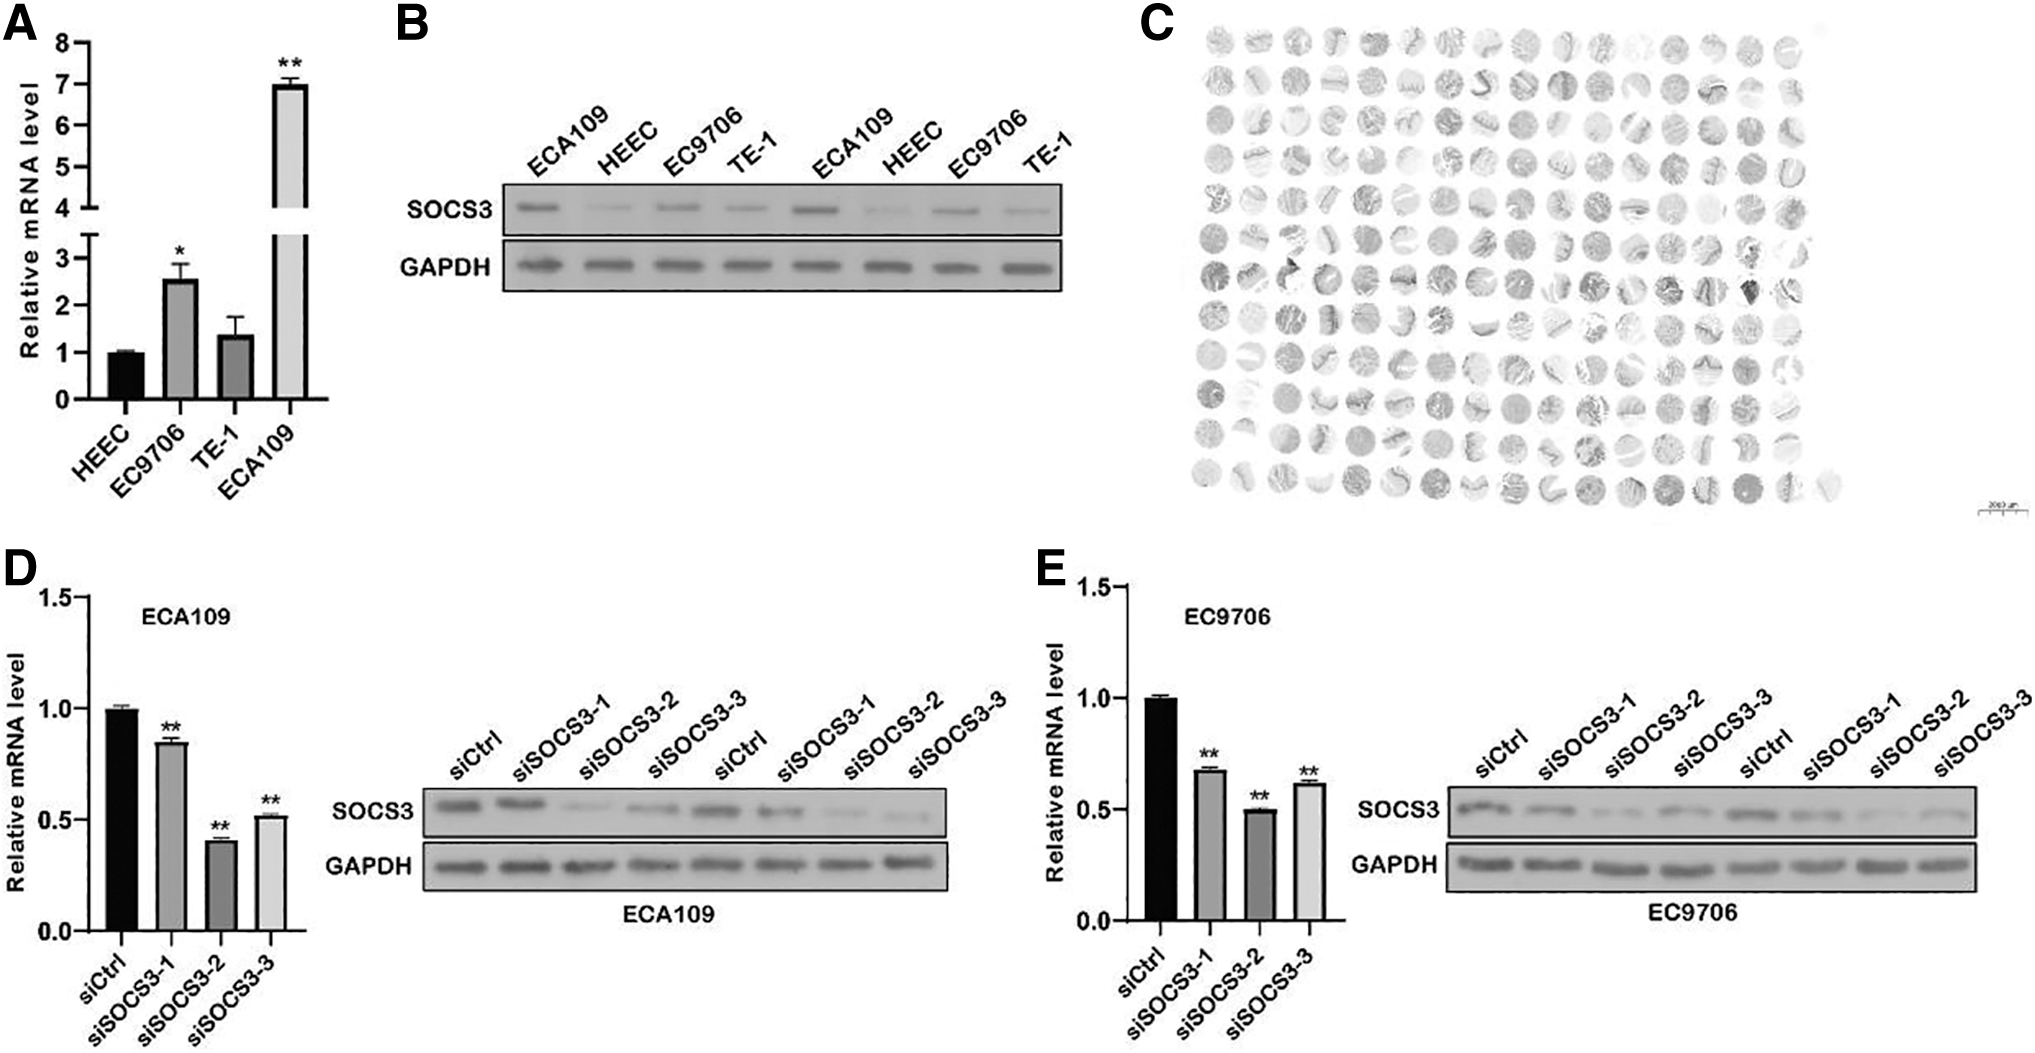
Expression of SOCS3 identified by qRT-PCR and Western blot. The expression of SOCS3 gene in EC9706 and ECA109 indicated that the transfection was successful.
The SOCS3 siRNA model was successfully constructed
Compared with the siCtrl group, the SOCS3 mRNA level was significantly decreased in both EC9706 and ECA109 cells (all p < 0.01). Meanwhile, the Western blot results also confirmed the decreased expression of SOCS3 in both ECA109 (Fig. 8D) and EC9706 (Fig. 8E) cells after siSOCS3-1, siSOCS3-2, and siSOCS3-3 transfection. We found that 15%, 59%, and 48% decrease in SOCS-3 mRNA compared with the controls in the two cell lines.
The function of SOCS3 in cell proliferation, apoptosis, migration, invasion, and the cell cycle
The function of SOCS3 in cell invasion and cell proliferation was assessed in both the ECA 109 cell line and the EC 9706 cell line.
CCK8 analysis showed that siRNA knockdown of SOCS3 reduced the proliferation ability compared with that of the siCtrl group in ECA 109 cells. The similar cell performance of EC 9706 was observed with ECA 109 with siRNA SOCS3 (Fig. 9A). Meanwhile, we found significantly increased cell apoptosis in the siSOCS3 group compared with the siCtrl group (p < 0.05; Fig. 9B). Compared with the blank group, the migration and invasion abilities of ECA109 cells with SOCS3 knockdown significantly decreased after 48 h (p < 0.05; Fig. 9C). Meanwhile, we observed that the number of cell clones in the siSOCS3 group was significantly reduced (Fig. 9D). Transwell analysis and cell invasion analysis showed a decreased transfer rate (p < 0.01; Fig. 9E) and cell invasion and metastasis rate (p < 0.01; Fig. 9F) after knockdown of SOCS3.
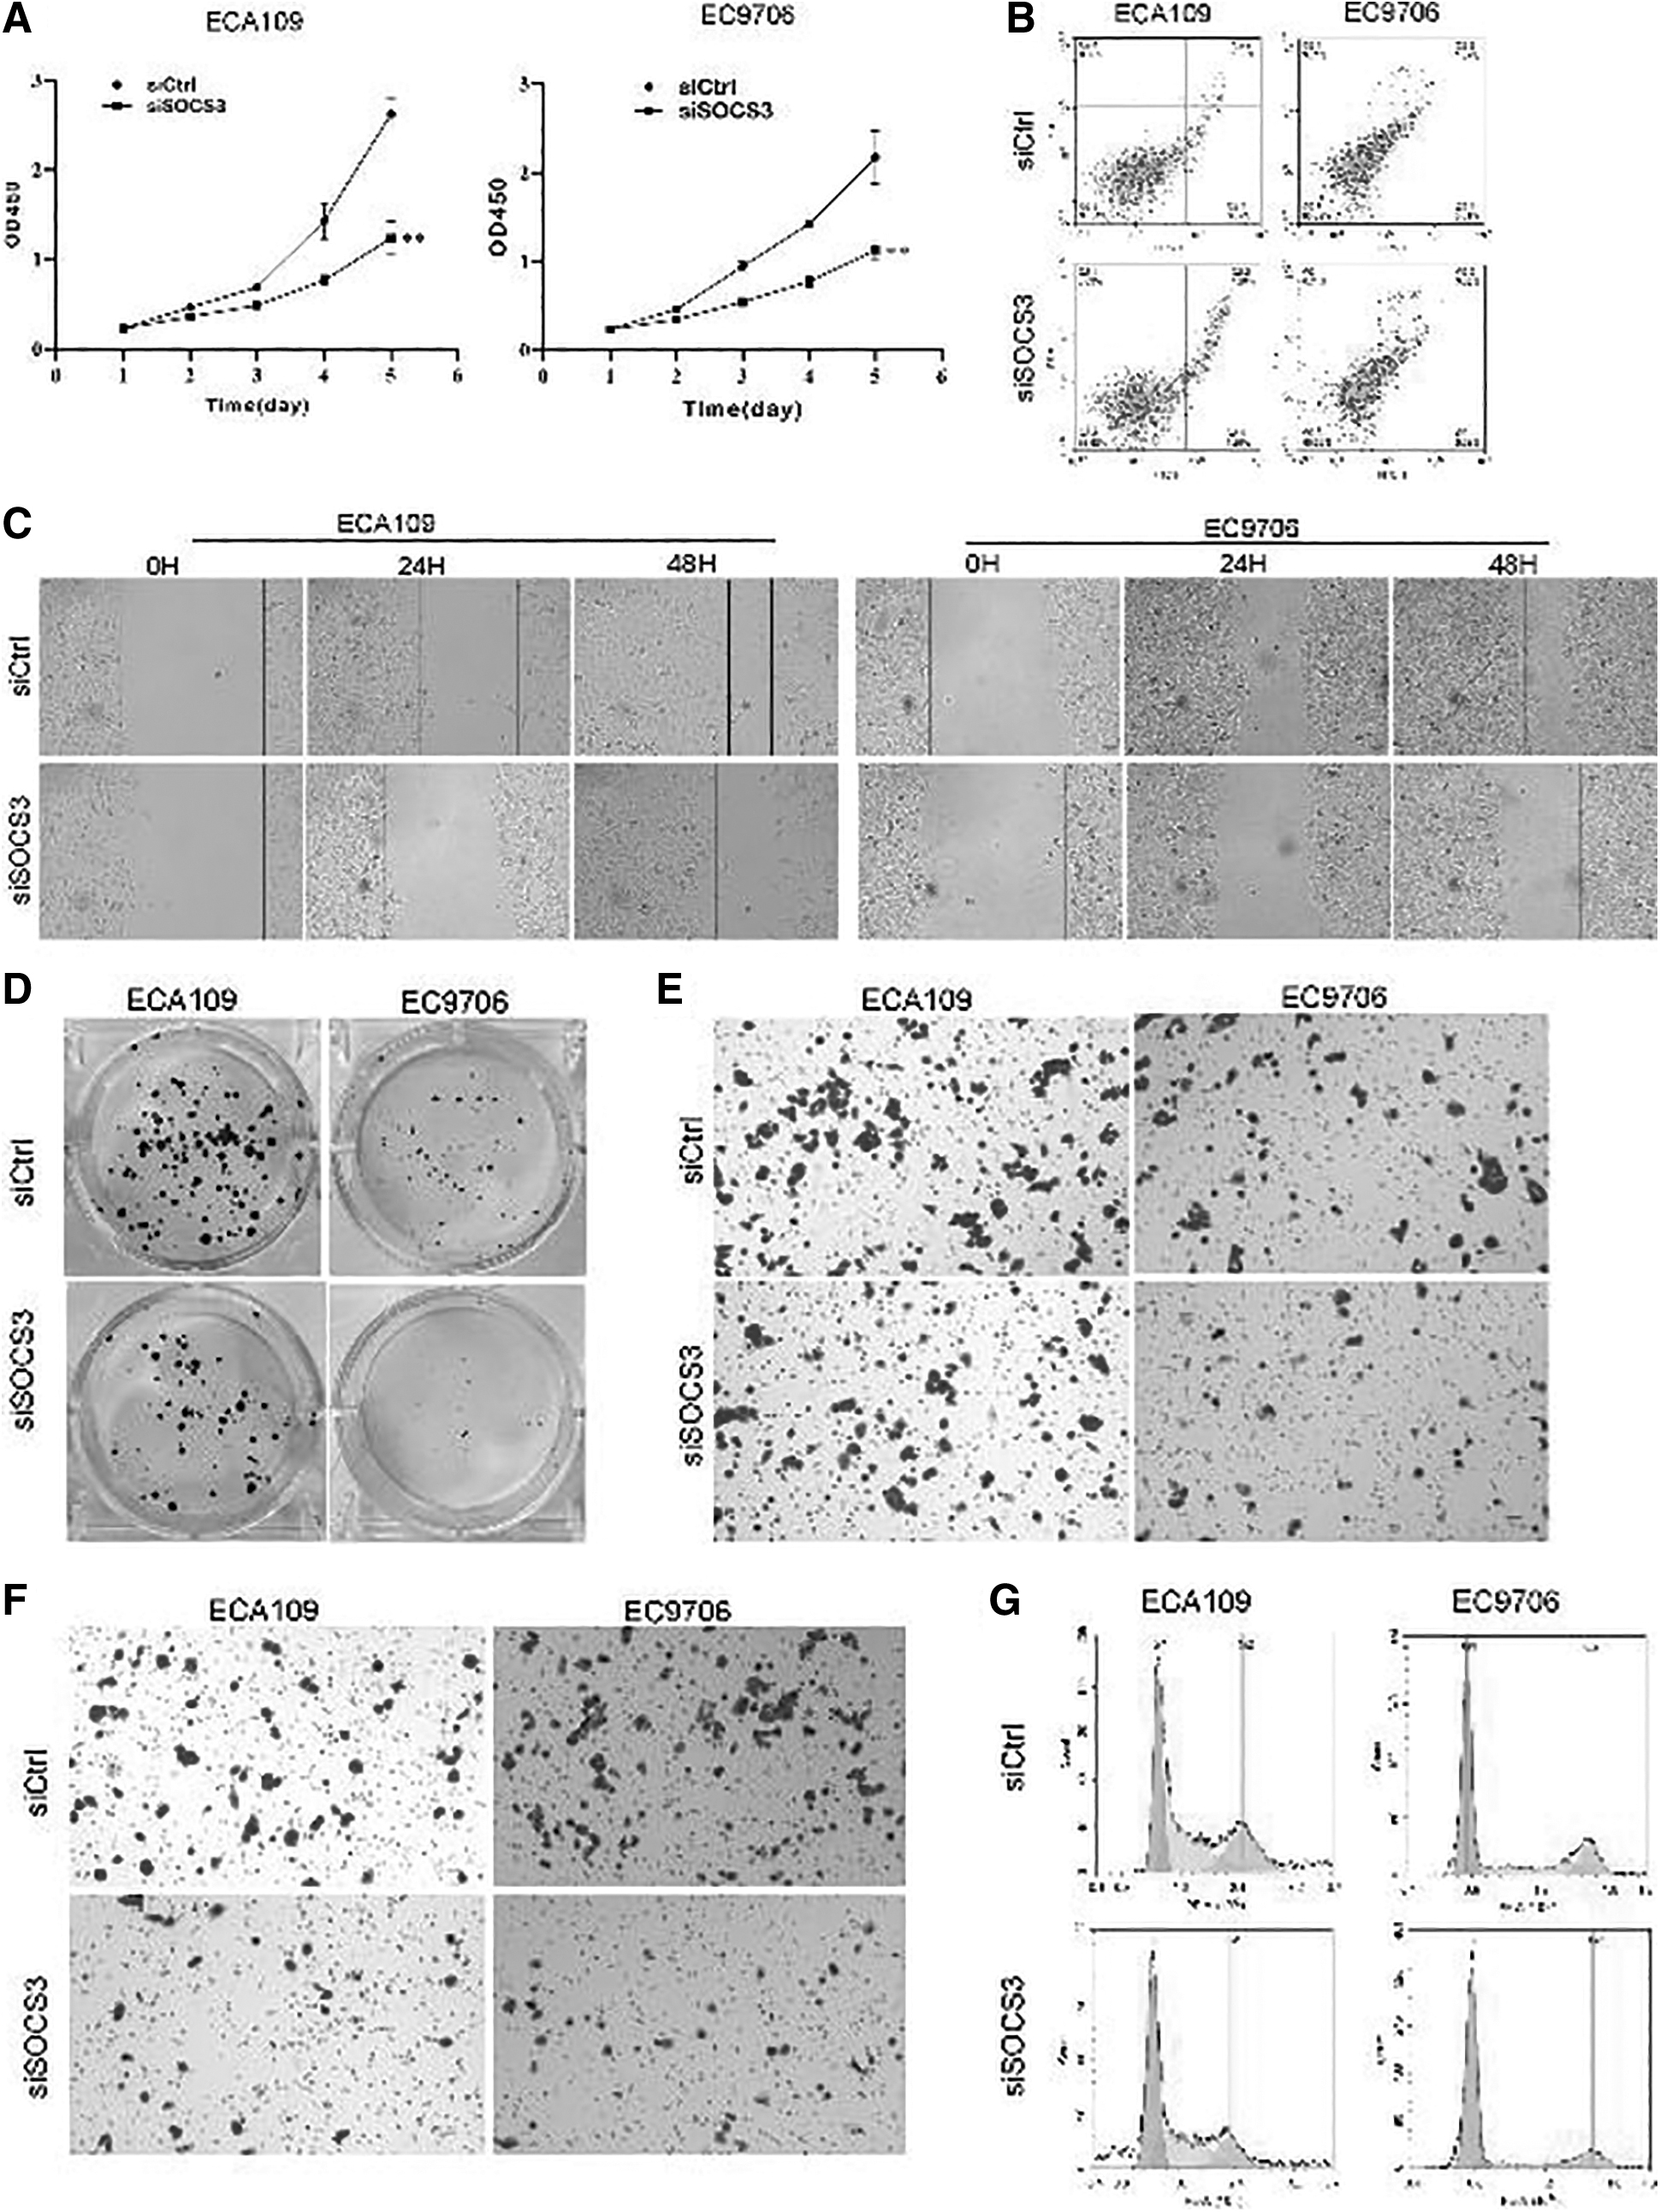
Cell proliferation, cell apoptosis, cell migration, cell clones, transfer rate, cell invasion and metastasis rate, and cell cycle of ECA109 and EC9706 following knockdown of the SOCS3 gene.
Compared with the control group, the cells in the S phase of the siSOCS3 group were significantly reduced (p < 0.05), the cells in G2/M had no significant change (p > 0.05), and the cells in the G1 phase were significantly increased (p < 0.05; Fig. 9G).
Relationship between SOCS3 expression levels and the NF-κB pathway
To examine the association between SOCS3 expression levels and the NF-κB pathway, the levels of P65, P52, P50, IKB-α, and TNF-α were measured using Western blotting. The results demonstrated that knockdown of SOCS3 induced downregulated P65, P52, and P50 expression levels and increased IKB-α and TNF-α expression levels in both ECA109 (Fig. 10A) and EC9706 cells (Fig. 10B).
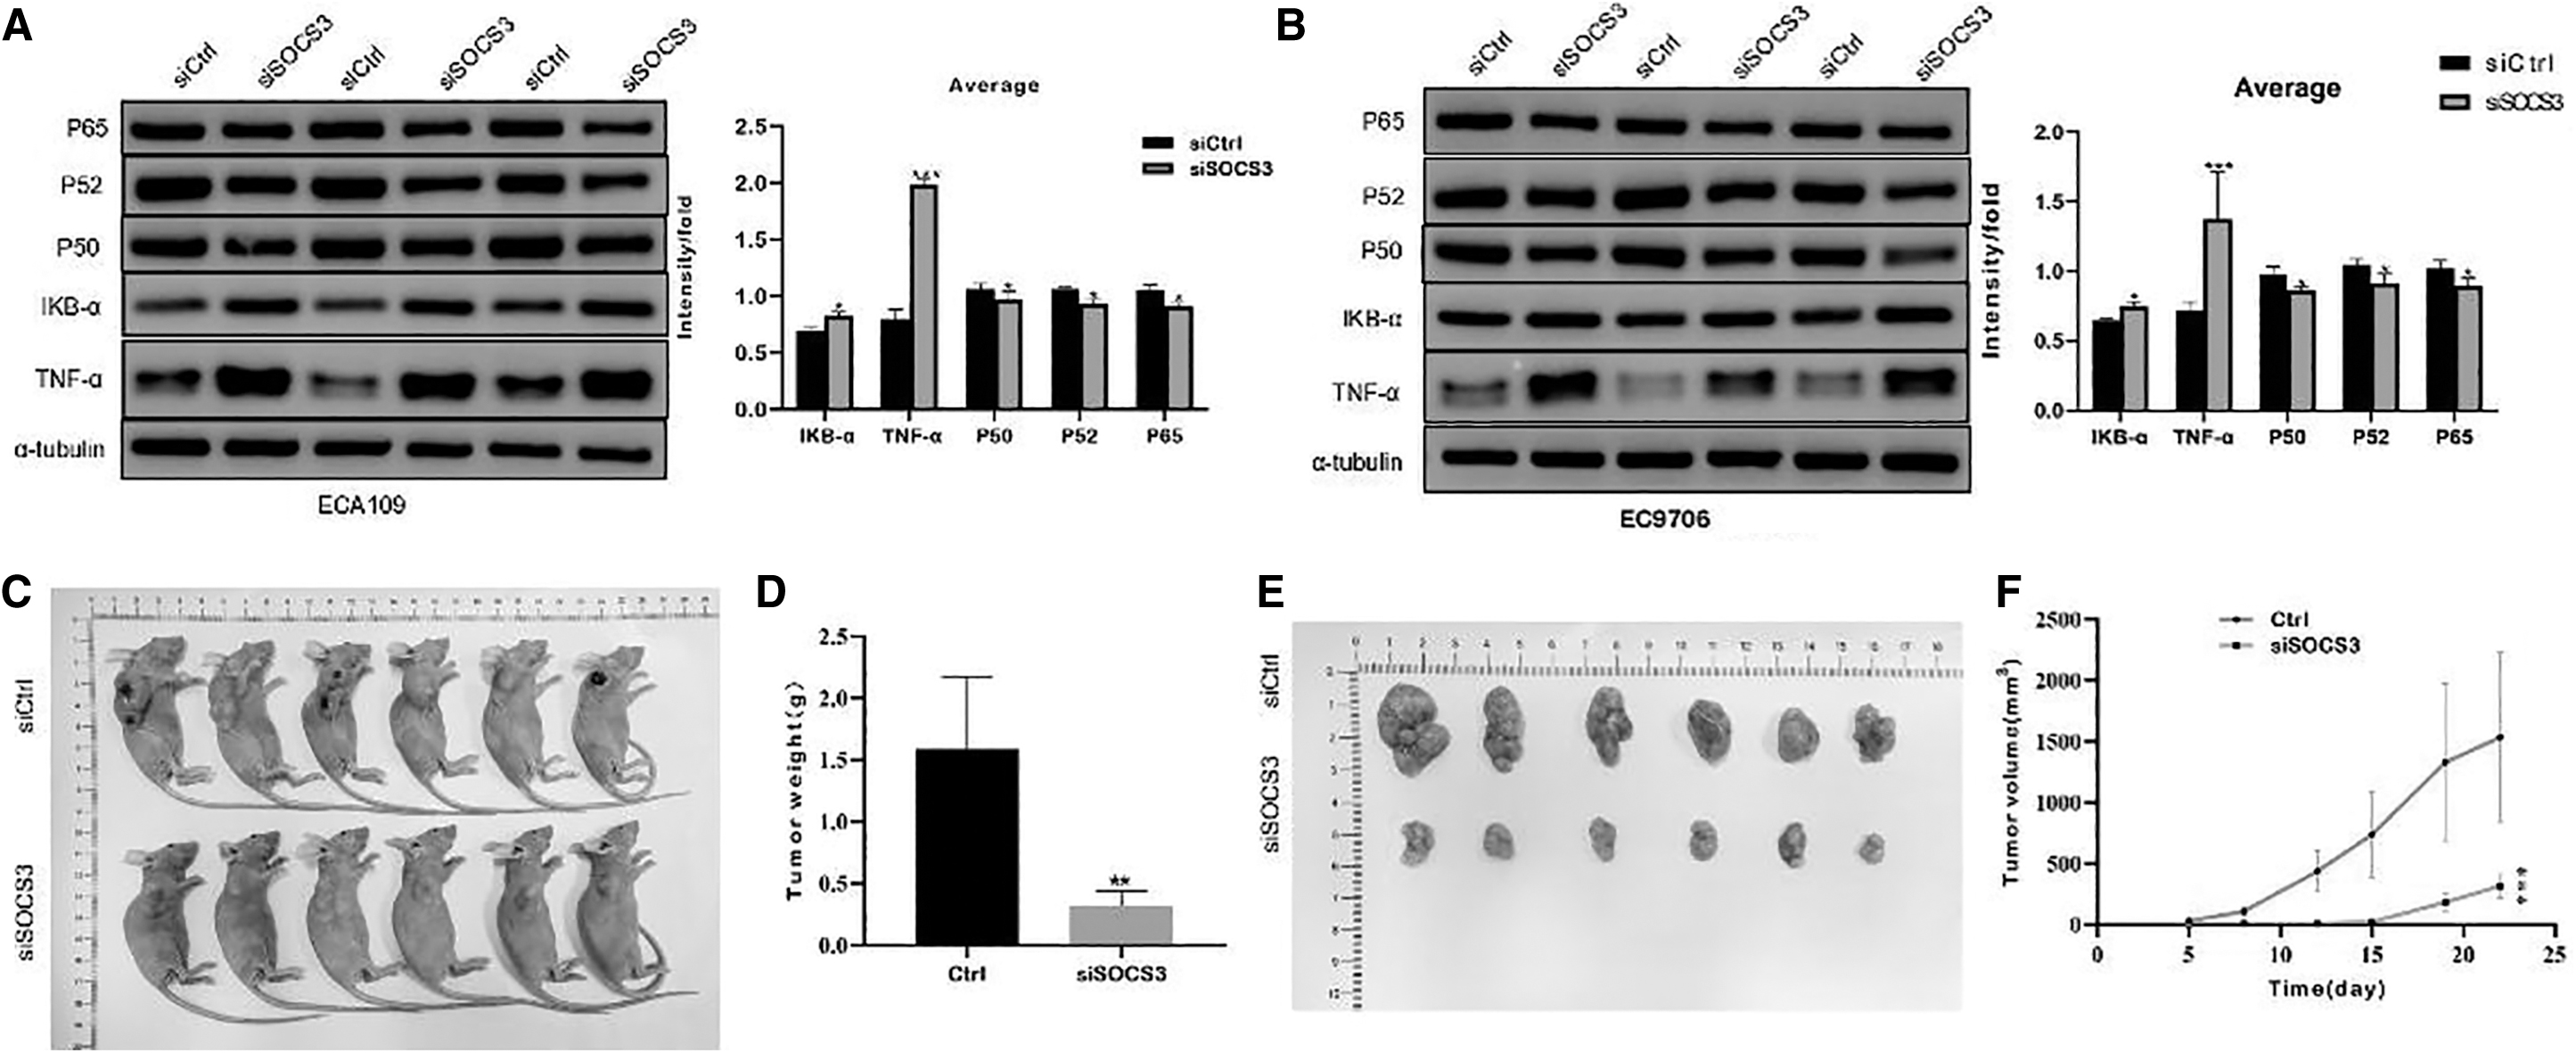
Protein expression levels of five genes P65, P52, P50, IKB-α, TNF-α in cells with SOCS3 knockdown and ESCA cell lines with SOCS3 knockdown were injected into nude mice to analyze tumorigenesis in vivo.
The effect of SOCS3 on tumorigenesis
The effect of SOCS3 on the tumorigenesis of ESCA cells in vivo was analyzed. ESCA cells with SOCS3 knockdown showed reduced tumorigenicity in nude mice (Fig. 10C), and the isolated tumors are shown in Figure 10E. According to statistical analysis, SOCS3 knockdown significantly reduced tumor weight (p < 0.01; Fig. 10D) and tumor volume (Fig. 10F).
DISCUSSION
SOCS3, as one member of the SOCS family, is widely accepted as a cytokine-inducible negative regulator of cytokine signaling and has been demonstrated to have a potential function as a tumor suppressor. 3 In the present study, we investigated the expression level of SOCS3 across cancers and its association with prognosis by using TCGA, GTEx, and CCLE databases. The expression of SOCS3 was abnormal in 22 tumors, of which 12 were downregulated and 10 were upregulated. We confirmed the upregulated expression of SOCS3 in ESCA, and ESCA patients with low levels of SOCS3 had better overall survival.
Our research was basically consistent with the findings of Dai et al., 20 who also indicated that SOCS3 was downregulated in most TCGA cancer datasets, but highly expressed in brain tumors, breast cancer, esophageal cancer, colorectal cancer, and lymphoma through bioinformatics analysis, and they also indicated that high SOCS3 was associated with poor prognosis in most cancers. cBioPortal is an open-source software platform. Using this platform, we analyzed the mutation and amplification of SOCS3 across cancers and analyzed the correlation between SOCS3 expression and promoter methylation and CNA. We found that the mutation and amplification of SOCS3 were the main causes of the dysregulated expression of SOCS3 across cancers. In ESCA, the expression of SOCS3 was negatively correlated with methylation but not with CNA.
Previous studies have not reported the relationship between mutation and methylation of SOCS3 and ESCA. However, Saqri's study pointed out that in gastric cancer, the low expression of SOCS3 was almost unrelated to methylation. 21 Therefore, further experiments are needed to verify whether the abnormal expression of SOCS3 is related to its promoter methylation in ESCA. The clinical pathological significance of the tumor microenvironment has been widely illustrated in predicting therapeutic efficacy for cancers. The stromal and immune cells that form the tumor microenvironment play an important role in the aggressiveness of tumors. To this end, the ESTIMATE algorithm was used to score stromal cells and immune cells in the tumor tissue according to the dataset. 22 We found that the SOCS3 expression level in ESCA was positively related to the ESTIMATE score, immune score, and stromal score and negatively related to tumor purity.
More importantly, SOCS3 was significantly related to macrophages, the infiltration score and NK cells in ESCA. Low tumor purity is related to unfavorable prognosis, 23 and the stromal-immune score represents a prognostic stratification tool. 24 Meanwhile, we demonstrated that ESCA patients with low expression levels of SOCS3 had better overall survival than patients with high expression levels of SOCS3. Therefore, SOCS3 can be considered a prognostic biomarker for ESCA. Moreover, we found that SOCS3 was significantly correlated with several immune checkpoint genes in ESCA, including LAG3, TIGIT, CTLA4, and PDCD1. Chikuma et al. showed that SOCS3 was a potential immune checkpoint molecule that was expected to be used for immunotherapy of cancers. 25 Tumor sensitivity to drugs is also an important prognostic factor; here, we demonstrated that SOCS3 was associated with susceptibility to 59 drugs. Tomina et al. verified that inhibition of SOCS3 increased the sensitivity of renal cell carcinoma to interferon-α. 26
In general, through bioinformatics methods, our data support SOCS3 as an important potential biomarker for the diagnosis, treatment, and prognosis of various cancers, including ESCA.
Furthermore, we explored the role of SOCS3 in the occurrence and development of ESCA. We experimentally confirmed that SOCS3 was highly expressed in ESCA cell lines and most ESCA clinical tissues, which was consistent with the results of bioinformatic analysis. We further demonstrated that knockdown of SOCS3 in ESCA cell lines decreased cell migration, invasion, and proliferation while increasing apoptosis. Similarly, in prostate cancer, the reduction in SOCS-3 also leads to a decrease in cell proliferation and an increase in apoptosis. 27 SOCS3 is a key regulator of the cell cycle. 28 Here, we also observed that knockdown of SOCS3 led to G1 arrest in ESCA cells. Therefore, SOCS3 appears to be a molecule involved in the regulation of the cell cycle and programmed cell death.
To explore the mechanism associated with cell activity induced by SOCS3, we detected changes in the expression levels of genes involved in the NF-κB signaling pathway. We demonstrated that knockdown of SOCS3 affected the NF-κB signaling pathway with downregulated P65, P52, and P50 expression levels and increased IKB-α and TNF-α expression levels. It is widely known that NF-κB can regulate cell cycle progression, cell proliferation and invasiveness, and cell apoptosis. 29 NF-κB activation has also been identified as having a major role in oncogenesis in many human malignancies. 30 Taken together, our results suggest that SOCS3 acts as an important regulator of carcinogenesis by regulating the NF-κB pathway.
Generally, our study was the first to use a bioinformatics method to evaluate the prognostic and application value of SOCS3 across cancers. In addition to being an important prognostic marker, this study also confirmed that SOCS3 promoted the tumorigenesis and progression of ESCA by activating the NF-κB pathway in ESCA, which is also of great value for the diagnosis and treatment of ESCA. However, our study also has certain limitations. In addition to bioinformatics analysis, clinical samples should also be collected to verify the prognostic value of SOCS3. In addition, the role and mechanism of SOCS3 in ESCA still needs to be systematically studied. These works will be carried out in future research.
CONCLUSIONS
In summary, SOCS3 was overexpressed in ESCA, and knockdown of SOCS3 promoted apoptosis and inhibited the proliferation and invasion of ESCA cells. These effects of SOCS3 may be mediated by the activation of the NF-κB pathway. All these data support that SOCS3 might be a promising therapeutic target and prognostic marker for ESCA.
Footnotes
AUTHORs' CONTRIBUTIONS
M.K. and J.L. conceived the study and designed the experiments; X.Y. and M.T. completed the experiment and wrote the article; Y.L., L.L., and X.S. discussed the results; Z.Z. analyzed the data. M.K., J.L., and X.Y. revised the article.
AVAILABILITY OF DATA AND MATERIALS
The dataset used and/or analyzed in this study is available from the corresponding author on reasonable request.
AUTHOR DISCLOSURE
No competing financial interests exist.
FUNDING INFORMATION
This work was supported by the Joint Funds for the Innovation of Science and Technology, Fujian Province (Grant No.: 2021Y9057); Fujian provincial health technology project (2020CX01010103); Natural Science Foundation of Fujian Province (2021J01745); Natural Science Foundation of Fujian Province (2020J01997); Young and Middle-aged Teacher Education Research Project of Fujian Education Department (Science and Technology) (JAT190194) and Sailing Fund General Project of Fujian Medical University (2019QH1023).
SUPPLEMENTARY MATERIAL
Supplementary Table S1
References
Supplementary Material
Please find the following supplemental material available below.
For Open Access articles published under a Creative Commons License, all supplemental material carries the same license as the article it is associated with.
For non-Open Access articles published, all supplemental material carries a non-exclusive license, and permission requests for re-use of supplemental material or any part of supplemental material shall be sent directly to the copyright owner as specified in the copyright notice associated with the article.