
Abstract
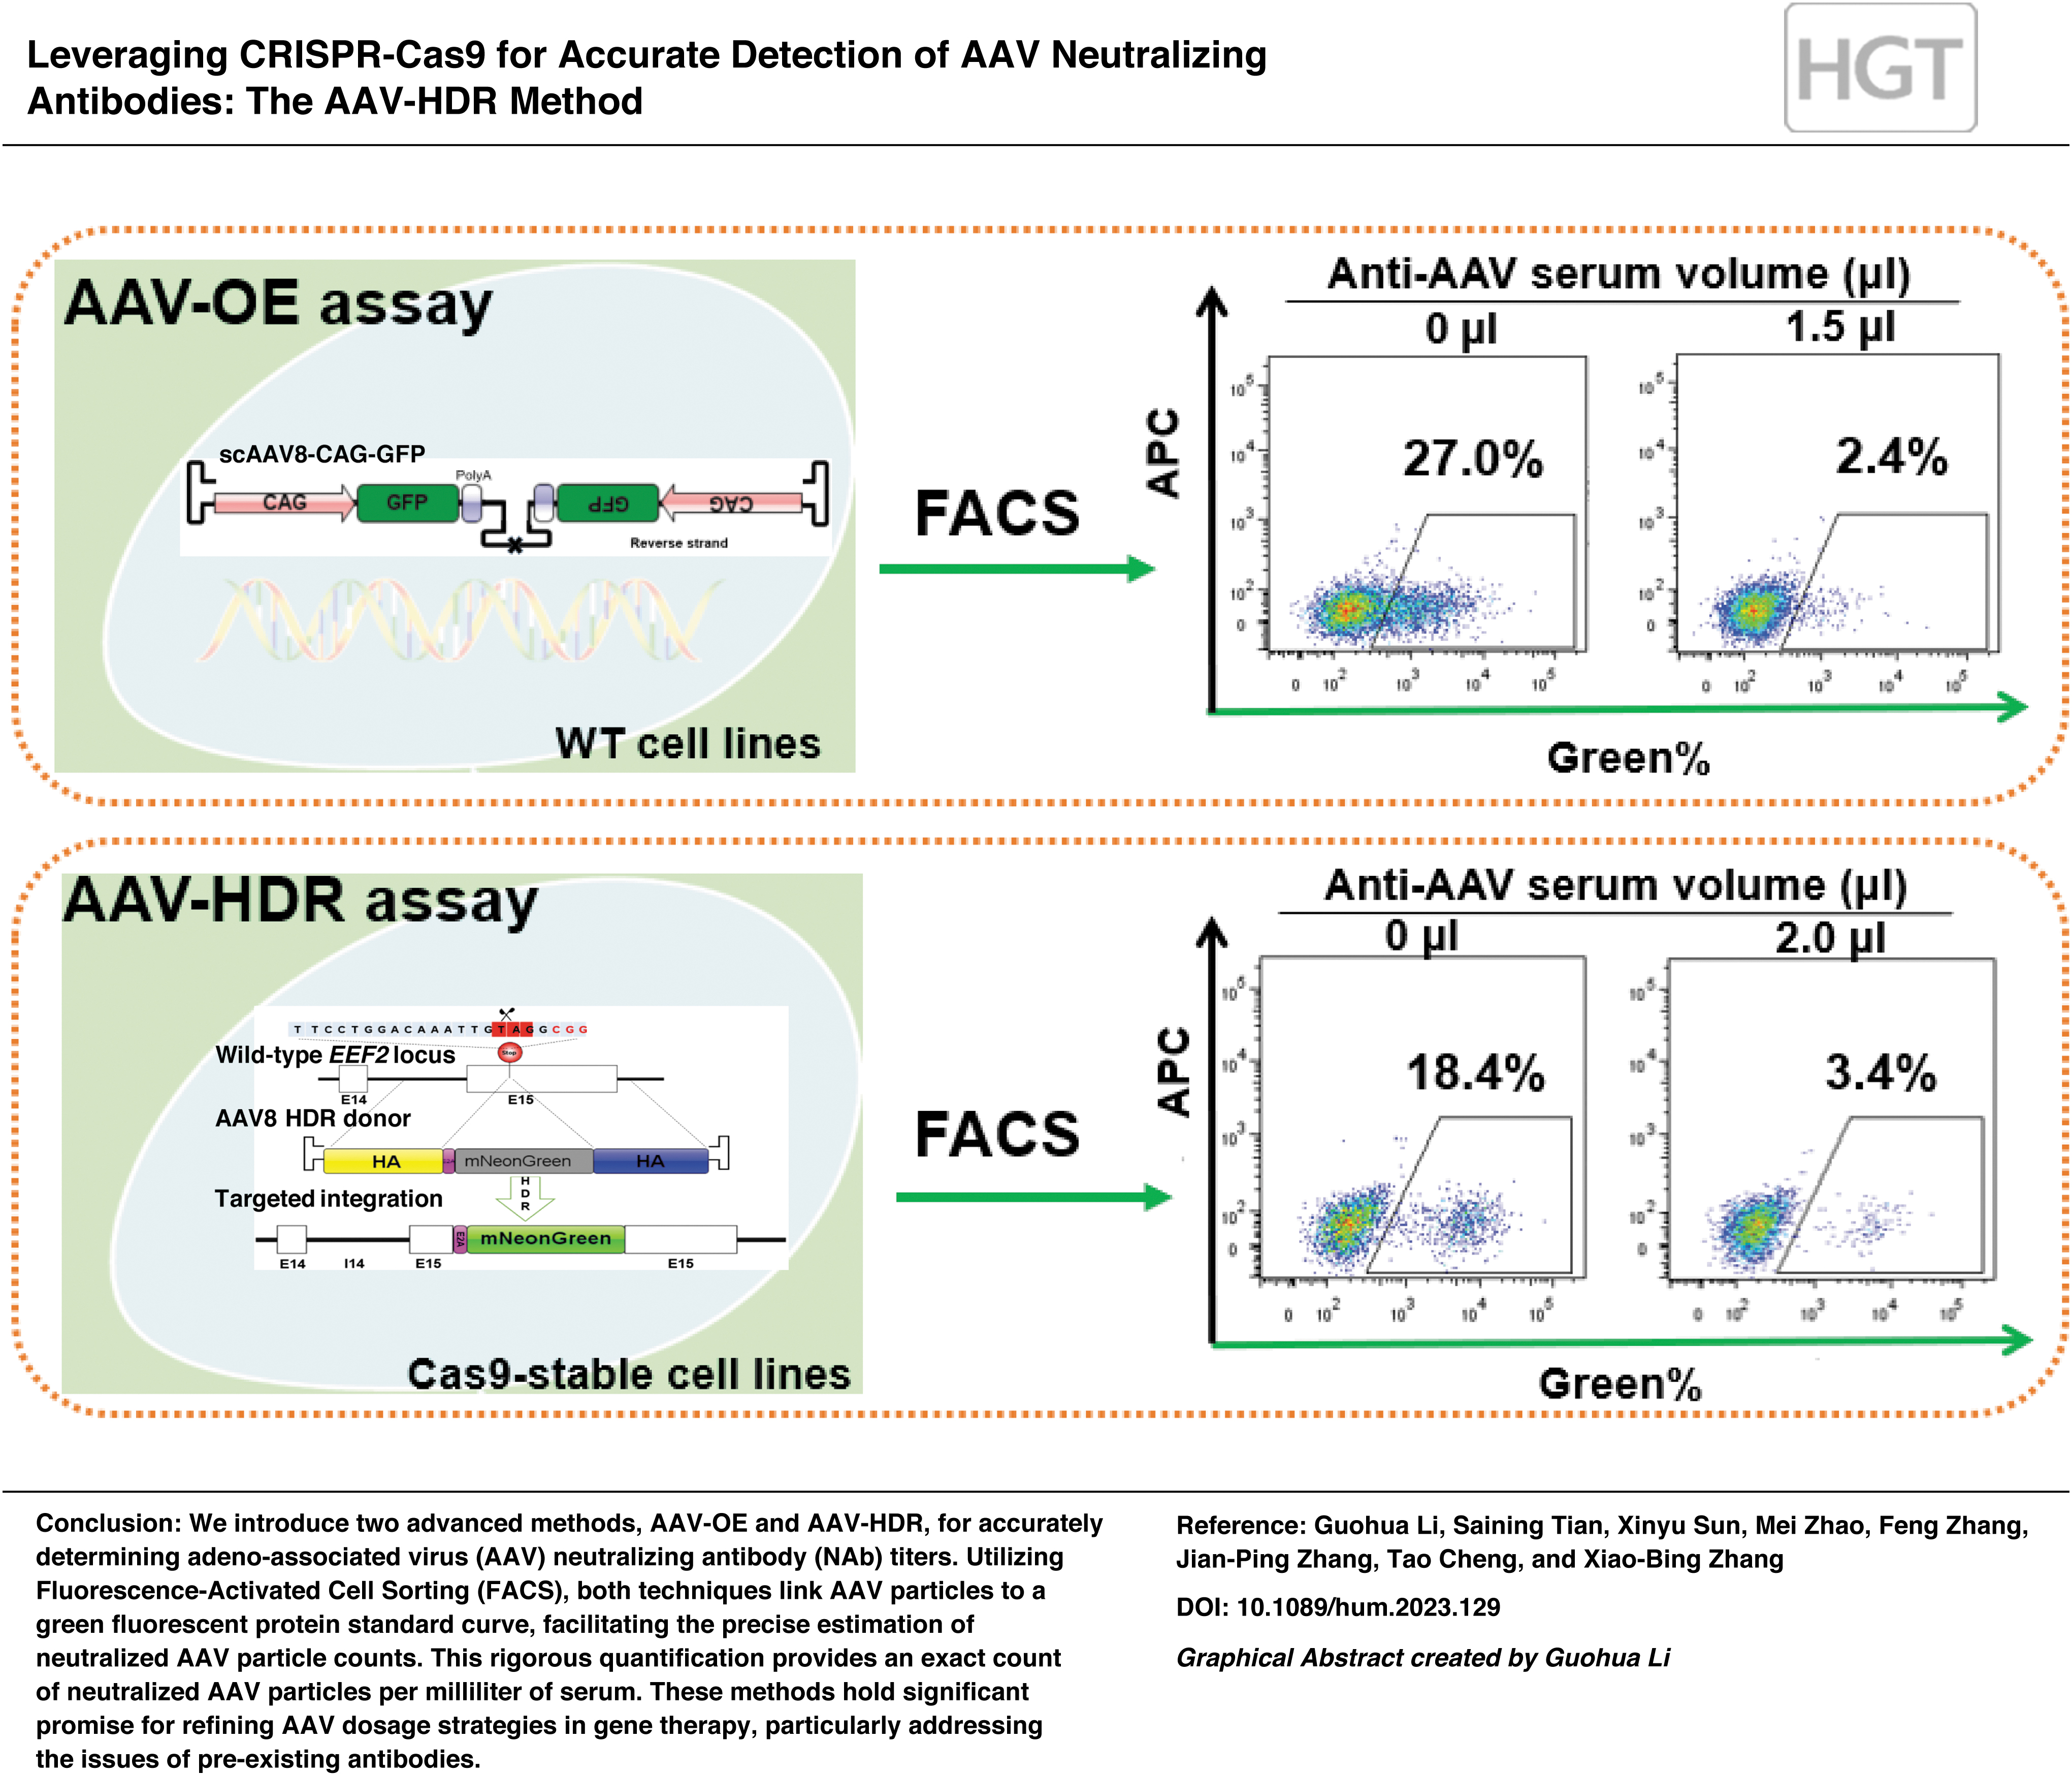
The effectiveness of adeno-associated virus (AAV)-based gene therapy is frequently constrained by the presence of AAV-neutralizing antibodies (NAbs). Existing detection techniques have shown inconsistencies across laboratories and cellular dependencies, challenging their universal applicability. Here, we redefine the NAb titer concept to represent the capability to neutralize a specific number of AAV virions per milliliter of serum. We present the AAV-homology-directed repair (HDR) assay, which harnesses the CRISPR-Cas9 system, offering a precise and sensitive means of detecting AAV NAbs. This assay employs a promoterless AAV HDR vector for integration into electroporated cells, facilitating the stable expression of a quantifiable fluorescent reporter and subsequent NAb titer assessment. Comparative evaluations indicated that the AAV-HDR method outperforms the traditional AAV overexpression (AAV-OE) assay regarding sensitivity and consistency. Crucially, it produced consistent outcomes across various cell lines, suggesting its potential as a universal standard for NAb titer measurement. We further confirmed the validity of the AAV-HDR titration approach by juxtaposing it with the established NT50 assay. Notably, the AAV-HDR method correlated robustly with both the AAV-OE assay and NT50 NAb titer values, and it exhibited heightened efficacy in identifying low-titer antibodies compared with the NT50 method. Given its ability to address AAV NAb detection challenges, the AAV-HDR assay holds promise for refining therapeutic strategies in gene therapy, particularly in tailoring AAV doses to neutralize preexisting NAbs.
INTRODUCTION
The field of adeno-associated virus (AAV) vector gene therapy has witnessed substantial growth in clinical applications and garnered heightened attention from the scientific community and investors. Notably, the U.S. Food and Drug Administration (FDA) has approved two AAV gene therapy products, LUXTURNA and ZOLGENSMA. 1,2 Several others, such as liver gene therapy for hemophilia A, have progressed to phase 3 clinical trials. 3,4 However, there are pivotal challenges to address for the broader adoption of AAV gene therapy.
Neutralizing antibodies (NAbs) against AAV vectors, 5,6 stemming from exposure to wild-type AAVs or previous AAV vector applications, 7 –9 pose a significant hurdle. These antibodies can profoundly undermine the therapeutic efficacy of AAV vectors. 10,11 Typically, patients with discernible AAV antibodies are excluded from AAV gene therapy, especially for systemic routes. However, AAV gene therapy can be effective for patients with low or no NAbs. However, when NAbs are low or absent, AAV gene therapy can be beneficial. Nevertheless, even minor variations in NAb levels can disrupt dosing accuracy, yielding inconsistent therapeutic outcomes. Thus, precise AAV antibody measurement in patients is crucial.
Existing methods to gauge anti-AAV titers, such as enzyme-linked immunosorbent assay (ELISA)-based capture and cellular transduction-driven in vitro tests, exhibit differential sensitivities. While ELISAs gauge overall AAV binding antibodies, they overlook neutralization activity. 10,11 In contrast, cellular transduction tests, although more clinically pertinent, are susceptible to numerous influences. 12 –15 For instance, luminescence-driven assays leveraging AAV overexpressing luciferase often grapple with distinguishing genuine signals from ambient noise. Consequently, titers are often presented as anti-AAV serum dilution ratios, leading to potential misinterpretations among clinicians and patients. Thus, a dependable and more interpretable method to accurately gauge NAb titers is imperative.
Although liquid scintillation counters once dominated luminescent reporter gene assays such as luciferase, flow cytometers have superseded them, promising heightened sensitivity and single-cell level precision for anti-AAV titer evaluations. 16 –18 However, the rapid decline in reporter gene levels post-AAV transduction often blurs the line between positive cells and background interference. To circumvent this, we propose leveraging CRISPR-enabled homology-directed repair (HDR) editing to induce sustained, potent fluorescent gene expression by facilitating AAV donor integration. 19 This technique harnesses AAV as a DNA template for exact repair following Cas9-single guide RNA (sgRNA)-induced double-stranded DNA breaks at designated loci, enabling edited cells to exhibit measurable fluorescence. Consequently, we introduce a novel gene editing and flow cytometry-based assay for efficient anti-AAV antibody detection.
Our research juxtaposed two NAb titer assessment assays: AAV-OE, which employs AAV for overexpression, and AAV-HDR, which uses AAV as an HDR donor. Both assays yield precise, single-cell level outputs via fluorescence-activated cell sorting (FACS). Contrary to luciferase-reliant tests, FACS-driven techniques allow prolonged examination periods, augmenting sensitivity and repeatability. We focused on AAV serotype 8, underscoring the cell line independence and interference resistance of the AAV-HDR titration method. These insights hold promise for optimizing the clinical implementation of AAV gene therapy.
MATERIALS AND METHODS
This study involving animals has been conducted in compliance with ethical standards. Approval for the research protocol was obtained from the Institutional Review Board (IRB) under the reference number IHCAMS-DWLL-OTJC2023060-2. All experimental procedures were performed in accordance with the approved guidelines and regulations.
Anti-AAV8 serum collection
To accurately quantify anti-AAV8 titers, we used pooled serum samples sourced from multiple hemophilia A mice. These mice had previously been exposed to a systemic dose of AAV8 3 months prior, leading to a surge in anti-AAV8 NAbs. Blood samples were drawn from the mice via tail vein clipping and were then deposited into microtubes. The samples were either left at room temperature for an hour or stored at 4°C overnight. Next, we centrifuged the samples at 2,000g for 10 min and carefully decanted the supernatant into a fresh tube. To inactivate potential contaminants, the samples were heated to 56°C for 30 min. For long-term storage, the samples were aliquoted and preserved at −80°C until needed for testing.
Creation of spCas9-expressing cell lines
For the generation of cell lines stably expressing SpCas9, three different cell types were transduced with lentiviral vectors (Lenti-EF1-SpCas9-Puro-Wpre) at a multiplicity of infection (MOI) of 3. 20 After transduction, the cells were selected using a medium supplemented with 2 μg/mL puromycin for a duration of 1 week, yielding stable SpCas9-expressing cell lines. A control cell line was also developed to validate the specificity of the SpCas9-mediated effects.
sgRNA design and sequence
To design an effective sgRNA that targets the stop codon region of the human EEF2 gene, we used the CHOPCHOP platform (https://chopchop.rc.fas.harvard.edu/). 21 The chosen sgEEF2 sequence for our experiments reads: gTTCCTGGACAAATTGTAGG. The construction of pU6-sgEEF2 was detailed previously. 22
AAV plasmid design and assembly
We designed two distinct AAV plasmids for NAb titration: the AAV-HDR and the AAV overexpression vectors. The AAV-HDR vector was outfitted with mNeonGreen as its fluorescence reporter and had homologous arms (HAs) bordering the sgEEF2 cleavage region. The overexpression vector, on the other hand, utilized green fluorescent protein (GFP) as its fluorescent reporter under the regulation of the CAG promoter. To assemble these vectors, HAs were amplified from human genomic DNA, and knock-in (KI) fragments were sourced from in-house plasmids, with the KAPA HiFi polymerase facilitating amplification. Post-PCR, we used the NEBuilder HiFi DNA Assembly Kit for the component assembly, per the provider's guidelines. To ensure the accuracy and integrity of the constructed clones, we employed both Sanger and Nanopore sequencing services from GenoStarBio.
AAV production and purification
To produce AAV8 vectors, we adopted a triplex plasmid cotransfection methodology. HEK293T cells, when 80–90% confluent, were introduced to pAAV-Helper, AAV8 capsid, and the transgenic AAV plasmids at a 2:1:1 ratio. The transfection utilized a blend of 40 μg total plasmid DNA and 80 μg PEImax, suited for a 15 cm culture dish. By the 5th day post-transfection, the cells were incubated with benzonase (20 U/mL, from Santa Cruz Biotechnology) and NaCl (500 mM, sourced from Sigma) for a span of 2 h, facilitating vector release. After incubation, we collected the virus-rich supernatant, followed by a 10-min centrifugation at 5,000g. Filtering the supernatant through a 0.22 μm membrane ensured its sterility. For vector concentration, we employed the Minimate tangential flow filtration system (PALL) complemented with a 300-kDa molecular weight cut-off (MWCO) capsule.
Iodixanol gradient ultracentrifugation was performed to further purify the concentrated AAV vectors. To remove residual iodixanol, we subjected the AAV to two washes using phosphate-buffered saline (PBS)-0.05% Pluronic F68 via a Vivaspin 20 centrifugal concentrator (MWCO 100 kDa). The final vector titration was performed using both quantitative polymerase chain reaction (qPCR) and droplet digital polymerase chain reaction methods, ensuring precise quantification of anti-AAV antibodies.
K562 cell culture and electroporation
K562 cells (ATCC; CCL-243) were maintained in RPMI-1640 medium enriched with 10% fetal bovine serum (FBS) (Gibco) and split twice weekly to sustain optimal growth. For genome editing, 1 × 10⁶ cells underwent electroporation using the Lonza 2b nucleofector and Amaxa™ Cell Line Nucleofector™ Kit V (Lonza) following program T-016. After electroporation, the cells were immediately transferred to prewarmed RPMI-1640 medium (10% FBS) and incubated at 37°C with carbon dioxide (CO2). Subsequent analyses were conducted to evaluate genome editing efficiency.
HeLa cell culture and electroporation
HeLa cells (ATCC) were grown in RPMI-1640 medium containing 10% FBS (Gibco) and collected on reaching 70–80% confluency. After a PBS wash, cells were resuspended in SE Cell Line 4D-Nucleofector X Solution (Lonza) to achieve a concentration of 1–5 × 10⁶ cells/100 μL. Electroporation utilized the Lonza 4D Nucleofector System, program CN-114. After electroporation, the cells were placed in prewarmed RPMI-1640 medium (10% FBS) and incubated at 37°C with CO2.
HEK293T cell culture and electroporation
HEK293T cells (ATCC) were cultured in Dulbecco's modified Eagle medium (DMEM) with 10% FBS (Gibco) at 37°C and 5% CO2. After passages every 2–3 days, 70–80% confluent cells were harvested for electroporation. They were then resuspended in the buffer from the Amaxa Cell Line Nucleofector Kit V (Lonza), combined with the needed plasmid DNA, and electroporated using the Lonza 2b nucleofector, program A-023.
AAV-NAb detection using AAV-OE/AAV-HDR assays
The detailed procedures for detecting AAV antibodies are as follows:
Standard Curve Establishment: Dilute the AAV vector in DMEM to create a gradient of AAV MOIs for direct addition to cells.
NAb Determination: Serially dilute test serum in DMEM in a twofold gradient. Combine 100 μL of each diluted serum with specific AAV8 MOIs and incubate at 37°C for 2 h to allow serum NAbs to neutralize AAV particles.
Cell Seeding: Seed cells in a 48-well TC-treated plate at a density of 5 × 10⁴ cells/well and incubate under 37°C with 5% CO2. Ensure plate pretreatment with 0.002% poly-L-lysine to ease subsequent washing steps for suspension cells.
Coculture: For the AAV-OE assay, directly coculture cells with either the AAV vector or the combined AAV and anti-AAV serum. For the AAV-HDR assay, following sgRNA electroporation, coculture the SpCas9 stable cell line with either the AAV vector or the combined AAV and anti-AAV serum.
Medium Exchange: After 4 h, remove AAV-containing medium, rinse cells with PBS, and replenish with fresh medium.
Flow Cytometry Analysis: At specified post-transduction or post-electroporation intervals, determine the percentage of mNeonGreen- or GFP-positive cells.
Standard Curve Derivation: Plot AAV virions (x-axis) against transduction efficiency (y-axis) to generate a standard curve.
NAb Quantification: Use the standard curve to estimate the number of non-neutralized AAV virions corresponding to specific GFP%. Calculate the number of AAV virions neutralized per mL of serum, supported by a Python script.
Anti-AAV-NAb titer calculation
A Python script, accessible at github.com/XBLab/Calculation_of_Anti_AAV_NAb_Titer, aids in AAV antibody titer computation. The user-friendly interface prompts data input for X (number of virus particles per MOI value for AAV-only) and Y (percentage of reporter gene-positive cells). Following a quadratic standard curve fitting, it displays an R 2 value, and if R 2 <0.99, a new data set is requested. Subsequent inputs include the percentage of reporter gene-positive cells in the AAV-serum coincubation group and the known number of added virus particles. The script evaluates the number of neutralized AAV virions and, on user input of the anti-AAV serum volume, computes the antibody titer by excluding outliers and presenting the average titer value. The script seamlessly transitions to calculate the next group's titer data.
AAV NAb detection using the NT50 Assay
We used the NT50 assay as a control to assess the AAV-neutralizing titers of test samples. The procedures are as follows:
Huh-7 Cell Seeding: Dispense Huh-7 cells into a 96-well plate at a concentration of 1 × 10⁵ cells/mL (100 μL per well). Following a 2- to 3-h incubation, add etoposide and continue incubation overnight at 37°C and 5% CO2.
Serum Dilution and Neutralization: Perform a twofold serial dilution of the test serum in DMEM. Combine 100 μL of each diluted serum with specific AAV8 MOIs and incubate at 37°C for 2 h for neutralization.
Medium Exchange and Incubation: Add complete medium to the incubation tube, thoroughly mix, and replace the old medium in the culture plate. Incubate the cells at 37°C for 24 h to facilitate AAV vector-cell interaction.
Luciferase Assay Preparation: Bring the Luciferase Assay Reagent (Promega) to room temperature. Substitute the old medium with the assay solution and agitate on a horizontal shaker at ambient temperature.
Luminometer Analysis: Employ the Promega GloMax™ 20/20 Luminometer to execute the firefly luciferase reporter gene assay. The NT50, representing the serum dilution causing a 50% inhibition in transduction efficacy, is ascertained to evaluate the anti-AAV-NAb titer.
Flow cytometry assessment
Using the BD FACS Canto II flow cytometer, we analyzed GFP-expressing cells harvested 2-, 3-, 4-, and 6-day post-transfection, with over 30,000 cells acquired per session. Direct analysis was performed on suspended cells, whereas adherent cells were pretreated with Accutase. Negative controls, devoid of AAV transduction, assisted in gating. Initial gating relied on forward and side scatter plots to pinpoint intact cells. Subsequently, singlet cells were identified by comparing forward scatter width versus forward scatter height. Cells exhibiting fluorescence were identified as AAV-transduced in the AAV-OE assay and as accurately edited in the AAV-HDR assay.
Small-molecule treatment
Cells were treated with the small molecules M3814 (MedChemExpress) and trichostatin A (TSA; Selleckchem), both initially stored in DMSO. For application, they were diluted in 50 μL of culture medium to their respective working concentrations: two μM for M3814 and 0.01 μM for TSA. Four hours post-treatment, the culture medium was refreshed to study the impact of these molecules on gene editing efficiency.
Quantification of AAV Vector Copies using qPCR
To assess AAV vector copy numbers relative to the genome, ∼1 × 10⁵ cells were processed. Genomic DNA extraction involved cell lysis in a 10 μL digestion buffer composed of 100 mM NaCl, 10 mM Tris pH 8, 1 mM EDTA, 0.5% Tween 20, and 1% proteinase K (10 mg/mL). The cells were lysed by incubation at 56°C for an hour, and proteinase K was inactivated at 95°C for 15 min. qPCR primers targeting mNeonGreen or GFP were designed using Primer3Plus, with details available in Supplementary Table S1. Actin beta served as the reference gene for normalizing the vector copy count. The qPCR mixture contained KAPA SYBR® FAST Universal 2 × qPCR Master Mix, 3 μL of DNA template, and 0.5 μM primers. Amplification followed a specific protocol with initial denaturation and 40 amplification cycles, culminating in a melting curve analysis.
Data analysis
Data evaluation was performed using GraphPad Prism 9.5. For two-group comparisons with normal distribution and homogenous variance, we either applied unpaired or paired two-tailed Student's t-tests. It is noteworthy that our data set met the normality prerequisites for t-tests. Specific p-values linked to individual experiments are delineated in the related figures. For reliability, all depicted data were derived from a minimum of three distinct trials.
RESULTS
Enhanced AAV NAb assessment with flow cytometry in AAV8 vectors
Traditional NAb assays primarily rely on measuring inhibition ratios of luciferase signals. However, the chosen fluorescence reader can substantially impact assay accuracy. In contrast, flow cytometry provides cell-by-cell resolution, offering a potentially higher precision than bulk measurements from liquid scintillation counters. Given this potential advantage, we hypothesized that adopting flow cytometry could refine AAV NAb quantification.
Considering the growing therapeutic promise of AAV8-based liver gene therapy, 23 –27 we focused our investigation on AAV8 vectors. While doing so, we recognized the broader applicability of this methodology to other serotypes. Distinctly, self-complementary AAV (scAAV) vectors are noted for their superior in vitro transduction efficiencies. Their advantage comes from bypassing the need to synthesize a second strand before initiating transcription, unlike their single-stranded AAV counterparts. 28,29 Employing the scAAV8-CAG-GFP vector, we introduced it into the K562 leukemia cell line (Fig. 1A). FACS analyses of K562 cells post-transduction at escalating MOIs displayed a progressive increase in GFP expression from 7% to over 80% (Fig. 1B, C).

Correlation of AAV vector MOI with GFP expression post-transduction.
To delineate the relationship between MOI and GFP%, we constructed a standard curve. Notably, both binomial and logarithmic regressions exhibited a robust alignment of GFP% to AAV virion counts. Given the marginally superior R 2 value (over 0.99) of the binomial regression, we selected it for subsequent evaluations (Fig. 1D; Supplementary Fig. S1A). Our data underscore the efficacy of AAV8 vector transduction into K562 cells and the positive correlation between MOI and transduction efficiency.
Quantification of AAV NAb titers using the AAV-OE assay
To measure NAb titers, we utilized a standard curve that mapped the number of AAV virions to the GFP expression percentage. The presence of anti-AAV serum neutralized a portion of the AAV particles, leading to a reduction in GFP%. By comparing this decrease with the standard curve, we could estimate the number of neutralized AAV virions and subsequently determine the AAV NAb titer for the sample, denoted as the quantity of neutralized AAV virions per milliliter of serum.
Recognizing the need for a robust method to determine anti-AAV8 titers, we utilized serum from a cohort of hemophilia A mice known to exhibit heightened NAb levels 3 months after systemic AAV8 administration. 23 It is well-documented that AAV injections in mice induce a surge in NAb levels in the subsequent weeks. 30 Leveraging this, we used the serum from these treated mice as our benchmark samples for anti-AAV titration.
To ascertain the influence of anti-AAV serum on AAV vector transduction, we pre-incubated varying MOIs of AAV with different volumes of anti-AAV serum at 37°C for 2 h, and then allowed this mixture to interact with K562 cells. An FACS analysis conducted 2 days post-transduction revealed a marked decline in GFP%—from 39.7% down to a mere 0.6%—in proportion to the increasing volume of the anti-AAV serum (Fig. 2A).

Assessing AAV-NAbs using AAV-OE transduction and FACS.
To quantitate the AAV NAb titer of the test serum, we hinged our calculations on the GFP signal captured by FACS. As an example, when 5 × 10⁹ vg total virions were incubated with 1.5 μL of anti-AAV serum, we recorded the resulting GFP% using FACS. Using our standard curve equation, we identified the number of virions corresponding to that GFP% (those not neutralized by the serum). The subsequent breakdown of our calculations for the anti-AAV NAb titer (defined as the count of AAV virions neutralized per milliliter of serum sample) is illustrated in Fig. 2B:
Neutralized AAV virions = Initial virion count – Unneutralized virion count = 5 × 10⁹ vg – 2.86 × 10⁹ vg = 2.14 × 10⁹ vg
Anti-AAV NAb titer (vg/mL) = Neutralized AAV virions ÷ Volume of anti-AAV serum = 2.14 × 10⁹ vg/1.5 μL × 103 μL/mL = 1.43 × 10¹² vg/mL
Interestingly, consistent NAb titer values (1.43 and 1.54 × 10¹² vg/mL) emerged regardless of the volume variations of anti-AAV serum used with a consistent virion count. This consistency underscores the reliability of our methodology in pinpointing NAb titers (Fig. 2B).
To assess the temporal window of our GFP-based detection, we conducted FACS analyses on the 2nd, 3rd, and 4th days post-transduction and deduced the NAb titer, as illustrated in Fig. 2B. Predictably, we noted a progressive reduction in both the GFP percentage and its fluorescence intensity over this period due to the dilution effect brought about by continuous cell proliferation and the AAV-OE vector's nature (Supplementary Fig. S2). However, when gauged against their respective standard curves, the NAb titer values remained largely consistent across the days (Fig. 2C). This consistency accentuates that our GFP expression-based methodology provides a more straightforward and efficient alternative to traditional luciferase-centric assays.
While our research predominantly utilized the K562 cell line, which offers the convenience of suspension culture, the broader scientific community has leaned toward other cell lines, such as HEK293 and HeLa, for developing cell-based anti-AAV NAb assays. 31 Reflecting our findings in K562 cells, we noticed that in other cell lines, the percentage of GFP-expressing cells, along with their fluorescence intensity, began to decrease from the 2nd day post-transduction. This trend is likely a consequence of continual cell proliferation, leading to the dilution of the AAV-OE vector, as detailed in Supplementary Figs. S3 and S4.
To investigate the cell line specificity of the AAV-OE assay, we subjected identical anti-AAV serum samples to NAb titering across K562, HeLa, and 293T cell lines. Our comparison of the resulting NAb titers revealed a striking disparity among the cell lines. On average, K562 cells displayed an NAb titer of 1.5 × 10¹² vg/mL, whereas HeLa and 293T cells manifested higher titers at 2.1 × 10¹² vg/mL and 4.2 × 10¹² vg/mL, respectively (Fig. 2D; Supplementary Fig. S5).
The results highlight the cell line-dependent variability of the AAV-OE assay, which brings into question the reproducibility and precision of its outcomes across diverse research conditions. Consequently, there is a pressing need to develop a method for NAb titer determination that is both sensitive and consistent, regardless of the cell line used, setting a new gold standard in the field.
Development of an AAV-CRISPR editing system for NAb titering
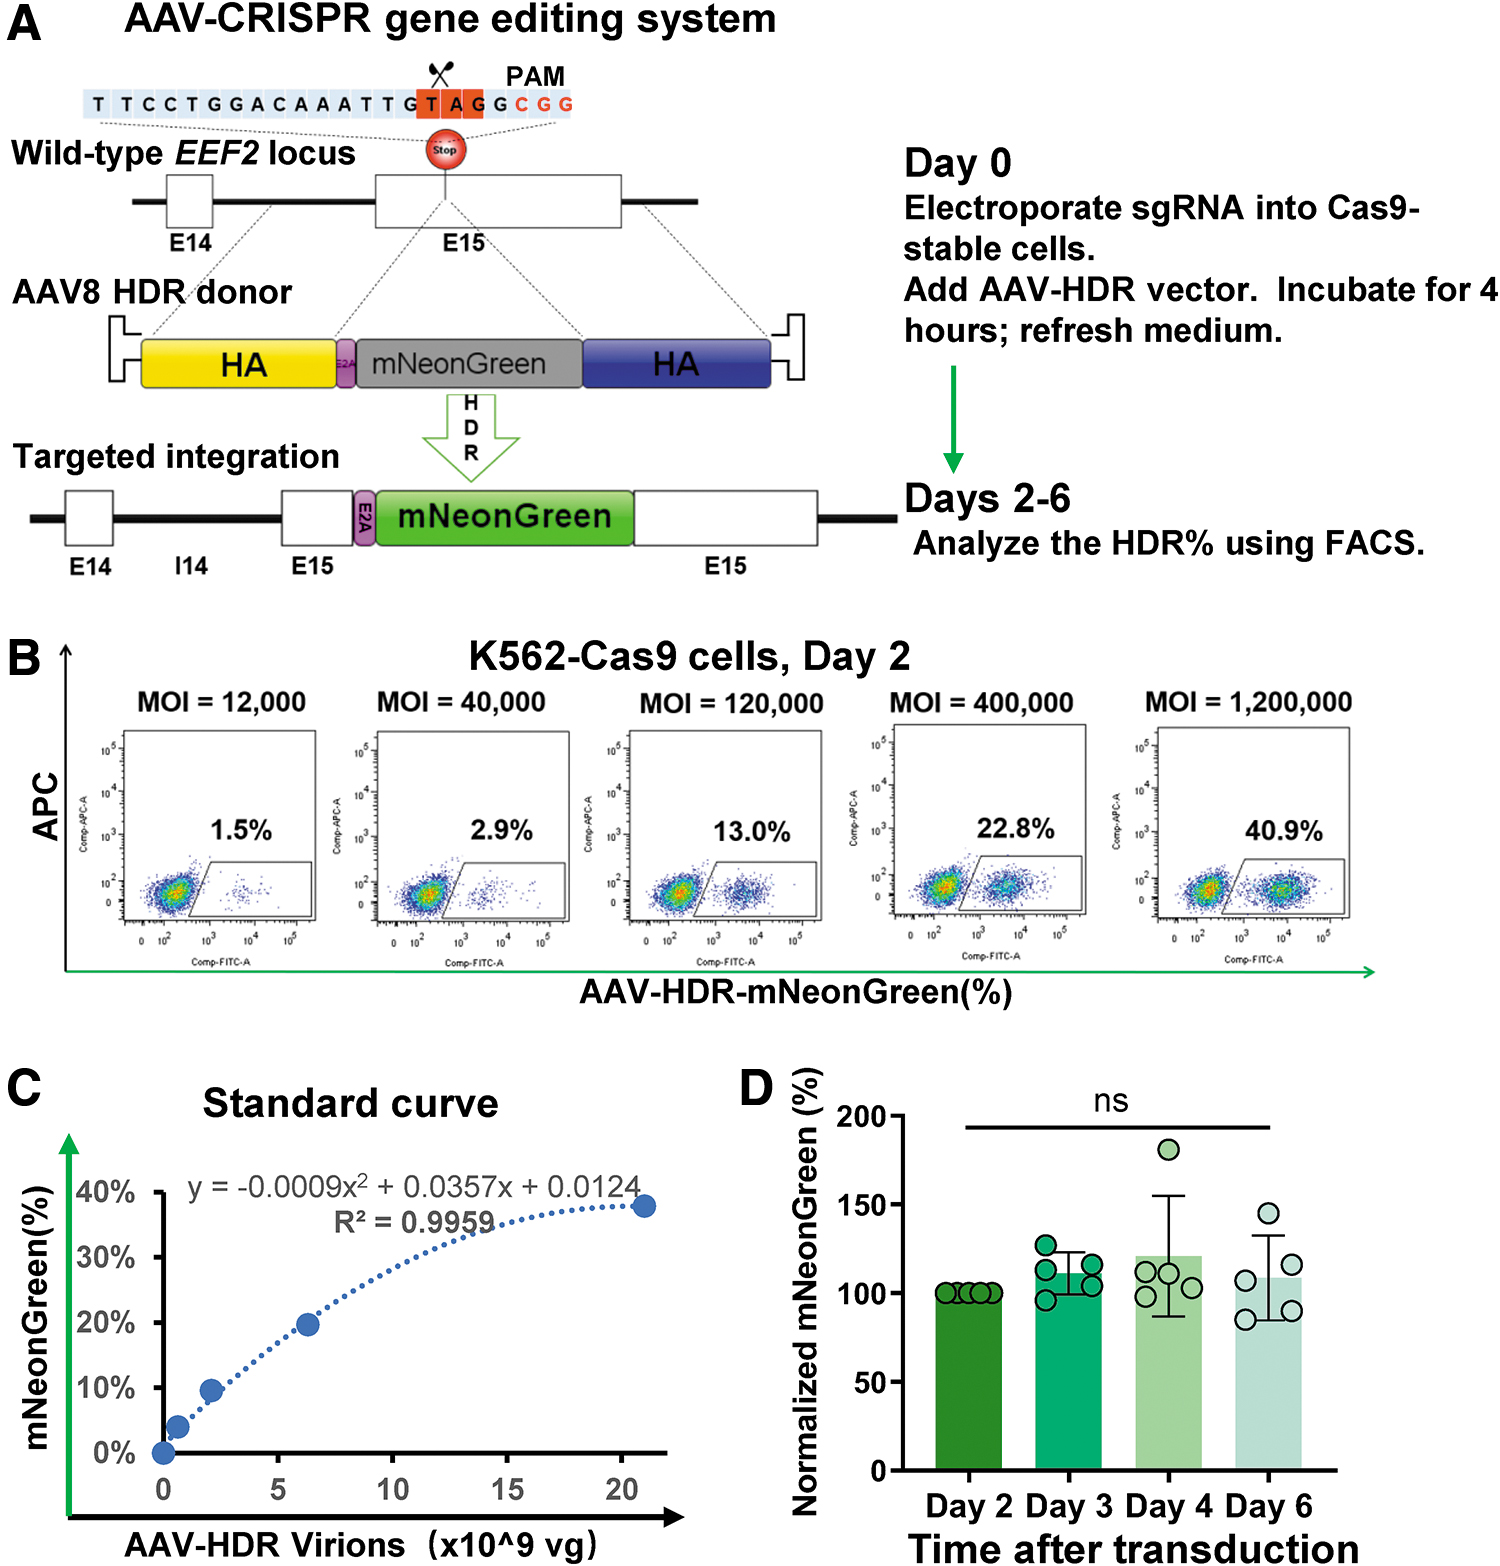
To counteract the dilution of the AAV vector and the time-dependent loss of reporter gene expression, we devised an AAV-CRISPR editing system. 4,32 Harnessing the precision of CRISPR-Cas9 gene editing, 19,33 we induced DNA double-strand breaks to facilitate the exact insertion of genes through HDR. 34 By designing an AAV-HDR donor vector, we aimed at guiding the mNeonGreen insertion right at the EEF2 stop codon (Fig. 3A). We utilized a K562 cell line that consistently expressed SpCas9, thereby ensuring higher editing efficiency. The donor template was delivered through AAV transduction after the introduction of the sgRNA plasmid via electroporation. As a result of successful HDR editing, mNeonGreen expression was triggered and subsequently quantified using FACS. This editing ensured coexpression of EEF2 and mNeonGreen, facilitated by the E2A-mediated ribosomal skipping mechanism. 35
Enhanced anti-AAV titer measurement using the CRISPR-AAV-HDR system.
To evaluate the efficiency of our AAV-CRISPR system and identify correlations between varying MOIs of AAV donors and HDR efficiency, we carried out rigorous testing. PCR amplification and Sanger sequencing showed an 88% indel efficiency within 2 days (Supplementary Fig. S6A). When excluding either AAV or sgEEF2, or when utilizing sgRNA targeting an alternative locus like sgGAPDH, only minimal mNeonGreen signals were observed (Supplementary Fig. S6B). In stark contrast, introducing cleavage at the EEF2 stop codon resulted in robust mNeonGreen expression. These results confirm the targeted incorporation and expression of the AAV-HDR donor at the EEF2 site in Cas9-stable cell lines. As we escalated the MOIs of the AAV-HDR donors, there was a corresponding rise in the percentage of mNeonGreen-expressing cells, peaking at ∼50%. Using this data set, we constructed a binomial regression standard curve, which tied AAV virions to mNeonGreen expression levels. This curve subsequently provided a foundation for NAb titer calculations (Fig. 3C).
Drawing parallels from our previous study on recombinant nucleocapsid protein AAV6 editing dynamics in induced pluripotent stem cells (iPS) cells, we found a surge in AAV-HDR copy number and editing efficiency within the first 24 h post-electroporation, which then stabilized after 48 h. 36 In line with these observations, our current study revealed optimal AAV-HDR efficiency 2–3 days post-transduction (Supplementary Fig. S6C). The sustained mNeonGreen expression highlighted the advantages of the AAV-HDR system, offering a broader detection span compared with the AAV-OE system. Given these findings, we advocate that the CRISPR-HDR-based assay might be a superior and more consistent method for determining AAV NAb titers than its AAV-OE counterpart.
Quantification of AAV NAb titers using the AAV-HDR assay
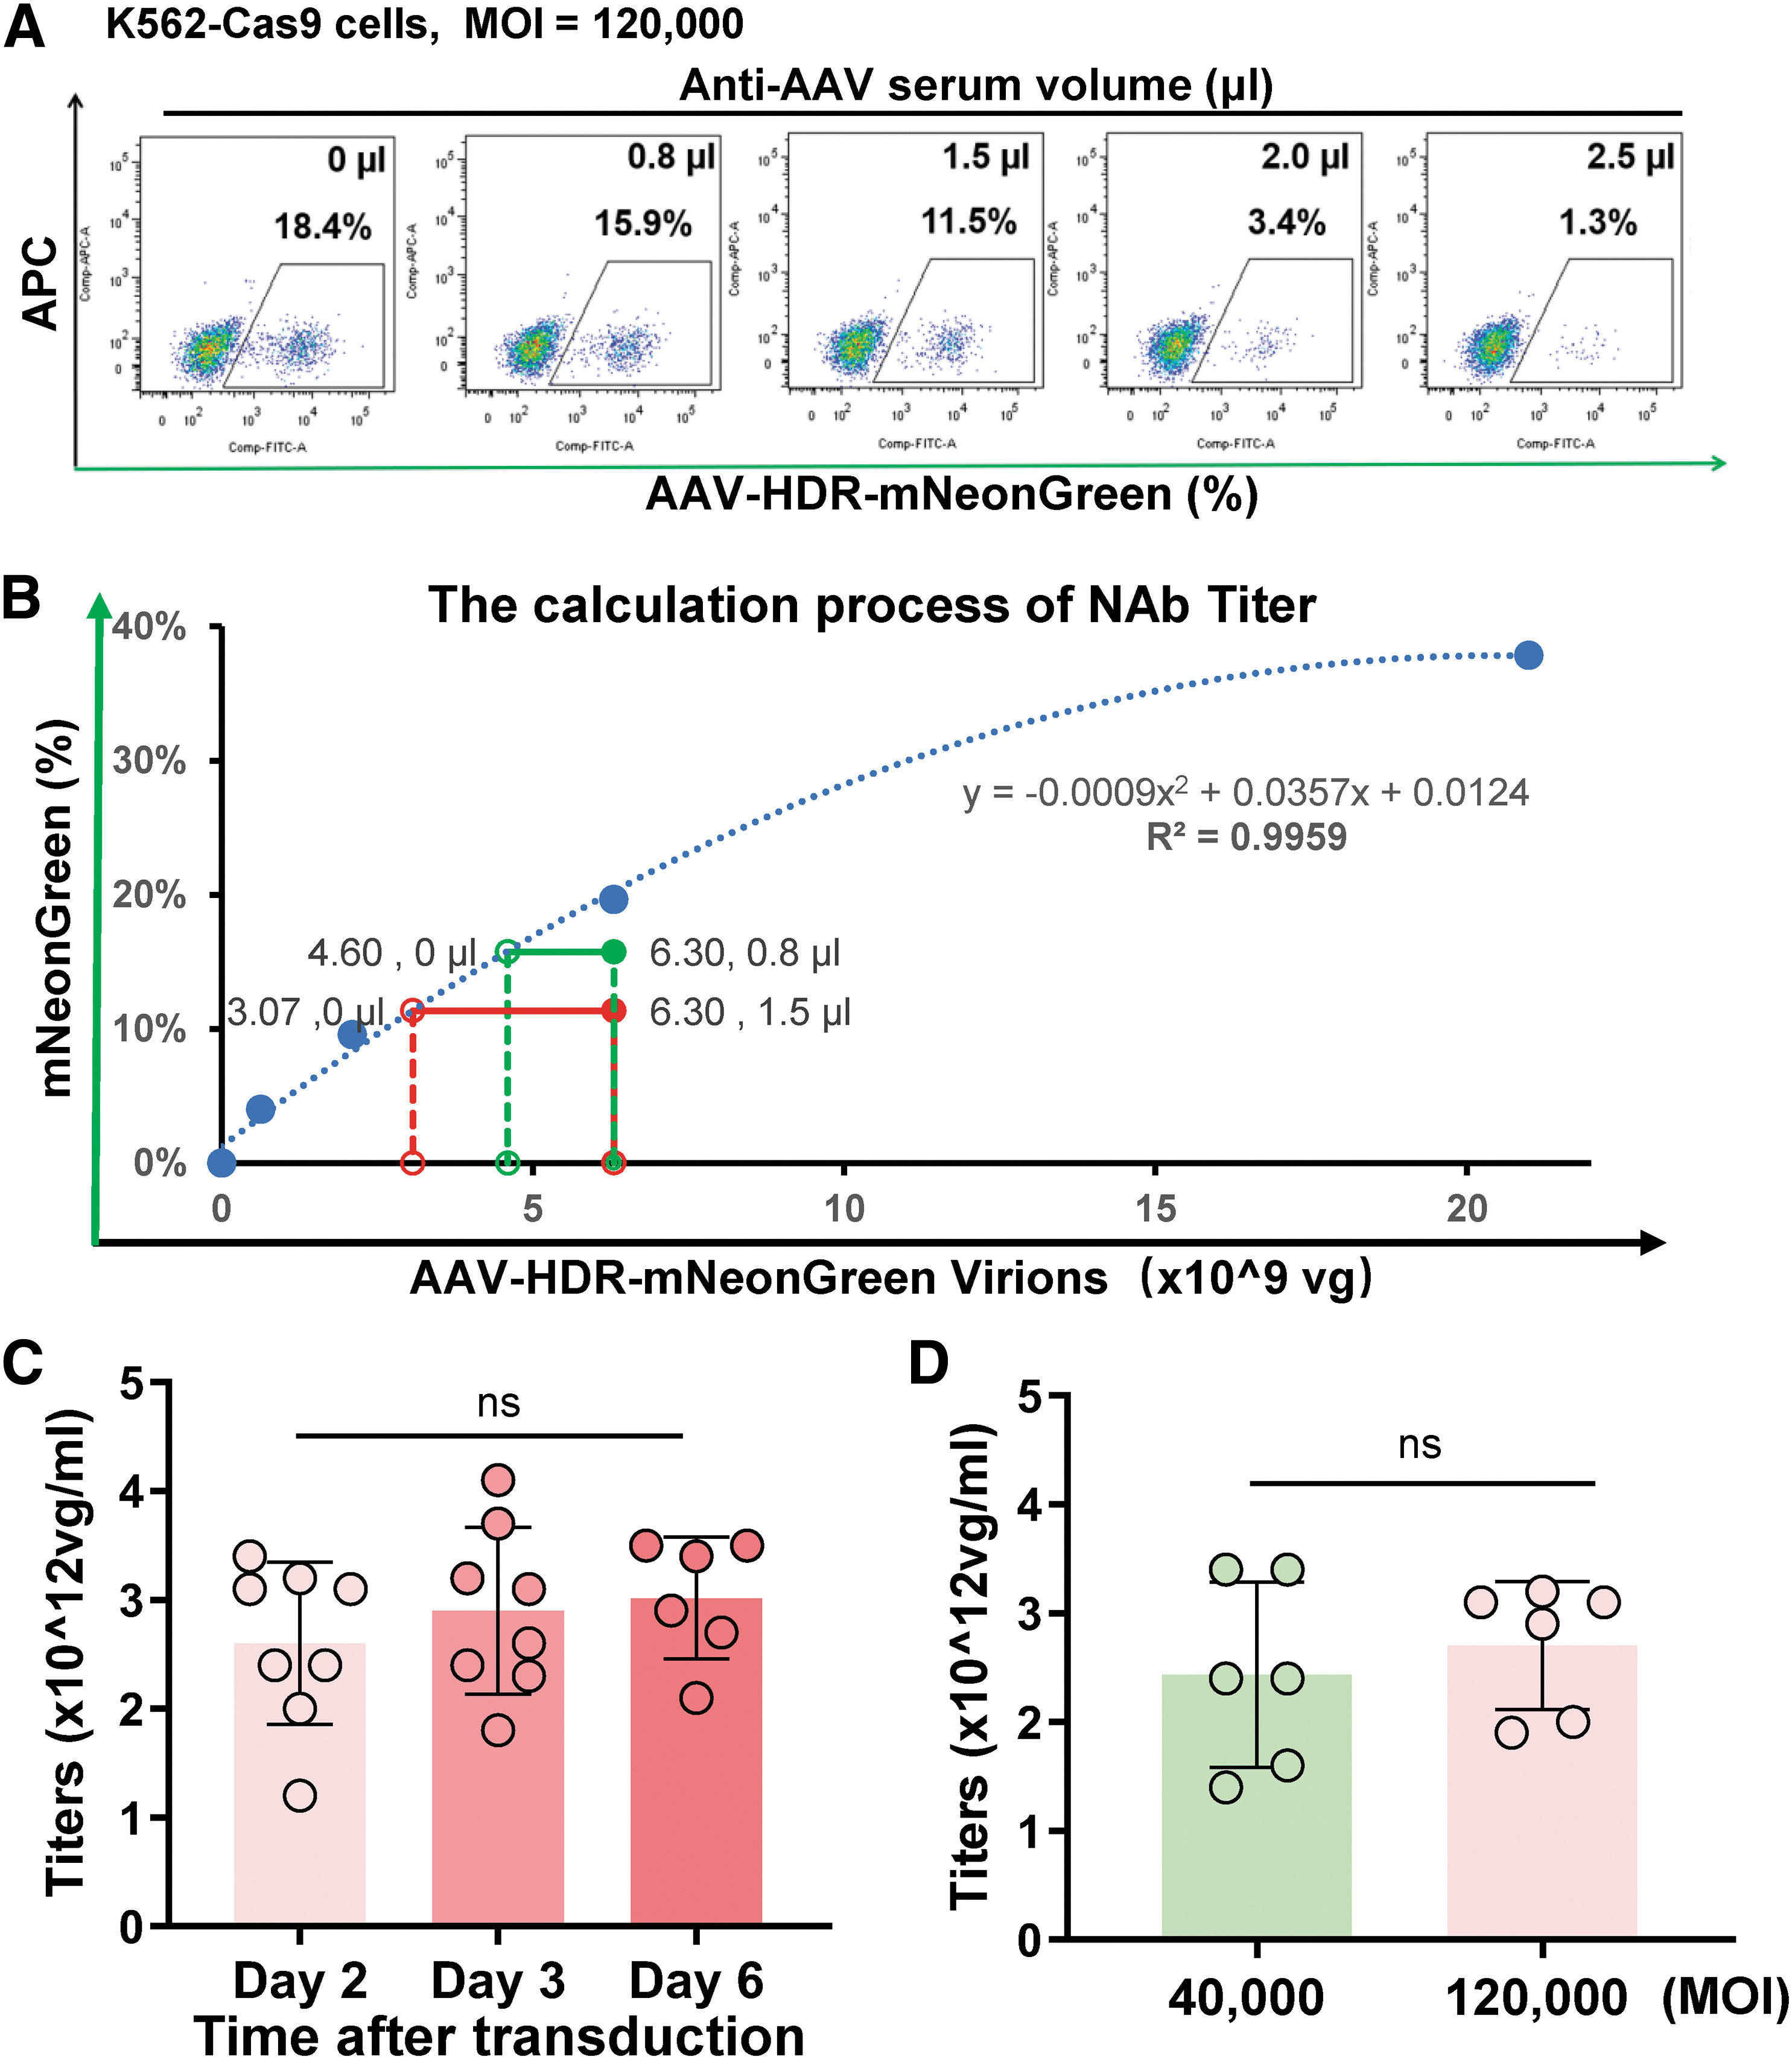
To evaluate the AAV-HDR assay's potential, we examined the antibody titers of HA mouse serum samples, the same ones used in the AAV-OE assay. Using an MOI of 120,000, we preincubated AAV donors with different anti-AAV serum volumes for 2 h at 37°C before combining them with sgRNA-electroporated K562-Cas9 cells. Two days post-incubation, FACS analysis showed a decline in the AAV donor's HDR efficiency from 18.4% to 1.3% as the anti-AAV serum volume increased (Fig. 4A).
Evaluating AAV-Neutralizing Antibody Titers via the AAV-HDR CRISPR Editing System.
We computed the NAb titer following the AAV-OE assay methodology (Fig. 4B). Remarkably, the NAb titer values remained stable over time, with a 3-day test result averaging at an NAb titer of 2.8 × 10¹² vg/mL (Fig. 4C). Further, when varying the AAV MOIs (either 40,000 or 120,000), the NAb titer values exhibited no significant disparities. This consistency underscores the AAV-HDR method's robustness, sensitivity, and reliability (Fig. 4D).
AAV-HDR assay: a robust tool for AAV NAb titer detection
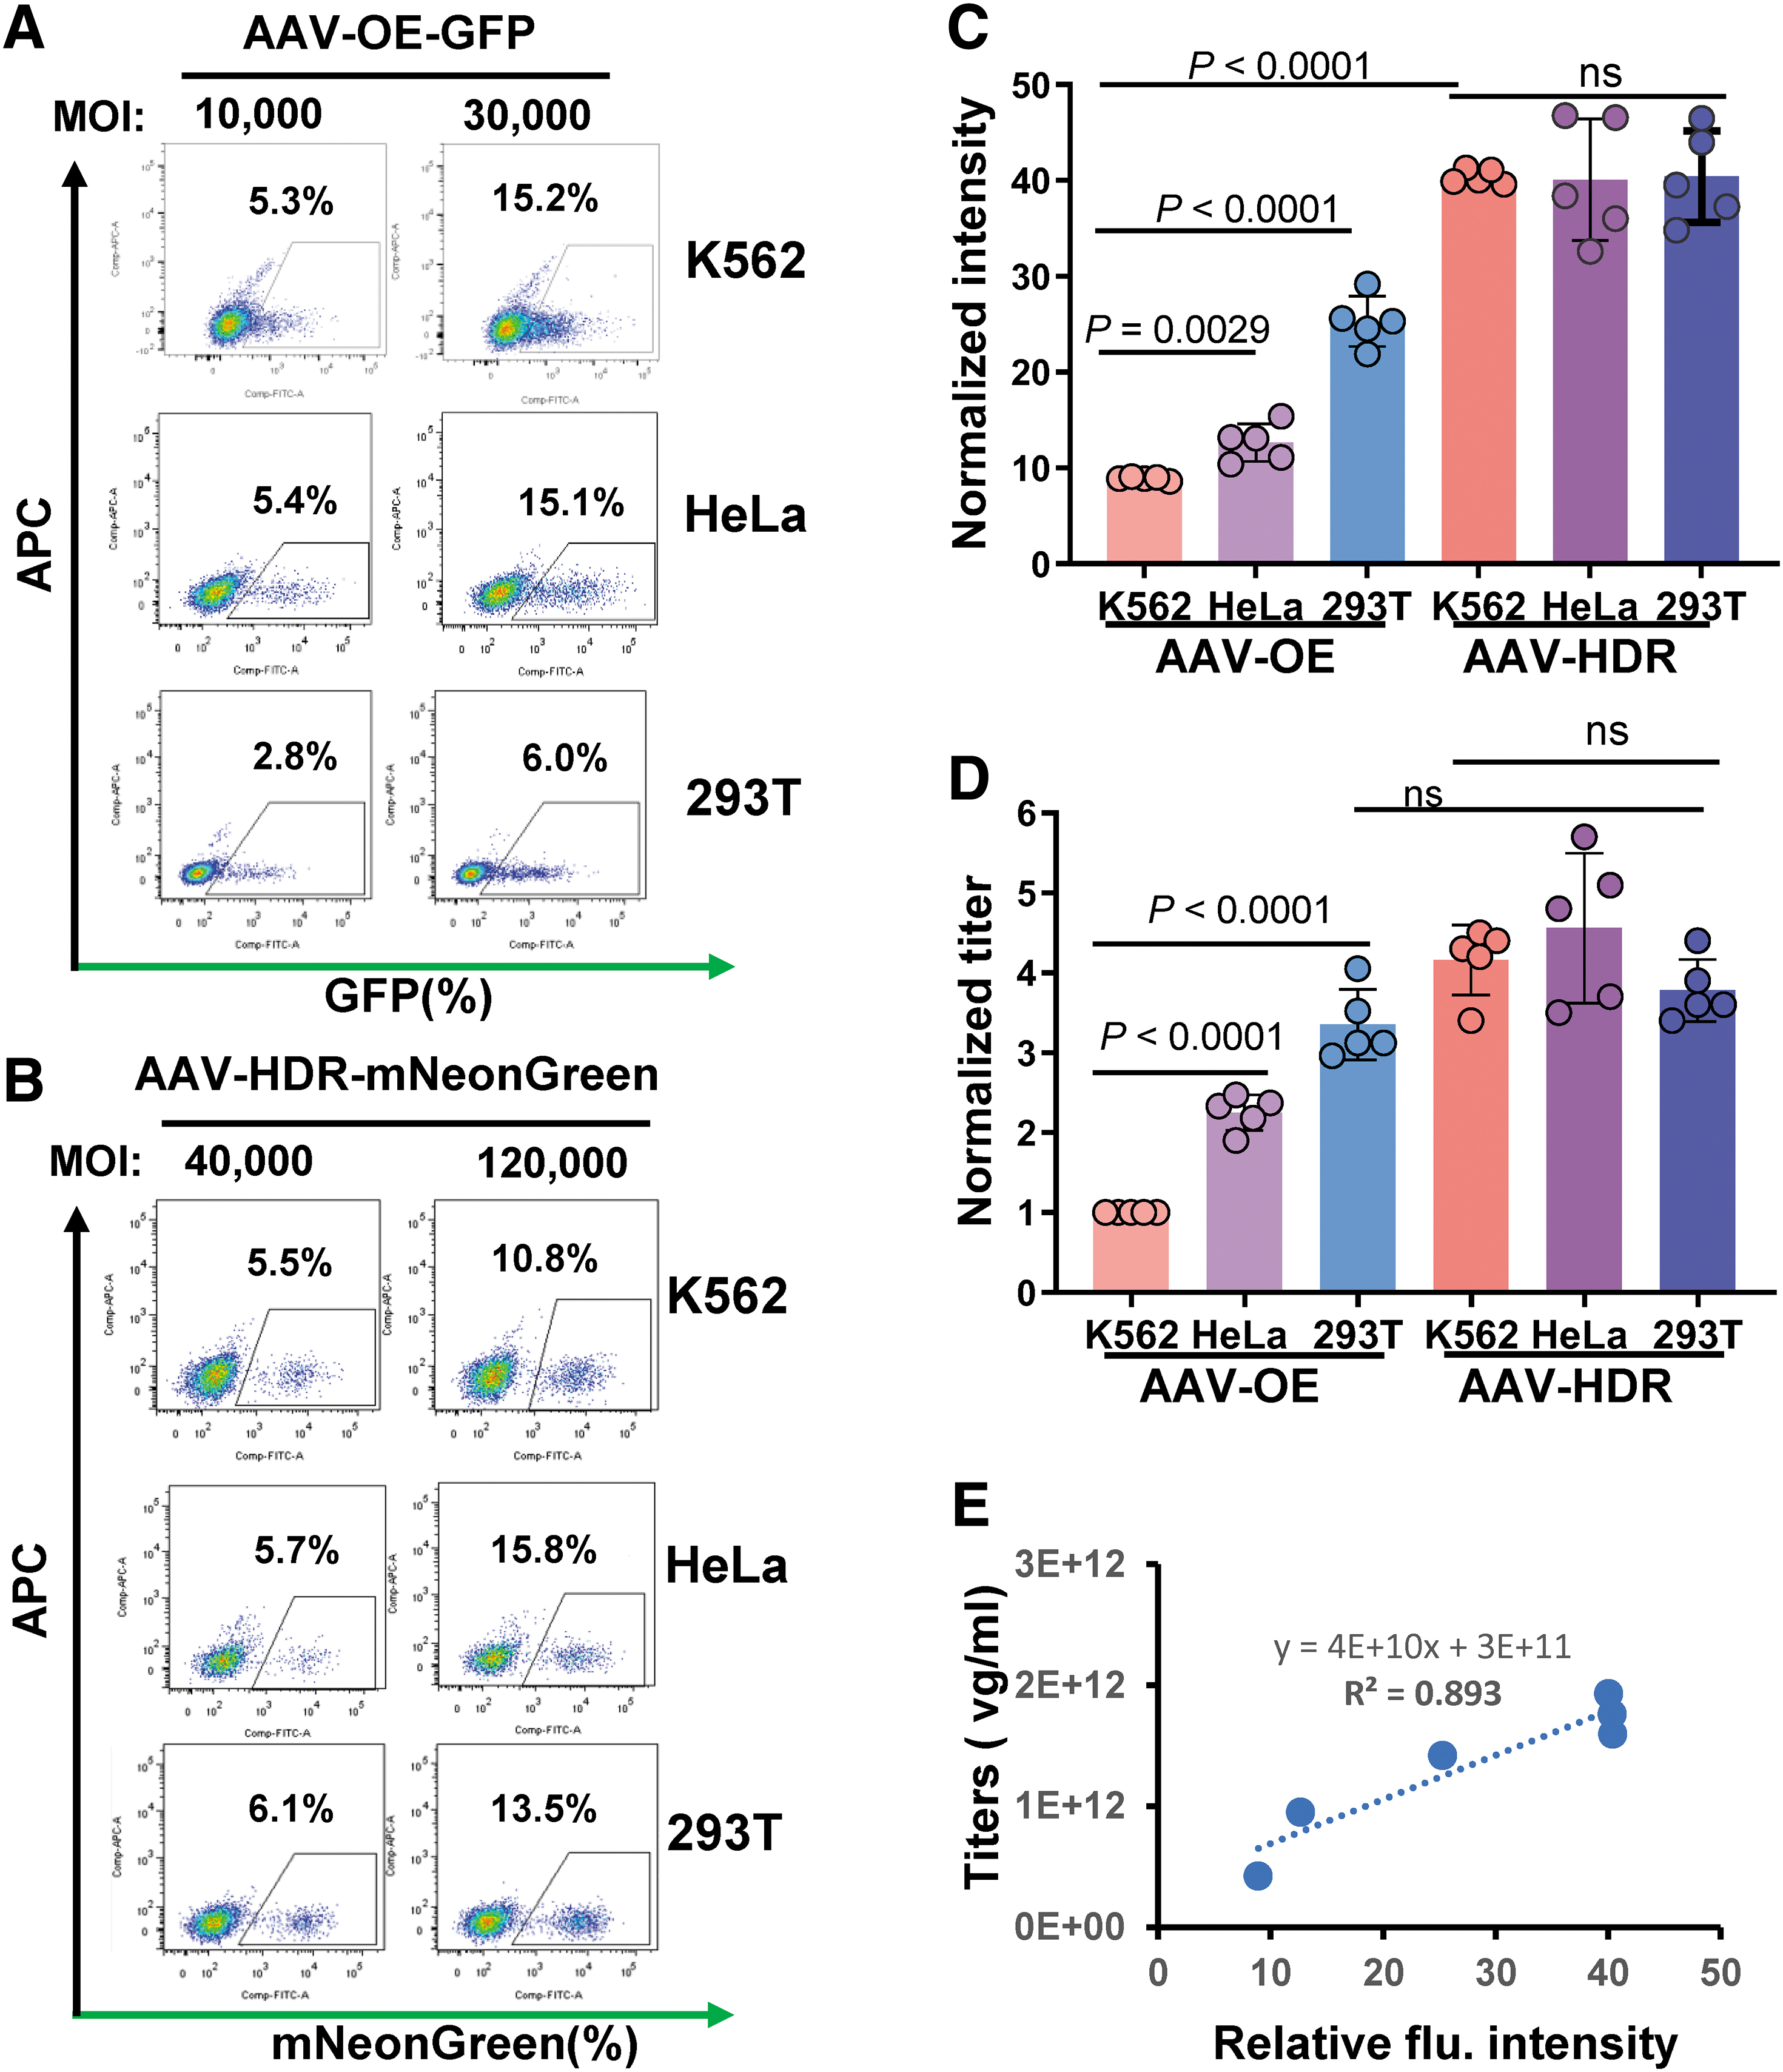
The AAV-HDR assay has emerged as a potent tool for detecting AAV-NAb titers. To validate its broad applicability, we conducted studies on HeLa-SpCas9 and HEK293T-SpCas9 cell lines, juxtaposing the outcomes with those from the AAV-OE technique. Flow cytometry assessments 2 days post-AAV transduction displayed a broad spectrum of fluorescence-positive cells for the AAV-OE method (Fig. 5A). In contrast, the AAV-HDR approach yielded a sharply defined fluorescence-positive cluster, independent of MOI, on transducing three Cas9-expressing cell lines with sgEEF2 (Fig. 5B). Absolute Z score analysis further corroborated this, 37 indicating a significantly tighter distribution for the AAV-HDR assay than for the AAV-OE assay (Supplementary Fig. S7A, B).
CRISPR-AAV-HDR versus AAV-OE: a comparative titer assay snalysis.
In terms of fluorescence intensity, AAV-OE transduction led to an approximately twofold elevation in mean fluorescence intensity (MFI) in HEK293T cells relative to K562 and HeLa. However, the AAV-HDR method indicated consistent MFIs across cell lines, with values two to four times surpassing the AAV-OE results (Fig. 5C).
Subsequent NAb titer examinations on serially diluted serum samples illuminated stark contrasts. The AAV-OE method displayed notable variability, with HEK293T cells presenting almost double the titers observed in K562 and HeLa cells. However, intriguingly, the AAV-HDR-derived titers were similar to those from the HEK293T cells processed via the AAV-OE technique (Fig. 5D).
Our correlation analysis shed light on the observed discrepancies, uncovering a notable positive association (R 2 > 0.89) between the fluorescence intensity in AAV-transduced cells and the derived titers (Fig. 5E). In addition, when we assessed the relative copy number of the AAV vector in the cells across both methodologies, we discerned robust correlations among the reporter gene expression rate, MOI, and the relative copy number. This evidence underscores that both the AAV-OE and AAV-HDR methods consistently relate the reporter gene expression ratio, MOI, and relative copy number of the AAV vector in cells (Supplementary Fig. S7C, D).
In essence, the diminished fluorescence intensity after AAV-OE transduction may render some cells undetectable by flow cytometry. Contrarily, transgene integration driven by the AAV-HDR method leads to pronounced, stable expression, underscoring the AAV-HDR assay's superiority in gauging AAV NAb titers with enhanced reliability and sensitivity.
AAV-HDR assay exhibits strong anti-interference ability
Recent findings indicated that the synergistic use of TSA and M3814 small molecules amplified gene KI efficiency by two- to threefold when using AAV6 donors in human iPS cells. 33 With this in mind, we postulated that these molecules might similarly enhance the HDR efficiency of serotype eight vectors in K562 cells, potentially allowing for reduced vector dosages and heightened detection sensitivity. In our investigations, after treating electroporated K562-Cas9 cells with both M3814 and TSA, we noted an ∼1.2-fold augmentation in both HDR frequency and fluorescence intensity (Fig. 6A–D). Crucially, when examining the influence of these small molecules on antibody titer determination, the results remained consistent, revealing no notable titer discrepancies using identical serum samples (Fig. 6E). This underscores the AAV-HDR method's resilience against potential interference, establishing its reliability even when incorporating enhancing agents.
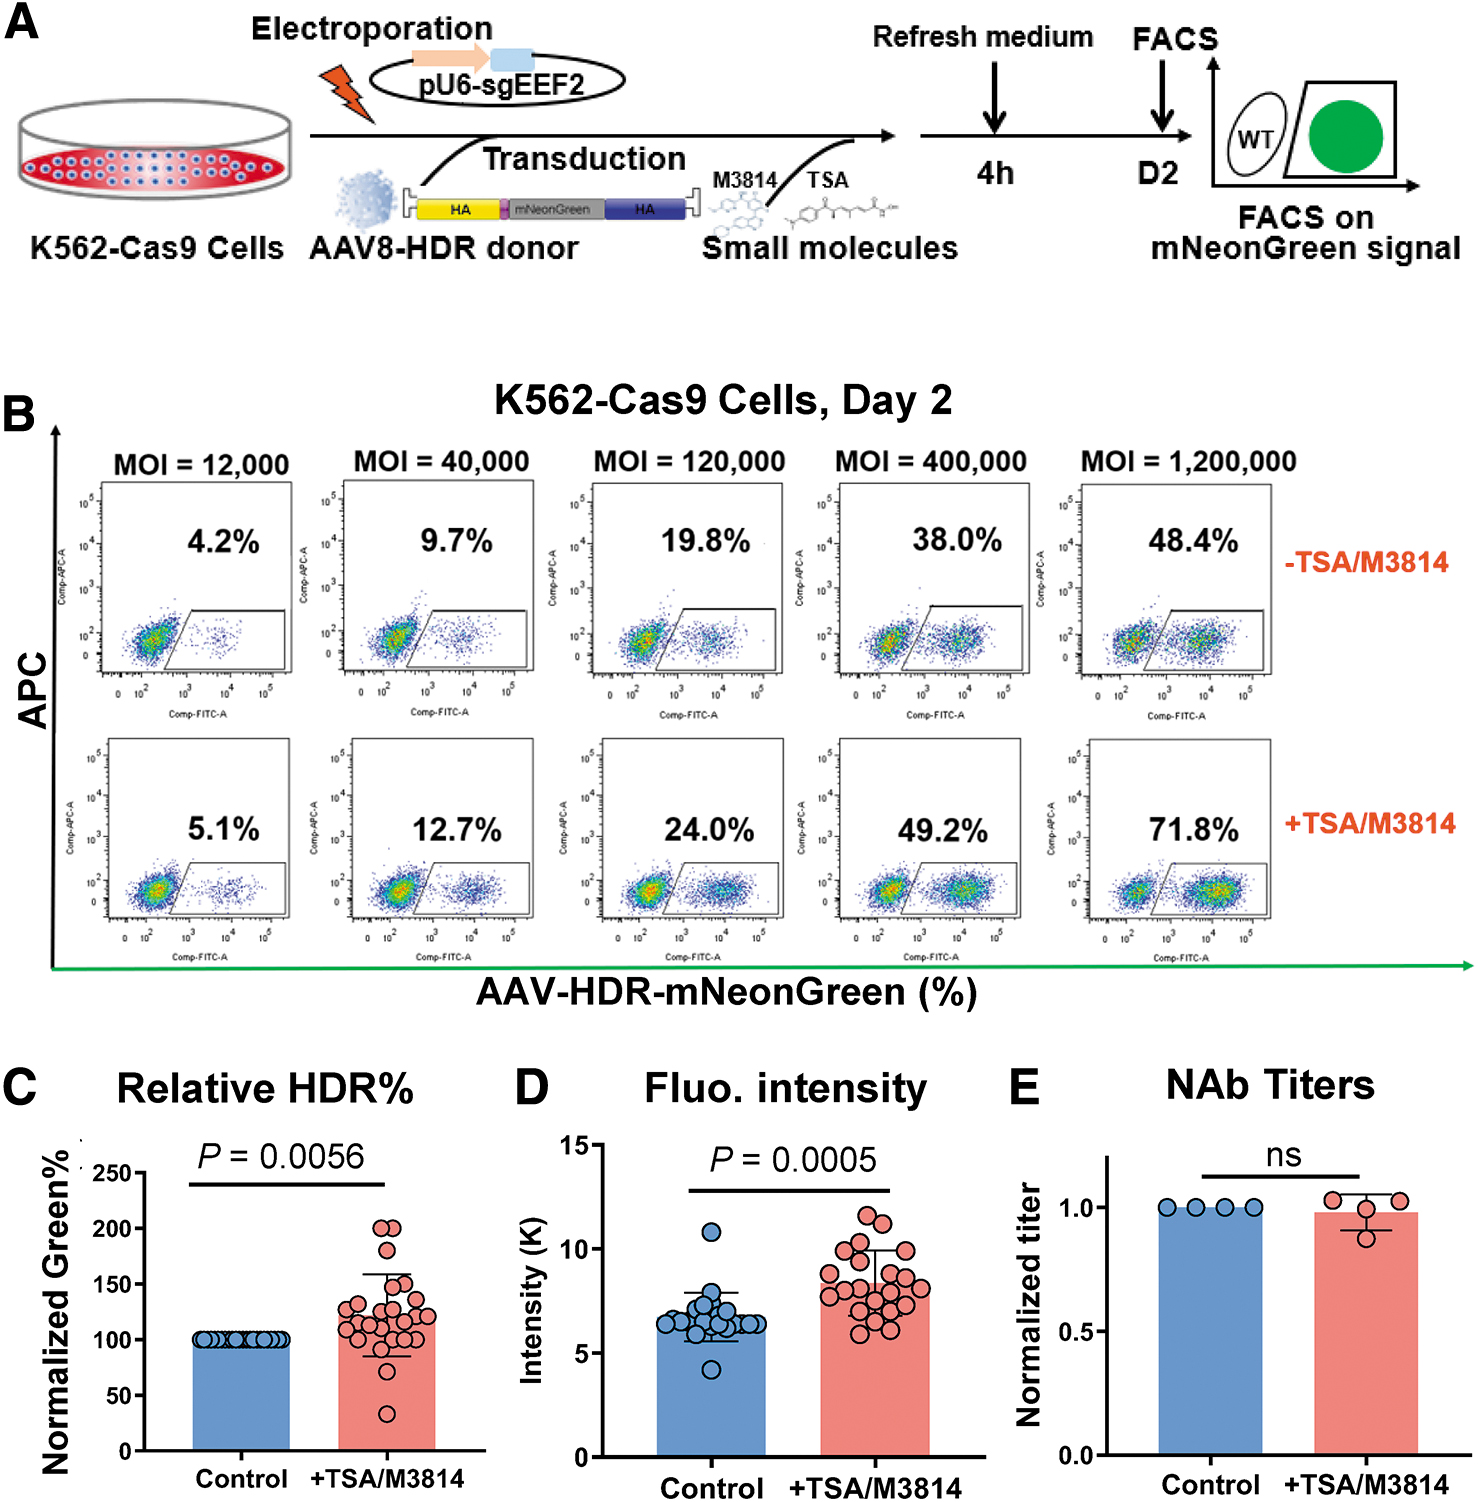
Augmenting AAV-HDR efficiency with small molecules without impacting NAb titer results.
Benchmarking the AAV-HDR assay against the traditional NT50 approach
To validate the AAV-HDR assay and benchmark its quantitative NAb titer findings, we juxtaposed it against the traditional NT50 assay. The latter, a canonical method, gauges antibody titers by pinpointing the dilution that lessens luciferase expression by 50%. Employing a series of twofold gradient dilutions, we assessed serum samples across the two assays, resulting in nine distinct dilution factors for evaluation (1 × , 2 × , 4 × , 16 × , 64 × , 128 × , 256 × , 512 × , 1,024 × ).
Surprisingly, the NT50 method revealed a weak correlation (R 2 > 0.60) with the serum dilution factor. Beyond a dilution factor of 50, the titer results began to scatter, manifesting in a nonlinear and seemingly erratic gradient relationship (Fig. 7A). In stark contrast, the AAV-HDR assay exhibited a potent correlation (R 2 > 0.98) with the serum dilution factor, validating its detection sensitivity even at an impressive 1,000-fold dilution (Fig. 7B). Moreover, the AAV-OE assay maintained a robust alignment with both the AAV-HDR and NT50-derived NAb titer values, as indicated by their R 2 values exceeding 0.97 (Fig. 7C, D). Further, the AAV-HDR assay exhibited a robust correlation (R 2 > 0.98) with NT50 values of NAb titers (Fig. 7E). These results validate AAV-HDR's superior sensitivity, dependability, and consistency in gauging AAV-NAb titers.
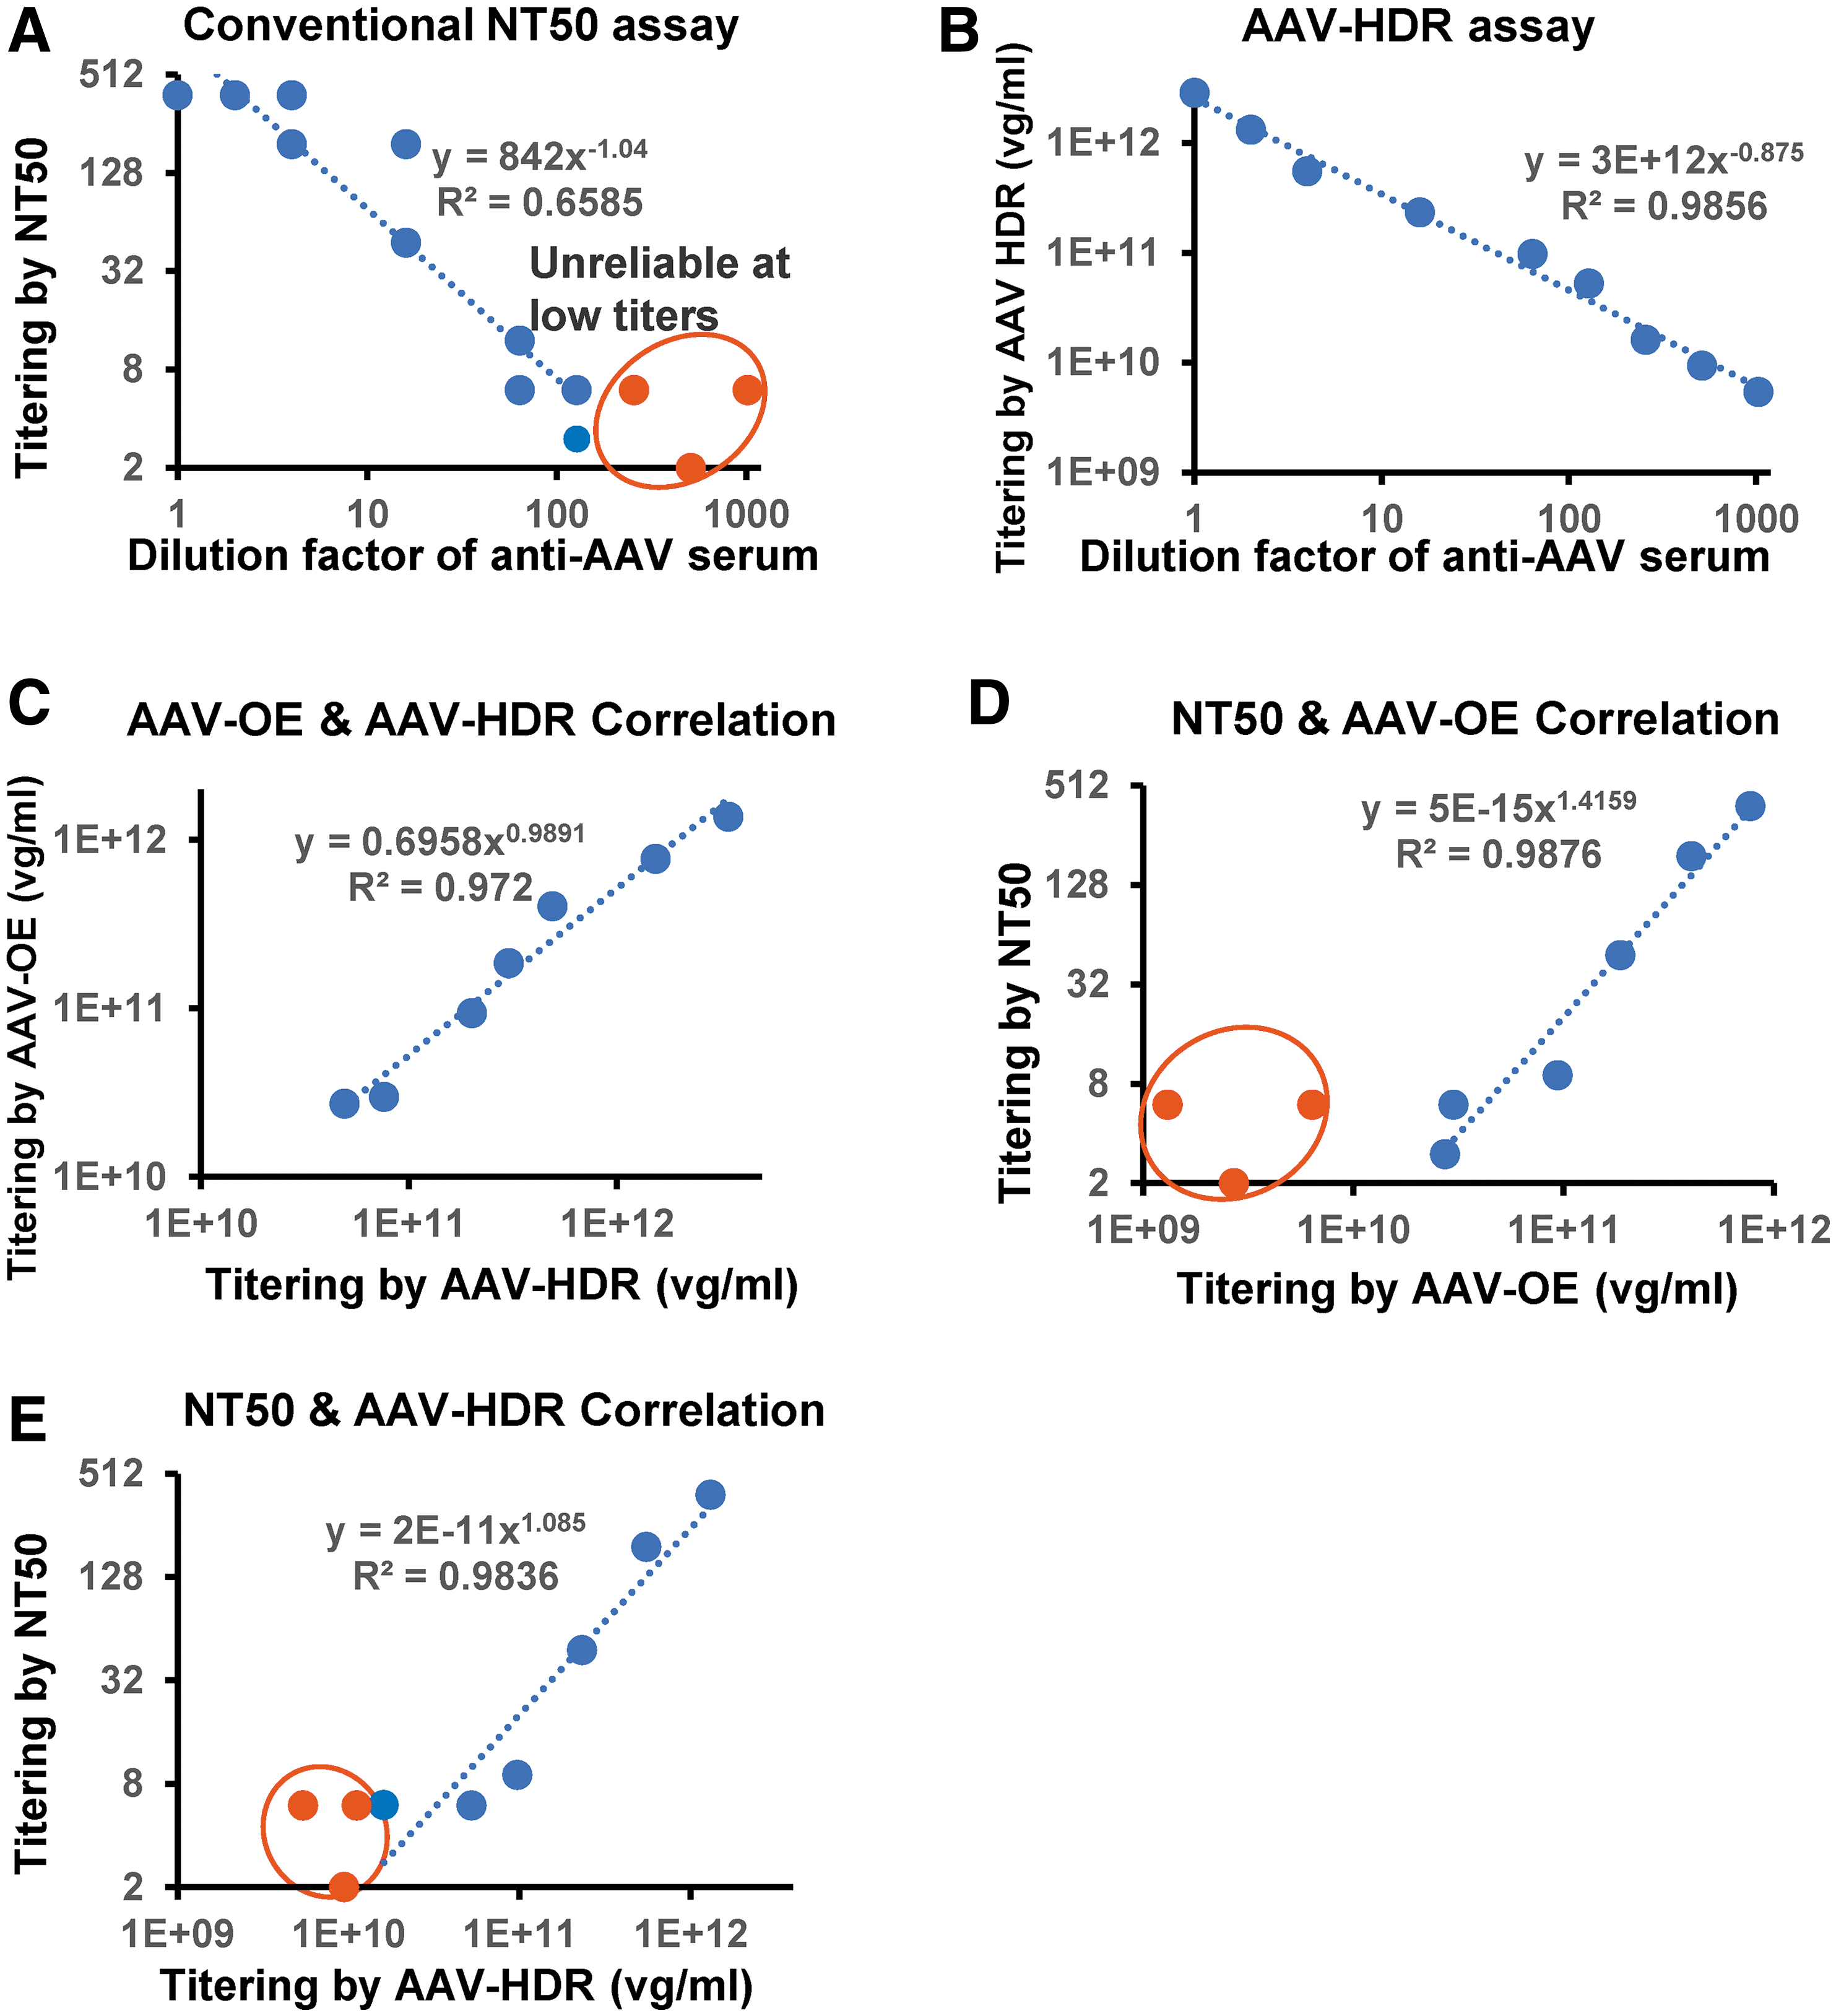
AAV-HDR assay mirrors conventional NT50 assay but exibits superior sensitivity and consistency.
DISCUSSION
The therapeutic potential of AAV vectors in gene therapy, despite receiving approvals in both the United States and Europe, is overshadowed by the challenge of preexisting antibodies against AAV. These antibodies create a barrier, potentially excluding a significant number of individuals (30–60%) from benefiting from the treatment because these NAbs obstruct AAV transduction. Even within a single assay, the prevalence of NAbs can exhibit wide variations. 5,7,38 In addition, cross-reactivity across AAV serotypes adds another layer of complexity, making it difficult to use AAV gene therapy in patients who already have NAbs against specific serotypes.
Inconsistencies abound in assay conditions, in both preclinical studies and clinical trials. 39 Particularly, the AAV dose and the volume of the serum can primarily dictate the NAb titers. Thomas Weber proposed a potential solution, emphasizing the importance of denoting the number of AAV particles neutralized per microliter of serum (or plasma) rather than the conventional dilution ratio for more consistent comparisons across different laboratories. 40 While discrepancies might stem from the varying nature of neutralization assays, quantifying the number of neutralizable AAV particles per mL of serum (or plasma) emerges as the most precise metric for conveying the serum (or plasma) neutralization factor. However, the challenge persists. A significant number of publications lack comprehensive methodologies and materials for NAb detection, making standardization a difficult task.
The gene therapy community urgently needs a unified and standardized detection method. Such a method would bridge the gaps, allowing for seamless comparison and knowledge sharing, and would ultimately expedite the clinical application of AAV gene therapy.
Traditional NAb analysis relies on a positive control for antibody titer determination. Specifically, this method gauges the antibody titer by discerning the dilution at which there is a 50% inhibition of luciferase expression. 12 This is done by calculating the luciferase signal inhibition ratio, which involves measuring the average luciferase signal for each sample, comparing it with the positive control signal, and subtracting the result from 100%. 41 –44 However, this approach is not without its challenges. Standard fluorescence readers only capture the relative light unit signal, and the selection of the fluorescence reader can substantially influence the assay outcome. In fact, discrepancies as large as tenfold between different readers have been documented. 12
In recent years, flow cytometry has surged in prominence due to its unparalleled capability to swiftly analyze multiple attributes of millions of cells simultaneously. 45 Recognizing its potential, we initially harnessed flow cytometry to devise an advanced AAV-OE technique for assessing NAbs. While this approach yielded encouraging outcomes, it was not devoid of shortcomings, most notably its dependence on specific cell lines. Consequently, there is an urgent need for a method that is independent of cell lines, offering both sensitivity and reproducibility in gauging AAV transduction efficiency.
To tackle the existing challenges in NAb analysis, we introduced the AAV-HDR assay, leveraging the CRISPR-Cas9 system. This innovative method consistently showcased dependable results across a spectrum of cell lines, AAV dosing, and small molecules, highlighting its adaptability and superior reproducibility. In contrast, the AAV overexpression (AAV-OE) technique presented NAb titers that were two to three times lower for identical serum samples. This discrepancy hints at the AAV-OE method's potential to undervalue the true antibody titers.
Our comparative analysis revealed that both the AAV-OE and AAV-HDR assays correlate well with the conventional NT50 values for NAb titers, each showcasing an R 2 value >0.98. However, when juxtaposed, the AAV-HDR method emerges superior. Its independence from particular cell lines, paired with its exceptional repeatability and heightened sensitivity, sets it apart. The robust congruence between AAV-HDR outcomes and the well-established NT50 benchmarks underscores the potential of the AAV-HDR assay as a formidable alternative for NAb titer evaluation. Impressively, the AAV-HDR assay exhibits unparalleled sensitivity, adeptly discerning even low-titer serum samples, thus amplifying the assay's overall sensitivity. We are optimistic about the method's potential and foresee its application in future studies, encompassing diverse AAV serotypes, a range of cell types, and alternative HDR editing sites, all aiming at refining the determination of AAV NAb titers.
The exclusion of patients from gene therapy trials due to antibody presence raises both ethical and medical concerns. Current methodologies to gauge AAV vector's neutralizing activity in patients, while diverse, each come with their set of limitations. Ensuring that these methods are validated across different laboratories is pivotal for generating uniform data, which, in turn, can guarantee fair access to treatments in early-phase clinical studies. Our AAV-HDR technique offers particular advantages, especially for those patients with low NAb titers who need a precise and sensitive test to determine their suitability for AAV gene therapy. This method does not just measure the AAV NAbs; it aids clinicians in ascertaining the exact volume of AAV required to induce the desired therapeutic effect. This study paves the way for uniform therapeutic outcomes for those with low to intermediate NAb levels.
For individuals with elevated AAV antibody levels, the AAV-HDR method offers a systematic approach to determine the required amount of AAV empty capsids to neutralize these antibodies, supporting a more precise AAV gene therapy application. 46,47 Recently, the potential use of immunoglobulin G (IgG)-degrading enzymes, notably IdeS/IdeZ, has been highlighted as a strategy to address NAbs. 48,49 These enzymes have demonstrated their ability to degrade IgG in serum samples across different species, leading to improved IgG clearance and a reduction in AAV-neutralizing activity. Our refined NAb assays prove beneficial in such contexts, given their capacity to identify subtle variations in NAb titers, which might be missed by conventional assays. Combining the use of IgG-degrading enzymes with the AAV-HDR method might further refine and optimize AAV gene therapy applications.
Based on our extensive experimentation, we recommend the following protocol for accurately determining NAbs in an unidentified sample:
Limitation of GFP-Positive Cells: It is imperative to confine the range of GFP-positive cells in the test tubes between 10% and 90% of the highest recorded levels. Any data points that lie outside this range should be disregarded.
Formulation of a Standard Curve: For titration of an unidentified sample, a standard curve should be prepared using MOIs that span from 300 to 30,000, distributed across six distinct data points.
Testing Sample Volume and MOI: We advocate the use of an AAV MOI of 10,000 coupled with sample volumes of 1, 2, 4, or 8 μL for the test specimens. If the observed titers are exceedingly high or low, the standard curve should be recalibrated. For samples with low titers, an MOI of 1,000 is preferred. Conversely, for samples displaying higher titers, an MOI of 100,000 is recommended to re-evaluate the NAb titers.
Rigorous adherence to the procedure cited earlier ensures the derivation of accurate and dependable titer values.
In conclusion, the AAV-HDR titration assay, with its refined sensitivity and precision, offers a reliable method for quantifying AAV-NAbs in clinical environments. This approach may streamline the evaluation process of neutralizing activity in AAV-based gene therapies, providing improved insights into treatment efficacy and safety. Consequently, this could facilitate more informed advancements in gene therapies for a range of diseases.
Footnotes
ACKNOWLEDGMENTS
The authors would like to extend their gratitude to Jiao Ma from the Laboratory of Hematology Hospital, Chinese Academy of Medical Sciences (Tianjin, China), for her contribution to conducting the NT50 titer testing of AAV8 antibodies in serum samples. They also thank Zhikang Zhang for contributing to developing the Python code for calculating the AAV antibody titers.
AUTHORs' CONTRIBUTIONS
X.B.Z., T.C., and J.P.Z. supervised the study. G.L., S.T., X.S., M.Z., F.Z., and J.P.Z. designed and conducted the experiments; G.L. and X.B.Z. analyzed the results. X.B.Z., G.L., and X.S. wrote the manuscript. All authors discussed the results and reviewed the manuscript. All the authors have read and approved the final manuscript.
AUTHOR DISCLOSURE
The authors declare that they have no competing interests.
FUNDING INFORMATION
This work was supported by the National Key Research and Development Program of China (Grant Nos. 2019YFA0110803, 2019YFA0110204, 2019YFA0110802, and 2021YFA1100900), the National Natural Science Foundation of China (Grant Nos. 81870149, 82070115, 81770198, 81890990, and 81730006), the Chinese Academy of Medical Sciences (CAMS) Innovation Fund for Medical Sciences (CIFMS) (Grant Nos. 2022-I2M-2-003, 2022-I2M-2-001, 2021-I2M-1-041, 2021-I2M-1-040, and 2021-I2M-1-001), the Nonprofit Central Research Institute Fund of Chinese Academy of Medical Sciences (Grant No. 2020-PT310-011), the Tianjin Synthetic Biotechnology Innovation Capacity Improvement Project (Grant No. TSBICIP-KJGG-017), the CAMS Fundamental Research Funds for Central Research Institutes (Grant No. 3332021093), and the Haihe Laboratory of Cell Ecosystem Innovation Fund (Grant No. HH22KYZX0022) and the State Key Laboratory of Experimental Hematology Research Grant (Grant No. Z23-05).
SUPPLEMENTARY MATERIAL
Supplementary Figure S1
Supplementary Figure S2
Supplementary Figure S3
Supplementary Figure S4
Supplementary Figure S5
Supplementary Figure S6
Supplementary Figure S7
Supplementary Table S1
References
Supplementary Material
Please find the following supplemental material available below.
For Open Access articles published under a Creative Commons License, all supplemental material carries the same license as the article it is associated with.
For non-Open Access articles published, all supplemental material carries a non-exclusive license, and permission requests for re-use of supplemental material or any part of supplemental material shall be sent directly to the copyright owner as specified in the copyright notice associated with the article.