




Abstract
Background:
Low app engagement is a central barrier to digital mental health efficacy. With mindfulness-based mental health apps growing in popularity, there is a need for new understanding of factors influencing engagement. This study utilized digital phenotyping to understand real-time patterns of engagement around app-based mindfulness. Different engagement metrics are presented that measure both the total number of app-based activities participants completed each week, as well as the proportion of days that participants engaged with the app each week.
Method:
Data were derived from two iterations of a four-week study exploring app engagement in college students (n = 169). This secondary analysis investigated the relationships between general and mindfulness-based app engagement with passive data metrics (sleep duration, home time, and screen duration) at a weekly level, as well as the relationship between demographics and engagement. Additional clinically focused analysis was performed on three case studies of participants with high mindfulness activity completion.
Results:
Demographic variables such as gender, race/ethnicity, and age lacked a significant association with mindfulness app-based engagement. Passive data variables such as sleep and screen duration were significant predictors for different metrics of general and mindfulness-based app engagement at a weekly level. There was a significant interaction effect for screen duration between the number of mindfulness activities completed and whether or not the participant received a mindfulness notification. K-means clusters analyses using passive data features to predict mindfulness activity completion had low performance.
Conclusions:
While there are no simple solutions to predicting engagement with mindfulness apps, utilizing digital phenotyping approaches at a population and personal level offers new potential. The signal from digital phenotyping warrants more investigation; even small increases in engagement with mindfulness apps may have a tremendous impact given their already high prevalence of engagement, availability, and potential to engage patients across demographics.
Introduction
Mindfulness interventions are exercises and strategies that have been shown to be effective at improving a range of psychological conditions. A 2021 systematic review of 44 meta-analyses of randomized controlled trials (RCTs) of mindfulness interventions reported effects sizes ranging from (ds = 0.3-1.18). 1 The potential to offer mindfulness interventions via smartphones is well-recognized, and today mindfulness apps are the most common and highly utilized type of mental health app in the commercial marketplace. 2 Yet mindfulness apps have failed to deliver impressive results, with a 2022 review of RCTs of popular mindfulness apps suggesting minimal effectiveness. 3
This is not to say mindfulness apps are not effective. A 2021 review suggested they can be helpful, but with effect sizes often even smaller than the lower end of ds = 0.3. 4 While there are many reasons mindfulness apps may struggle to reach their full potential, one central facet is engagement. 5 The concept of app engagement may encompass different measures and definitions, but typically involves the frequency of users’ app engagement and the amount of time a user spends on an app, as well as how much users interact with or complete activities within an app. 6 Numerous efforts from gamification 7 to machine learning 8 and even cash incentives 9 have made little overall difference in mindfulness app engagement or outcomes. While these and other research efforts are important to continue to pursue, certain areas remain unexplored, including how apps can be tailored to individual participants, the potential for integration across multiple applications, and the design principles used in application development. For this article, our focus is on the need to personalize app content to individual users.
The need to personalize app content to individual users is not novel. While most mental health apps today rely on surveys to help customize content, 10 surveys suffer from the same engagement challenges that personalization seeks to solve. Thus, the use of sensor data, often referred to as passive data or digital phenotyping, offers an alternative. Using sensors to automatically capture data on a user’s state (e.g., Global Positioning System (GPS) indicating a user is at home after a night of good sleep versus GPS data indicating a user is at work and has heavy screen time) may offer critical information to help increase app engagement. Understanding not only when people engage but also in what physical, physiological, and psychological state presents an unexplored opportunity to better personalize and increase engagement with all apps, including mindfulness apps. Further, certain passive data features such as sleep quality are associated with mindfulness app engagement, making sleep duration a particular passive data variable of interest that may demonstrate patterns with mindfulness app engagement. 11,12 There are fewer findings about potential associations between other passive data variables with app engagement, and research in this area may be hindered by the fact that these associations may be different for different people based on individual patterns, routines, and habits. However, it can be hypothesized that other passive data features, such as home time and screen duration, may be associated with app engagement patterns at the individual level. For example, it seems probable that higher screen duration may be associated with increased app engagement, and similarly with higher home time.
This study aims to explore how digital phenotyping data can inform patterns of engagement around app-based mindfulness. Given the increasing prevalence of digital phenotyping platforms and the myriad mindfulness apps already in existence, our goal is to find weekly digital patterns agnostic of any particular product or app so results can be replicated, expanded, and generalized by others in the future. Thus, in this study, we assess three broadly accessible digital phenotyping data streams obtainable from both Android and Apple phones: sleep duration, screen duration, and home time.
Methods
Secondary analysis background
This study is a secondary analysis performed on data from two iterations of a study exploring broad app engagement in college students. The protocol for this study has already been published, 13 and results around the prediction of symptoms have been published as well. 14 The study recruited undergraduates via Reddit. For undergraduates to participate in the study, they were required to complete a screener survey and meet the following inclusion criteria: undergraduates must be 18 years or older, score at least 14 on the Perceived Stress Scale (PSS), 15 be enrolled as an undergraduate for the 28-day study duration, own a smartphone able to run and operate mindLAMP, be able to sign written informed consent, and pass a three-day run-in period during which they demonstrated consistent survey completion and smartphone sensor collection. During consent, participants were informed about each sensor that the app would record, how they could revoke access to any sensor at any time, and how they could stop all data collection immediately by deleting the app from their smartphone. Written informed consent was obtained in this study in line with best practices for digital mental health research. 16 –18
Each week for four weeks, study participants were scheduled to complete different sets of activities on mindLAMP, an open-source app developed by the Digital Psychiatry Lab at Beth Israel Deaconess Medical Center. In the first study iteration analyzed, all participants were scheduled to complete mindfulness activities during their third week of involvement. In the second iteration, the order of week of mindfulness (i.e., 1st week, 2nd week, 3rd week, or 4th weeks) varied based on participants’ intake anxiety scores. Thus, in both versions of the study, participants were scheduled to complete daily mindfulness activities for a one-week duration over the four-week study. The mindfulness activities were audio-based and featured an image of a flower opening and closing at a constant rate as the only interactive component. Each mindfulness activity was approximately 7 min long. In both iterations, participants could access the mindfulness interventions on demand, regardless of whether or not they were scheduled. No payment or incentive to use the app was offered in either iteration. Combining study iterations offers the advantage of an increased sample size.
Ethical approval
The authors assert that all procedures contributing to this work comply with the ethical standards of the relevant national and institutional committees on human experimentation and with the Helsinki Declaration of 1975, as revised in 2008. All procedures involving human subjects/patients were approved by the Beth Israel Deaconess Medical Center IRB (#2000P000310).
Digital phenotyping smartphone metrics
While it is possible to generate an infinite number of digital phenotypes from the raw smartphone data streams of GPS, accelerometer, and screen state, we focused on only three resulting digital phenotypes in our analysis: sleep duration, home time, and screen duration. This is because further derived features are often highly correlated (e.g., home time ∼ distance traveled per day) and can lead to overfitting in models and estimates. The sleep duration passive data feature is derived from the smartphone’s accelerometer and screen duration sensors, and is an estimate in milliseconds of the amount of time participants are sleeping. The home time feature represents how much time each day a participant spends at their home and is also measured in milliseconds. The screen duration feature is a measure of how much time a participant spends each day with their phone screen on.
For both study iterations combined, the same ordinary least squares (OLS) method was used to determine which passive data variables—sleep duration, home time, and screen duration—were significant in predicting metrics of both mindfulness engagement and total app engagement at a weekly level. The weekly level was chosen as an informative time period to analyze because a person’s engagement depends on many cumulative factors, not just their actions and feelings in a single 24-h span. Additionally, people have weekly routines and patterns, meaning that at a weekly level it is still possible to see meaningful consistencies or deviations across metrics.
The metrics used as independent variables were the following measures of engagement: total number of mindfulness activities completed that week, the proportion of days that week in which mindfulness activities were completed, and the proportion of days that week in which any activity (including non-mindfulness activities) was completed. Non-mindfulness activities included accessing psychoeducation material in the app, self-reported surveys completed in the app, cognitive behavioral therapy-related exercises completed in the app, and reviewing personal data reported back in the app.
Two-way analysis of variance (ANOVAs) from the statsmodels.api package in Python were performed on all participants using each of the passive variables as the dependent variable. The categorical variables for the ANOVAs were (1) whether or not the participant received mindfulness activities scheduled that week and (2) the number of mindfulness activities completed that week, stratified into the categories of no mindfulness, a low number of mindfulness activities completed (< median), and a high number of mindfulness activities completed (≥ median).
K-means clustering
The scikit-learn.cluster package was utilized to conduct k-means clustering analyses with the mean weekly passive data features of GPS data quality, home time, screen duration, and sleep duration as clustering variables. Two clustering analyses were performed; one analysis included all participants (n = 169), and the other included only participants who had completed at least one mindfulness activity (n = 115).
Utilizing the elbow method and the kneed package, the optimal number of clusters was determined to be three for all participants and four for participants who had completed mindfulness activities. For the first clustering analysis, participants were grouped into three levels of mindfulness activity completion; as stated previously, the categories were no, low, and high. For the second analysis, participants were grouped into four levels of mindfulness activity completion: low (<25th percentile), medium (between the 25th and median percentiles), high (between the median and 75th percentile), and very high (≥75th percentile).
Clinical case analysis
Individual case studies were investigated at the daily level using the Pearson correlation function in the Pandas package to create correlation heatmaps of participants’ daily passive data and the number of mindfulness activities completed. The matplotlib.pyplot function was used to superimpose line graphs of the daily passive and activity data for visual analysis.
The clinical analysis cases included the following additional data features: entropy, a measure of how much a participant moves around to different locations, and GPS data quality, a measure from 0 to 1 of how much smartphone sensor data was being collected by the app.
Demographic variable testing
While the two study iterations both collected demographic data about participants’ gender, race and ethnicity, other demographic variables differed between iterations. Variables included in the first study iteration were age, intake PSS scores measured out of 40, whether or not participants had contracted COVID-19, year in school, and living situation (i.e., on-campus, off-campus, or at home). The second study iteration did not include any of those variables but did have data about participants’ device type (i.e., iOS or Android).
We employed OLS, implemented in the statsmodels.api package in Python version 3.8.8, for each study iteration to determine the marginal significance of demographic variables in predicting general engagement, measured as the average number of all activities participants completed each day. Dummy variables were used to represent different levels of the categorical variables.
For the first study iteration, the log-transform of the dependent variable was taken to meet assumptions for the OLS model.
19
The underlying relationships between independent and dependent variables corresponding to these models (one model for each independent variable, x) are:
The log-likelihood (llf) function from the statsmodels.regression package was used for both study iterations to compare OLS models with and without the dummy variable categories and further determine variable significance.
Due to the difference in demographic data between study iterations, different methods were used to investigate the relationships between individual demographic variables and mindfulness-specific engagement, measured as the total number of mindfulness activities participants completed. For the first study iteration, Kruskal–Wallis tests from the scipy.stats.kruskal package were performed individually for each of the five demographic variable categories. Because the second study iteration had only three demographic variables, a three-way ANOVA from the statsmodels.api package was conducted.
Results
Engagement data were analyzed from 169 participants with 717 total observations. Ninety-six participants were from the first study iteration, and 73 were from the second. There was no participant overlap between studies. Of these 169 participants, 123 were scheduled for mindfulness activities during the study. Participants were in the study for an average of 26.5 days, with a standard deviation of 8.48 days.
For the demographic analysis, data were analyzed from 163 participants (6 participants from the second study iteration did not complete demographic questionnaires). Patient characteristics for both iterations are depicted in Table 1.
Characteristics of the Participants (n =169)
For all 169 participants, the mean number of mindfulness activities was 1.57 per week over the four weeks of this study, with an interquartile range (IQR) of 0. Of the 123 participants who were scheduled for mindfulness activities, 30 completed no mindfulness activities during their time in the study. The maximum number of mindfulness activities completed for these scheduled participants was 33 and the mean was 6.79, with an IQR of 11.5. Of the 46 participants who were not scheduled for mindfulness, 21 completed at least one mindfulness activity. The maximum number of mindfulness activities for participants who were not scheduled was 15, with a mean of 4.19 and an IQR of 8.75.
Results are presented first in terms of static and baseline predictors (race and ethnicity, gender, age, etc.) and then by population digital phenotyping metrics (screen duration, home time, and sleep duration).
Static predictors
For the first study iteration, an OLS model was used to predict the average number of activities completed by participants each day from seven baseline and demographic predictors, represented by two continuous and 14 dummy variables [R 2 adj = 0.162, F(16, 79) = 2.151, p < 0.02]. Variables found to be significant were the dummy variable for the “Non-binary” gender category (β − 0.6788, p < 0.02), the dummy variable for the “Other” race/ethnicity category (β = −1.2242, p < 0.02), and the continuous variable PSS score (β = −0.0270, p < 0.04).
This was supported by the log-likelihood results, which showed that including the covid status, year in school, and living situation variables did not significantly improve model fit (p > 0.05), while the gender and race/ethnicity variables did improve the model fit (p < 0.03, 0.01 respectively).
Kruskal–Wallis tests were performed to examine differences in the number of mindfulness activities completed based on each of the five categorical variables. No significant differences in mindfulness activity completion were found among the differences in race and ethnicity, covid status, year in school, or living situation. A significant difference was reported for the gender category (p < 0.05).
For the second study iteration, an OLS model was used to predict the average number of activities completed by participants each day from three baseline and demographic predictors, represented by seven dummy variables [R 2 adj = −0.016, F(7, 59) = 0.8552, p > 0.5]. This model found no significant variables. Log-likelihood results showed the individual variables gender, race/ethnicity, and device type did not significantly improve model fit (p > 0.05).
For the second study iteration, the three-way ANOVAs showed that race/ethnicity and device type are not significant predictors of either the total number of activities completed or the total number of mindfulness activities completed. The ANOVA for the total number of activities completed showed gender was not a significant predictor, but gender was a significant predictor for the number of mindfulness activities completed [F(3) = 5.367, p < 0.05]. In the ANOVA for the total number of activities completed, there was a significant interaction effect between gender and device type [F(3) = 5.376, p < 0.05]. This interaction effect was not present in the mindfulness ANOVA.
Passive predictors
The OLS regression results showed sleep duration was a significant positive predictor of the number of mindfulness activities completed [R 2 adj = 0.013, F(4, 118) = 1.387, p = 0.243] and the proportion of days in a week in which any activity was completed [R 2 adj = 0.011, F(4,712) = 2.979, p < 0.05] (sleep duration p < 0.03 and p < 0.01, respectively). Additionally, greater screen duration (p = 0.01) and sleep duration (p < 0.03) were both positive significant predictors of the proportion of days in a week in which a mindfulness activity was completed [R 2 adj = 0.013, F(4,712) = 3.447, p < 0.01].
The ANOVA results found that there was a significant interaction effect (Fig. 1) for weekly screen duration between the number of mindfulness activities completed and whether or not the participant was scheduled for mindfulness that week [F(2) = 3.232, p < 0.05]. Additionally, the ANOVA for sleep duration found that whether or not there was a mindfulness scheduled was a significant variable [F(1) = 4.113, p < 0.05]. The ANOVAs conducted for home time and GPS data quality found no other significant variables or interaction effects.

Interaction effect for weekly mean screen duration between three categories of mindfulness completion (no, low, and high) and if the participant received a mindfulness prompt that week. Participants who received a prompt had a negative relationship between mindfulness activity completion and screen duration. Participants who were not prompted demonstrated little to no relationship with screen duration between categories of No and Low mindfulness activity completion, but had a strong positive relationship with screen duration between categories Low and High.
Both k-means clusters analyses predicting the level of mindfulness activity completion with passive data features exhibited low performance (Fig. 2). The analysis of all participants had an adjusted Rand index (ARI) of 0.008 and a silhouette score of 0.41, while the analysis of participants who had completed mindfulness activities had an ARI of −0.002 and a silhouette score of 0.39.

Results from k-means clustering analyses clustering all participants into three categories of mindfulness activity completion [no, low, and high] (left) and clustering participants who had completed mindfulness activities into four categories of completion [low, medium, high, and very high] (right).
Case studies
Three case studies of participants who displayed relatively high levels of mindfulness completion are examined to underscore unique aspects of this data. The goal of these examples is to highlight what these results may look like on an individual patient level and the potential of this method. The first two participants completed the most mindfulness activities on the first day of the week that they were scheduled for mindfulness.
In Case Study 1 (Fig. 3), the two passive data features most strongly correlated with the number of mindfulness activities completed were sleep duration (r = 0.38) and home time (r = 0.26). These two features were similarly correlated with the number of total non-mindfulness activities completed.

Case Study 1. Correlation heatmap of a participant’s daily passive data with their daily total and mindfulness activity completion (left). Line graph showing trends in three passive data variables with the number of mindfulness activities completed over this participant’s time in the study (right).
Case Study 2 (Fig. 4) differs from Case Study 1, in that sleep duration was the passive data feature most strongly correlated with the number of mindfulness activities completed (r = 0.43). Additionally, while home time had nearly no correlation with the number of mindfulness activities (r = 0.065), the correlation between home time and the number of total activities completed was stronger (r = 0.25).
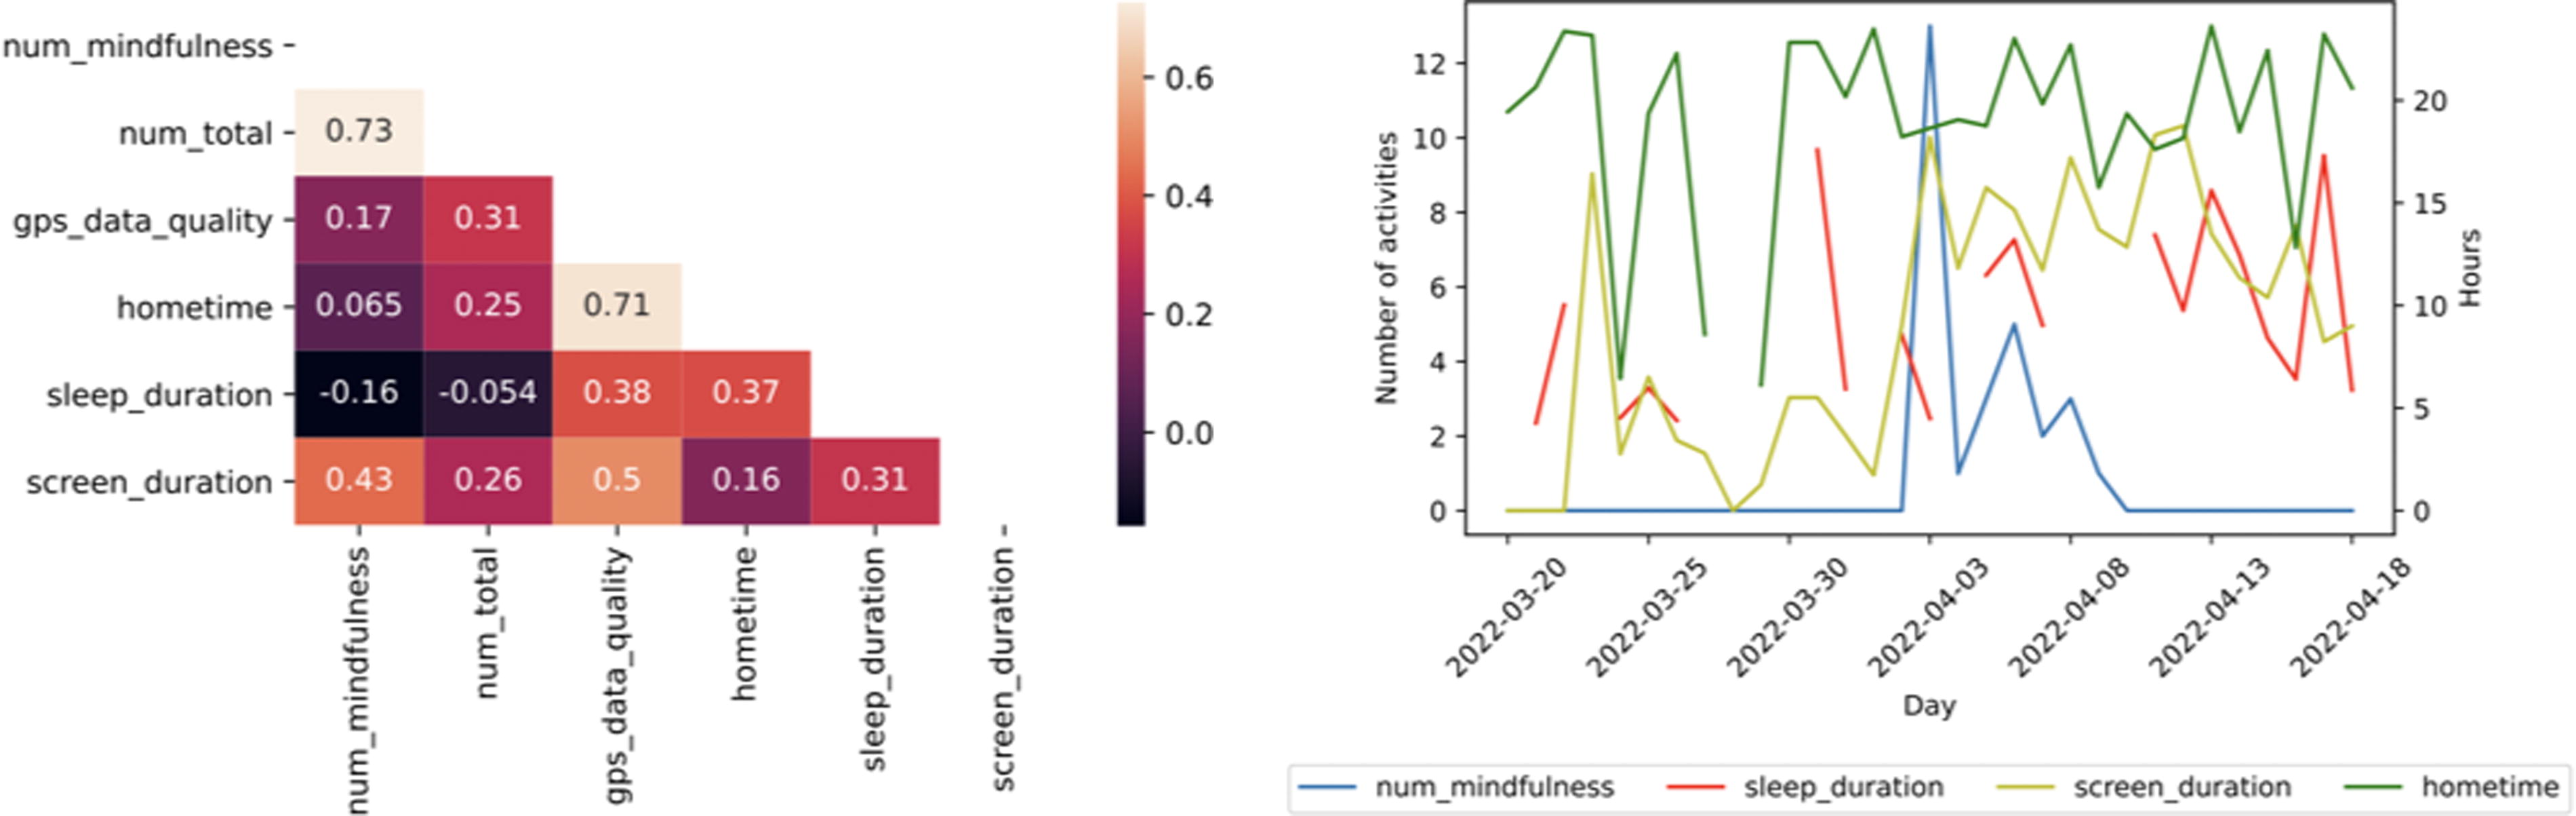
Case Study 2. Correlation heatmap (left) and line graph (right) for participant 2. See Figure 3 caption for more information.
Finally, Case Study 3 (Fig. 5) involves a participant who had more sporadic mindfulness activity completion compared to the prior two case studies. Their passive data feature with the highest correlation with mindfulness activity completion was steps (r = 0.22), while screen duration was near zero (r = 0.0018) despite being the highest correlated passive data feature with total activity completion (r = 0.32).
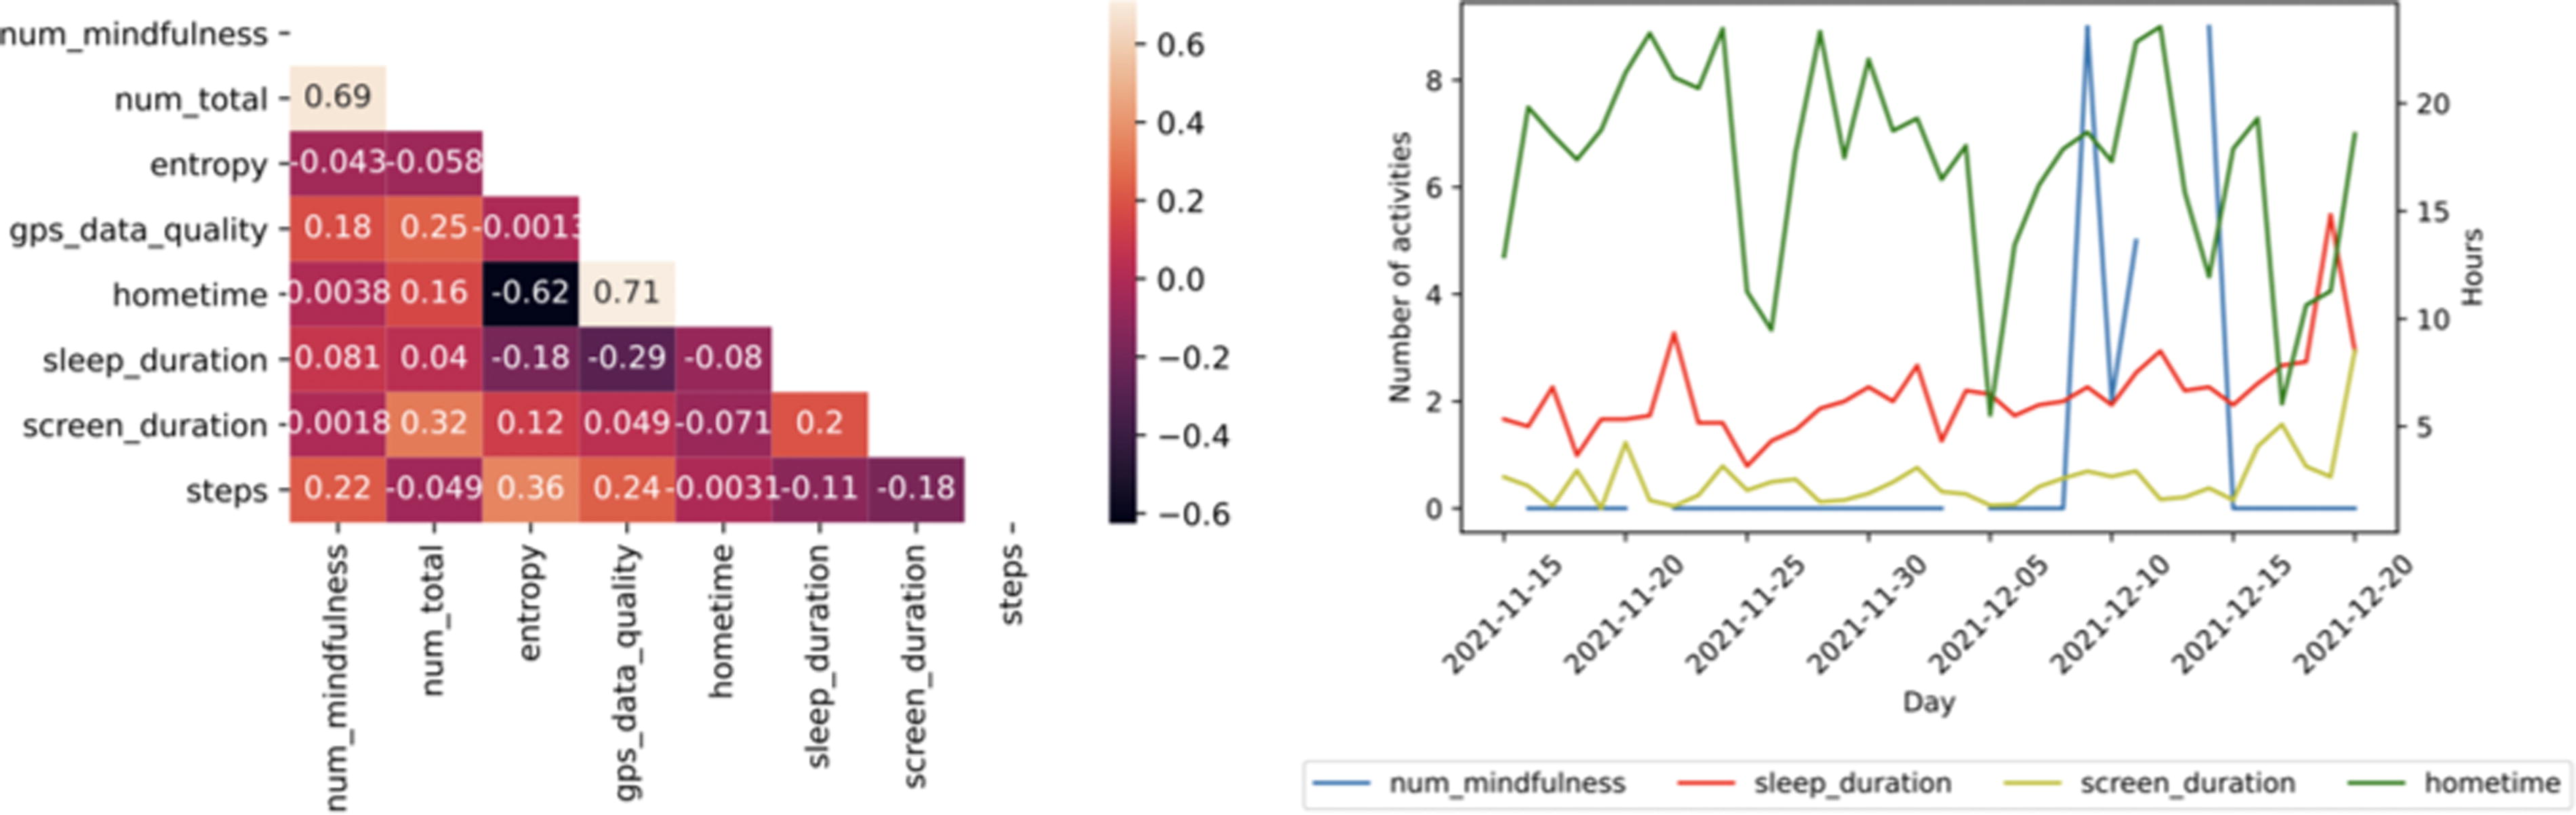
Case Study 3. Correlation heatmap (left) and line graph (right) for participant 3. See Figure 3 caption for more information.
Discussion
In this study of 169 students, our results suggest that smartphone digital phenotyping metrics, specifically sleep duration and screen duration, are positive predictors of both general and mindfulness-based app engagement. Overall, demographic and static variables were not associated with engagement. Case studies demonstrate that there is great variability in the relationships between passive data and engagement for each individual.
Like prior research, we did not find conclusive evidence of simple static predictors of engagement like gender, race, age, or phone type. These results are notable as a 2023 review found that few studies report on subpopulation analysis around mindfulness app engagement. 20 While prior research supports that females are more likely than males to report using mindfulness apps, 21 more investigation into these differences around engagement with larger sample sizes is needed.
Other static variables also informed about patterns of engagement. In the first study iteration, intake PSS scores were found to be a significant predictor of the average number of activities completed. To determine the relationship between PSS score and activity completion, we used the formulae reported in the methods and found that for every one unit increase in PSS score, the average number of total activities completed decreases by ∼2.66%. This finding may be useful in future studies for bolstering engagement, as it identifies PSS score as a factor that could contribute to lower engagement. Previous studies have shown that an app user’s initial emotional state helps determine the type of mindfulness activities that will have the greatest effect on transitioning them from that state. 8 Further research could determine whether tailoring activities to individuals using PSS scores would increase engagement among those participants and investigate whether it can be used as a mediator.
Beyond static variables, our results around digital phenotyping suggests the potential for using sleep and screen time metrics as measures for facilitating engagement. The result that those with more weekly screen time are more likely to engage, regardless of notifications, is important as it may help identify those more likely to use and thus benefit from app-based mindfulness. Historically, notifications have been an ineffective means to drive app engagement research; even tailored notifications suggest they only increased app engagement by 3.9% over 24 h. 22 This is not to say the notifications are not important; rather, in line with other reports, it is important to understand the ideal circumstances in which to send them. 23 These results are in line with a recent 2023 review of mindfulness apps noting that “developers of future mindfulness apps may benefit from incorporating technological innovations that may bolster their effectiveness, such as using passively collected data (GPS location, physiological changes) to deliver tailored interventions or allowing interactions with digital conversational agents that can provide in-the-moment support” 24 The findings around higher engagement associated with longer sleep directions, again regardless of scheduled app activities, suggest another means to tailor mindfulness apps. Given the correlational nature of our analysis, we cannot conclude if this increased engagement may be because mindfulness improves sleep duration 25 or if those with longer sleep duration are more amenable to engage.
However, both static and digital phenotyping predictors must be understood in the context of each unique individual. From conducting the clinical analysis of the case studies, we can see that the associations between passive data streams and engagement in the form of mindfulness activity completion varies widely on a personal level. For example, Case Study 1 showed that home time was strongly correlated with mindfulness activity completion, while Case Study 2 showed very little correlation between the two variables. Hence, while some trends between passive data and engagement may be generalizable to the wider population, employing effective methods to increase app engagement will likely entail personalized techniques tailored to each user based on their weekly digital patterns and associations.
Limitations
As mentioned previously, limitations of this analysis include small sample sizes for certain population groups and the basic use of clustering methods. This hampers the ability to determine the potential relationship between those demographics and mindfulness engagement and is something that can be improved in future studies by attaining a more representative sample. Multiplicity analysis was not performed given this is a pilot and in line with prior pilots, 26 but should be included in further research. Additionally, because this study focused on college students with the first study iteration having a median age of 20 years old, we can draw limited conclusions about the relationship between age and mindfulness engagement. Study results may not generalize to non-college student populations.
Another limitation of this analysis is the lack of a widespread standard for quantifying meaningful app engagement. 27,28 Although we utilized several engagement metrics, including total activities over the study duration, average activities per day, and the proportion of days participants completed activities per week, all of these metrics focus on activity completion, which is not necessarily an effective or holistic method. Other metrics commonly used, including measuring engagement by clicks or the amount of time spent on an app, 29 have similar issues. Until there is a widely accepted standard for what constitutes meaningful engagement, 30 further studies will continue to face this challenge.
Conclusion
Our results confirm that while there are no simple solutions to predicting engagement with apps around mindfulness, utilizing digital phenotyping approaches at a population and personal level offers new potential, specifically concerning screen exposure and sleep duration. The signal from digital phenotyping may be small, but even small increases in engagement around mindfulness apps may have a tremendous impact given their already high prevalence of use, easy availability, and potential to engage diverse patients.
Footnotes
Authors’ Contributions
J.T. and L.G. collected the data. I.B. and L.G. led the analysis with support from J.T. All authors helped draft, revise, and approve the article.
Data Availability Statement
Nonidentifiable data are available on request with an appropriate IRB and data sharing agreement.
Author Disclosure Statement
J.T. has equity in Precision Mental Wellness, which is not featured or mentioned in this article. None of the authors declare any conflicts of interests.
Funding Information
No specific funding was available for this work.