




Abstract
Interleukin-4 (IL-4)-induced Stat6 activities (phenotypes) vary among human cancer cells, of which the HT-29 cell line carries an active Stat6high phenotype, while Caco-2 carries a defective Stat6null phenotype, respectively. Cancer cells with Stat6high show resistance to apoptosis and exaggerated metastasis, suggesting the clinical significance of Stat6 phenotypes. We previously showed that Stat6high HT-29 cells exhibited low constitutive expression of Stat6-negative regulators SOCS-1 and SHP-1 because of gene hypermethylation. This study further examined the constitutive expression of other closely related SOCS family numbers including SOCS-3, SOCS-5, SOCS-7, and CISH using RT-PCR. Similar to SOCS-1 and SHP-1, Stat6high HT-29 cells expressed low constitutive mRNA of SOCS-3, SOCS-7, and CISH than Stat6null Caco-2 cells. Interestingly, DNA demethylation using 5-aza-2′-deoxycytidine in HT-29 cells up-regulated mRNA expression of the above genes, indicating a hypermethylation status, which was confirmed by methylation-specific sequencing in selected SOCS-3 gene. Furthermore, defective Stat6null Caco-2 exhibited impaired phosphorylation of Stat6 after IL-4 stimulation by flow cytometry, in keeping with the notion of an over-performed negative regulation. The findings that IL-4/Stat6 phenotypes show differential expression of multiple negative regulators suggest a model that a collective force of powerful negative regulators, directly and indirectly, acts on Stat6 activation, which may result in differential Stat6 phenotypes.
Introduction
T
Stat6 signaling plays an important role in biology in a variety of cell types, including cancer cells and immune cells (Ansel and others 2006; Bruns and Kaplan 2006). Mice lacking Stat6 manifest enhanced tumor immunity to both primary and metastatic mammary carcinomas (Ostrand-Rosenberg and others 2000; Ostrand-Rosenberg and others 2004), and induce spontaneous rejection of implanted tumors (Kacha and others 2000). In humans, constitutive activation of Stat6 has been frequently observed in a number of malignancies (Bruns and Kaplan 2006). Collectively, these observations strongly suggest a role of Stat6 in the front line of carcinogenesis. Based on the evidence available, it may be hypothesized that a functionally active Stat6 signaling is beneficial to cancer cells at different but related stages including carcinogenesis, tumor growth, and metastasis, possibly by mechanisms including promoting an exaggerated Th2 environment, gaining resistance to apoptosis, and escaping the host immunosurveillance (Nelms and others 1999; Levings and Schrader 1999; Ostrand-Rosenberg and others 2004; Zhang and others 2004; Bruns and Kaplan 2006; Zhang and others 2006; Li and others 2008; Zhang and others 2008).
Using a semiquantitative EMSA assay, we have previously defined three naturally occurring IL-4-induced Stat6 activational phenotypes, termed as Stat6high, Stat6low, and Stat6null (Zhang and others 2003). Importantly, cells carrying different Stat6 phenotypes show differences in functions. For examples, Stat6null is a defective Stat6 phenotype that is shown to have decreased cell surface expression of CD23 (Zhang and others 2003), heightened expression of proinflammatory cytokines (Zhang and others 2004), and increased susceptibility to apoptosis (Galka and others 2004; Zhang and others 2006), in keeping with the observations in Stat6 knockout mice as mentioned earlier. Furthermore, the fact that cells carrying Stat6null phenotype prone to apoptosis also appears to be true in breast and colon cancer cells (Li and others 2008; Zhang and others 2008), as well as cells whose Stat6 is knocked down (defective Stat6 signaling) using RNAi technology (Zhang and others 2006).
Attempts to understand molecular mechanisms that may have generated these Stat6 phenotypes have failed to correlate them with constitutive Stat6 levels (Zhang and others 2003; Yuan and others 2009) and polymorphisms of the IL-4RA gene (Zhang and others 2003). In addition, no differences have been observed in constitutive expression of Jak1 and Jak3 kinases among different Stat6 phenotypes (our unpublished observations). These negative findings have let us to hypothesize that the mechanism(s) responsible for differential Stat6 phenotypes may lie in the pathway’s regulation system, especially the negative regulators, as they are potent in regulating the activation of Stat6 (Nelms and others 1999). Indeed, in Stat6null Caco-2 colon cancer cells, we have recently detected much increased constitutive expression of Stat6-negative regulators SOCS-1 and SHP-1 (Yuan and others 2008), which are soon found to be correlated with DNA hypomethylation in their promoters (Xu and others 2009). However, the increased expression of SOCS-1 and SHP-1 may partially explain the formation of the defective Stat6null phenotype in the colon cancer cells (Yuan and others 2009; Xu and others 2009) and therefore, we have extended our investigation to include other negative regulators of the Stat-signaling pathways.
Using two well-studied colon cancer cell lines as a model, this study has focused on the constitutive expression of several related SOCS genes, that is, SOCS-3, SOCS-5, SOCS-7, and CISH, in relation to Stat6 phenotypes and found that (1) Caco-2 cells with Stat6null phenotype show impaired phosphorylation of Stat6 upon IL-4 activation; (2) defective Stat6null phenotype is correlated with heightened constitutive expression of three negative regulator genes SOCS-3, SOCS-7, and CISH; and (3) differential constitutive expression of the above genes may be due to differences in DNA methylation in the promoters of these genes. These observations favor the hypothesis that, together with SOCS-1 and SHP-1, a group of related negative regulators of Stat pathways may form a collective force of negative regulation on Stat6 activation, directly and indirectly involved in the formation of different Stat6 activities or phenotypes. These findings may have important implications in relation to constitutively activated Stat6 in human cancers.
Materials and Methods
Cell lines
Human colon cancer cell lines HT-29 and Caco-2 were obtained from American Type Culture Collection (ATCC). Cells were cultured in RPMI 1640 medium supplemented with 1% calf serum, 2.05 mM
Flow cytometric analyses of Stat6 and phospho-Stat6
Cells were seeded in a six-well plate at a density of 5 · 105 cells/well and remained in spontaneous culture media at 37°C with 5% CO2 until test. On the day prior to harvest, cells were either untreated (IL-4(−)) or treated (IL-4(+)) with recombinant human (rh)IL-4 (BD Pharmingen™, USA) at a final concentration of 10 ng/mL for 30 min at culture conditions when cells growing to 80% to 90% confluence. The cells were then detached using 1× trypsin solution and, intracellular Stat6 and phospho-Stat6 (pStat6) were detected using flow cytometry with reagents obtained from BD Pharmingen™ (USA) according to the manufacturer’s instructions. Briefly, 1 × 10⁶ cells were washed twice with 2 mL Stain Buffer and fixed by adding 100 µL of Cytofix™ buffer and quickly resuspended by pipetting. Cells were incubated in fixative at 37°C for 10 min and pelleted by centrifugation (300g) for 10 min. Cells were permeabilized by resuspending with vigorous vortexing in PhosFlow Perm Buffer III prechilled to −20°C and incubated for 30 min on ice. Permeabilized cells were washed twice in Stain Buffer and resuspended at 0.5–1 × 10⁶ cells/100 µL. Finally, 20 µL of PE-Stat6 antibody (BD Pharmingen™, clone: 23) or PE-pStat6 antibody (BD Pharmingen™, clone: 18) were added to each tube and incubated at room temperature for 30 min in the dark. The antibody-stained cells were washed once with 2 mL of Stain Buffer and resuspended in the same buffer (500 µL) prior to flow cytometric analyses using Cytomics™ FC500 flow cytometer (Beckman-Coulter, USA). All tests were repeated three times independently and the results were expressed as median fluorescence intensity (MFI). To normalize the data, fold change was calculated by dividing the MFI of the stimulated cells (MFIstim) by that of the same but unstimulated cells (MFIunstim) and the results were expressed as a ratio of MFIstim/MFIunstim (Krutzik and Nolan 2003).
RNA isolation and semiquantitative RT-PCR
Cells were cultured in standard culture flask at a concentration of 1 × 10⁶ cells/flask and allowed for 4 days of spontaneous growth. Total RNA was isolated using TRIzol reagent (Fermentas Co., USA) according to the manufacturer’s instructions. The quantity of isolated RNA was determined by an ultraviolet spectrophotometer at 260/280 nm. First-strand cDNA synthesis was accomplished with an Oligo-(dT)18 primer (0.5 µg/µL) used with RevertAidTM First Strand cDNA Synthesis Kit (Toyobo, Tokyo, Japan). Glyceraldehyde-3-phosphate dehydrogenase (GAPDH) gene was used as a control in all tests. Primer sequences and PCR conditions used in RT-PCR were listed in Table 1. PCR was performed in a final volume of 50 µL containing 3 µg cDNA, 10 pmol/µL of each oligonucleotide primer, 10× Taq buffer with KCl, 25 mmol/L magnesium chloride, 0.2 mmol/L of each dNTP, DEPC-treated water, and 1.25 U Taq DNA polymerase (MBI Fermentas, USA) in pre-aliquoted tubes. Following PCR, 10 µL of each amplified product was electrophoresed on a 2% agarose gel with ethidium bromide (EB). For semiquantitative analysis, RT-PCR gel images were scanned using a gel imaging scanning system (GeneGenius from Syngene, England). The obtained area readings of target genes were compared with those of human GAPDH gene and the results were expressed as a ratio of target gene versus GAPDH. Individual RT-PCR tests were repeated on at least three independent occasions.
RT-PCR P
aF, forward primer; R, reverse primer.
bAnnealing temperature in °C (number of cycles).
cM-MSP, primers for methylated sequence.
dU-MSP, primers for unmethylated sequence.
DNA demethylation using 5-aza-2′-deoxycytidine
Demethylation agent 5-aza-2′-deoxycytidine (5-Aza-CdR) was purchased from Sigma Co. (IL, USA) and used to treat HT-29 cells at a concentration of 10 µmol/L in spontaneous culture at 37°C for 4 days. Cells were then harvested on the fourth day and tested for mRNA expression by RT-PCR as described earlier.
DNA isolation and sodium bisulfite conversion
Genomic DNA was isolated from 5 × 10⁶ cells with DNeasy Tissue Kit (Qiagen, Germany) following the manufacturer’s instructions. Genomic DNA (1.1 µg) was modified with sodium bisulfate using the EZ DNA Modification-GoldTM Kit (Zymo Research Biotech Co., CA, USA). For accuracy, equal amount of DNA from different samples was adjusted. Untreated DNA from normal human placenta tissues was used as control for unmethylated alleles, while DNA treated in vitro with Sss1 methyltransferase (New England Biolabs, Inc., MA, USA) was used as positive control for methylated alleles.
Methylation-specific polymerase chain reaction
Methylation-specific polymerase chain reaction (MSP) for promoter methylation was performed as described previously (Weber and others 2005) and modified DNA was subjected to two separate PCRs. MSP primers were designed to amplify methylated (M-MSP) and unmethylated (U-MSP) alleles of SOCS-3 (Weber and others 2005). Methylation-specific primer sequences and PCR conditions were listed in Table 1. Individual MSP tests were repeated on three independent occasions.
DNA sequencing
To confirm CpG methylation, MSP products of selected SOCS-3 gene were purified, sequenced bidirectionally, and analyzed by an automated DNA sequence analyzer (Applied Biosystems, CA, USA). Methylated sequences were confirmed by reference to wild-type sequence of SOCS-3.
Statistical analysis
Statistical analysis was performed using independent samples t-test (SPSS statistical software package Version 15.0) and significance was defined as a P < 0.05 for all analyses and data were presented as mean ± standard deviation (SD).
Results
Inactive Stat6null Caco-2 cells exhibited lower phospho-Stat6 than active Stat6high HT-29 cells upon IL-4 stimulation
Using electrophoretic mobility shift assay (EMSA), we previously demonstrated Caco-2 and HT-29 colon cancer cell lines to carry inactive Stat6null and active Stat6high phenotypes, respectively, after IL-4 stimulation (Li and others 2008). Western blot analysis indicated that these differential Stat6 phenotypes were not due to constitutively expressed Stat6 protein but varying levels of activated pStat6 (Zhang and others 2003; Yuan and others 2009). Here, we further confirmed the above observations using sensitive flow cytometric analyses. As shown in Figure 1 and Table 2, constitutive Stat6 protein remained similar before and after IL-4 stimulation in both HT-29 and Caco-2 cell lines (Fig. 1A and 1C). Before IL-4 stimulation, small amounts of pStat6 were detected for both HT-29 (MFI = 0.40 ± 0.05) and Caco-2 (MFI = 0.35 ± 0.07), suggesting a base level of constitutive pStat6 (Fig. 1B and 1D). However, IL-4 stimulation gave rise to a dramatic increase of pStat6 in HT-29 cells (Fig. 1B, fold change = 5.28), but to a lesser increase in Caco-2 cells (Fig. 1D, fold change = 3.09). Comparisons between HT-29 and Caco-2 cells showed lower pStat6 after IL-4 in Caco-2 cells than in HT-29 cells (P < 0.05, Table 2), in keeping with our previous observations by Western blotting (Yuan and others 2009).
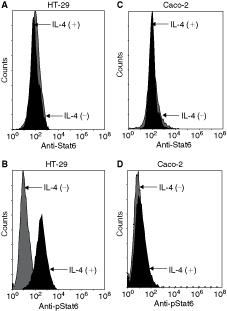
Flow cytometric analyses indicate differences in phosphorylation of Stat6 corresponding to differential Stat6 phenotypes. HT-29 and Caco-2 cells were either unstimulated (gray histogram, interleukin [IL]-4(−)) or stimulated (black histogram, IL-4(+)) with rhIL-4 at 10 ng/mL for 30 min at 37°C. Cells were stained with antibodies to PE-Stat6 or PE-pStat6 (residue Y641) before flow cytometric analyses. (
Stat6null Caco-2 C
aMedian fluorescence intensity (MFI) fold change is defined as MFIstim/MFIunstim (see Materials and Methods section). Data are pooled from three independent flow cytometry tests for each cell line. bIndicates comparison between HT-29 and Caco-2 for constitutive Stat6 (P = 0.671) and cdepicts comparison between HT-29 and Caco-2 for phosphorylated Stat6 (pStat6, P = 0.03).
Defective Stat6null Caco-2 cells expressed more constitutive mRNA of negative regulator genes SOCS-3, SOCS-7, and CISH than active Stat6high HT-29 cells
In order to understand the underlying mechanism(s) that may be responsible for differential Stat6 phenotypes, we previously showed that Stat6null Caco-2 cells constitutively expressed higher levels of Stat6-negative regulators SOCS-1 and SHP-1 (Yuan and others 2009) whose gene promoters were then found to be hypomethylated, allowing overexpression of these genes (Xu and others 2009). As differentially expressed SOCS-1 and SHP-1 could explain only part of the defect in Stat6null phenotype (Yuan and others 2009), we extended our investigation to other negative regulators of Stat-signaling pathways, which should add additional information in the formation of differential Stat6 phenotypes.
This study tested four negative regulatory genes SOCS-3, SOCS-5, SOCS-7, and CISH (Fig. 2). Indeed as shown in Figure 2, we observed that, except SOCS-5 gene, defective Stat6null Caco-2 cells constitutively expressed higher mRNA levels of SOCS-3, SOCS-7, and CISH genes than active Stat6high HT-29 cells, showing expression patterns similar to those of SOCS-1 and SHP-1 in Caco-2 cells (Yuan and others 2009). These observations suggested a possibility that differentially expressed negative regulator genes may be hypermethylated in Stat6high HT-29 cells and, hypomethylated in Stat6null Caco-2 cells, similar to the situation of SOCS-1 and SHP-1 in the same cell lines as shown by us (Xu and others 2009). Accordingly, we immediately examined whether demethylation could alter the expression patterns of the above genes.
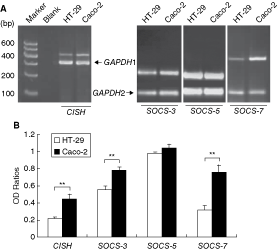
Defective Stat6null Caco-2 cells express increased levels of constitutive mRNA of CISH, SOCS-3, and SOCS-7 than active Stat6high HT-29 cells. (
DNA demethylation using 5-Aza-CdR recovers mRNA expression of SOCS-3, SOCS-7, and CISH in HT-29 cells
Because Stat6high HT-29 cells showed decreased mRNA expression of SOCS-3, SOCS-7, and CISH in comparison with Stat6null Caco-2 cells, we hypothesized a hypermethylation status in the HT-29 cells, which would down-regulate the expression of the genes tested. DNA methylation is reversible and demethylation using reagent 5-Aza-CdR should up-regulate those genes methylated (Esteller and others 2001; Bae and others 2002). As shown in Figure 3, treatment of HT-29 cells with demethylation reagent 5-Aza-CdR for 4 days indeed up-regulated SOCS-3, SOCS-7, and CISH, the three genes that were underexpressed in HT-29 cells compared with Caco-2 cells in spontaneous culture (Fig. 2). The up-regulation of otherwise underexpressed genes indicated a hypermethylation status in their gene promoters. To obtain direct evidence for gene methylation, we selected SOCS-3 gene to examine its specific DNA methylation.
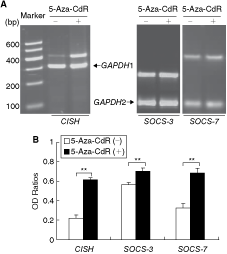
DNA demethylation up-regulates mRNA expression in HT-29 cells, which express less constitutive mRNA of CISH, SOCS-3, and SOCS-7 than Caco-2 cells (Fig. 2). Cells were untreated (−) or treated with 10 µM of 5-Aza-CdR (+) for 4 days in spontaneous culture and mRNA extraction and RT-PCR analyses were performed as described in Figure 2. (
Underexpressed SOCS-3 gene shows promoter DNA hypermethylation in HT-29 cells
MSP is a PCR-based assay for detecting methylation status in CpG islands (Herman and others 1996). Using this assay, we detected a higher degree of DNA methylation in the SOCS-3 promoter in HT-29 cells than in Caco-2 cells (Fig. 4A and 4B). This DNA methylation in SOCS-3 was further confirmed by DNA sequencing (Fig. 4C). It should be noted that the methylation status of SOCS-3 gene promoter was negatively correlated with its gene expression profiles (see Fig. 2 vs. Fig. 4), in keeping with the rationale of gene methylation (Herman and others 1996; Esteller and others 2001; Bae and others 2002).

Defective Stat6null Caco-2 cells exhibit lower DNA methylation in the promoter of SOCS-3 than that in active Stat6high HT-29 cells. (
Discussion
Evidence in mice and humans has indicated that functional activities of Stat6 may play an important role in carcinogenesis, cancer growth, and perhaps cancer prognosis (Kacha and others 2000; Ostrand-Rosenberg and others 2000; Ostrand-Rosenberg and others 2004; Bruns and Kaplan 2006; Zhang and others 2006; Li and others 2008; Zhang and others 2008). Clinical observations that Stat6 can be constitutively activated in many human cancers (Bruns and Kaplan 2006) strongly suggest that activated Stat6 is a biomarker, and measuring Stat6 activity may serve as a potential parameter to be incorporated into clinical references for possible prediction of treatment response and prognosis of cancer. Therefore, it would be interesting to develop a practical assay capable of visualizing individual cancer patients’ Stat6 activities.
Using human EBV-B cell lines and a radiation-based EMSA assay, we have previously shown the possibility to phenotype IL-4-induced Stat6 activities, termed as Stat6 activational phenotypes (Zhang and others 2003). Accordingly, we have further demonstrated that human breast cancer and colon cancer cell lines are also feasibly phenotyped for their Stat6 activities using the EMSA assay (Li and others 2008; Zhang and others 2008). In this study, we have utilized a non-radiation-based flow cytometry assay and confirmed EMSA-defined Stat6 phenotypes at pStat6 level (Fig. 1 and Table 2). The results presented here have at least two implications: (1) IL-4/Stat6 phenotypes are the products of varying capabilities of Stat6 phosphorylation and Stat6null phenotype represents a defective Stat6 signaling with limited functions as proposed previously (Li and others 2008; Zhang and others 2008); (2) the flow cytometry assay is non-radiation-based and specifically detects activated pStat6, which should be ideal for large-scale studies to develop a clinically feasible Stat6 phenotyping assay.
Stat6 phenotype or activity is a function in terms of cell surface marker molecules, cytokine profiles, resistance to apoptosis, and cancer invasiveness (Zhang and others 2003; Galka and others 2004; Zhang and others 2004; Li and others 2008; Yuan and others 2009; Zhang and others 2008). As mentioned earlier, Stat6 activational phenotypes may serve as a biomarker with potential clinical applications since constitutively active Stat6 appears to be involved in carcinogenesis (Bruns and Kaplan 2006). It is, therefore, important to understand the underlying mechanism(s) that may have generated these naturally occurring IL-4/Stat6 activational phenotypes. In this regard, we have previously investigated several possibilities including polymorphisms of STAT6 and IL-4RA genes (Zhang and others 2003), constitutive expression of Stat6 (Zhang and others 2003; Yuan and others 2009), Jak1 and Jak3 (our unpublished observations), but all have failed to correlate with Stat6 phenotypes. These negative findings have led us to propose alternative hypotheses. Because of impaired Stat6 phosphorylation in Stat6null cells (Fig. 1), we have proposed that abnormal regulation of Stat6 signaling may be one mechanism worth investigating (Yuan and others 2009). Indeed, it has been shown that Stat6null cells exhibit increased constitutive expression of negative regulators SOCS-1 and SHP-1, and of positive regulator PP2A of the Stat6 pathway (Yuan and others 2009), of which SOCS-1 and SHP-1 are later found to be hypomethylated in Stat6null cells, possibly allowing for the overexpression of SOCS-1 and SHP-1 (Xu and others 2009). These observations, however, may only explain part of the phenotype differences (Yuan and others 2009) and, therefore, it would certainly add additional information by investigating other closely related negative regulators of the SOCS family as many have superimposed or “cross-talk” functions (Croker and others 2008; Piessevaux and others 2008).
As shown in Figure 2, Stat6null-carrying Caco-2 cells, compared with Stat6high-carrying HT-29 cells, expressed higher constitutive mRNA levels of SOCS-3, SOCS-7, and CISH. Because SOCS-3, SOCS-7, and CISH are all negative regulators of Stat-signaling pathways (Croker and others 2008; Piessevaux and others 2008), their differences in constitutive expression are particularly interesting between cancer cells with different IL-4/Stat6 activities (Li and others 2008; Fig. 1). These negative regulators are homologous proteins with very similar structures including a central SH2 (Src homology 2) domain, a conserved C-terminal domain called SOCS box, and a variable N-terminal tail (Piessevaux and others 2008).
SOCS proteins are involved in the negative regulation of >30 cytokine-induced signaling pathways and superimposed functionality, known as “cross talk,” is a frequent phenomenon amongst these regulators (Croker and others 2008). For example, both SOCS-1 and SOCS-3 can bind to the phosphorylated activation loop of Jak2, but SOCS-3 shows weak binding capability (Nicholson and others 2000; Giordanetto and Kroemer 2003). Although SOCS-3 is primarily involved in the negative regulation of Stat3 pathway (Ozawa and others 2007), at least one study has shown that SOCS-3 can also inhibit the activity of IL-4/Stat6 pathway (Haque and others 2000). Another gene CISH, the first CIS/SOCS gene identified, has been shown to be a negative feedback regulator of Stat5 pathway (Matsumoto and others 1997; Matsumoto and others 1999). However, our recent study has shown that CISH, just like SOCS-1, appears to be inducible by IL-4/Stat6 signaling (Zhang and others 2008), strongly suggesting a possibility of CISH being a feedback negative regulator of the IL-4/Stat6 pathway. These observations, together with our findings in this study, suggest that increased constitutive expression of SOCS-3 and CISH may add additional strength besides SOCS-1 and SHP-1 (Yuan and others 2009) to collectively suppress the IL-4-induced Stat6 activity seen in Caco-2 cells (Li and others 2008; Fig. 1). Although it is not clear why SOCS-7 shows differential expression between Stat6 phenotypes, the phenomenon may be provoking in search for its possible involvement of Stat6 activity in addition to its primary role in the negative regulation of Stat3 and Stat5 activities (Martens and others 2005). It should be cautious, however, not to over-interpret current observations that differentially expressed SOCS-3, CISH, and SOCS-7 may be causal to Stat6 activities or phenotypes seen in different cancer cells. Therefore, it may not be ruled out that, as a result of complex carcinogenesis, several SOCS family members are up- or down-regulated nonspecifically in certain cancer cells to influence Stat pathways including Stat6 because of such a “cross talk” as mentioned earlier.
Because differential expression of SOCS-1 and SHP-1 in Stat6-phenotyped colon cancer cell lines (Yuan and others 2009) has been demonstrated to be due to differential DNA methylation in gene promoters (Xu and others 2009), we have immediately examined methylation status for SOCS-3, SOCS-7, and CISH. Indeed, as shown in Figure 3, demethylation using 5-Aza-CdR significantly up-regulates the expression of all three genes SOCS-3, SOCS-7, and CISH in HT-29 cells, which express down-regulated levels of the above regulator genes (Fig. 2). To ascertain the observation, we have selected SOCS-3 gene for specific DNA methylation test and demonstrated that the promoter DNA of SOCS-3 is highly methylated in Stat6high HT-29 cells in comparison with Stat6null Caco-2 cells (Fig. 4), very similar to that of SOCS-1 and SHP-1 (Xu and others 2009). DNA methylation, as a reversible mechanism of gene silencing, is utilized by cancerous cells and plays an important role in cancer development and progression (Herman and Baylin 2003; Baylin 2005). Given that an active Stat6 signaling may be beneficial to cancer cells (Ostrand-Rosenberg and others 2004; Bruns and Kaplan 2006; Li and others 2008), our findings in this and previous studies (Xu and others 2009) suggest a real possibility that DNA hypermethylation in multiple regulatory genes in Stat6high active cancer cells, such as HT-29, is likely a mechanism that may successfully suppress the otherwise powerful negative regulation on Stat6 signaling upon activation. In this context, the defective Stat6null phenotype, whose carrier cells express larger quantity of negative regulators (Yuan and others 2009; Fig. 2), may represent a protective function of biosurveillance detrimental to cancerous cells (Li and others 2008; Yuan and others 2009; Zhang and others 2008). On the other hand, the current observations imply the importance in underlying mechanism(s) responsible for differential DNA methylation in HT-29 versus Caco-2 colon cancer cells, which are currently under investigation.
In conclusion, we have first demonstrated that EMSA-defined defective IL-4/Stat6null phenotype is resulted from impaired phosphorylation of Stat6 by flow cytometry, offering a practical feasibility for clinical phenotyping of Stat6 activities. In addition to SOCS-1 and SHP-1, this study has shown for the first time a strong correlation of differential constitutive expression of several negative regulator genes, including SOCS-3, SOCS-7, and CISH, with IL-4/Stat6 phenotypes. The findings that IL-4/Stat6 phenotypes correlate with differential constitutive expression of multiple negative regulators suggest a model that a collective force of powerful negative regulators, directly and indirectly, acts on IL-4-induced Stat6 activation, which may sufficiently result in the formation of different Stat6 phenotypes. Furthermore, differentially expressed SOCS-3, SOCS-7, and CISH in the cancer cells studied may be due to variations in DNA methylation, whose potential importance in the constitutive activation of Stat6 in many human cancers may be implicated.
Footnotes
Acknowledgments
This work was supported by a grant awarded to W.J.Z. from the National Natural Science Foundation of China (NSFC No. 30871289). We thank S.Q. Liu and S.P. Liu for excellent technical assistance in cell culture and flow cytometry analyses.
Author Disclosure Statement
No competing financial interests exist.