




Abstract
Interferon-α (IFN-α) has extremely broad effects on the immune system, and the influence of IFN-α on regulatory T (Treg) cells is not fully known. In this report, Treg cells were analyzed in patients with metastatic renal cell carcinoma (RCC) following IFN-α monotherapy or treatment with IFN-α and interleukin (IL)-2. CD4+ and FoxP3+ Treg cells were significantly decreased for 2 weeks after the initiation of IFN-α monotherapy, but recovered later as treatment proceeded. Patients treated with both IFN-α and IL-2 increased their Treg cell levels during the first 2 weeks after initiation of treatment. Patients who derived complete response (CR), partial response (PR), or stable disease (SD) from IFN-α monotherapy had lower Treg cell levels before treatment than did patients whose disease progressed. Low Treg cell levels before treatment may therefore be advantageous to subsequent immunotherapy with IFN-α, and predictive for treatment results in RCC patients.
Introduction
T
Interleukin (IL)-2 is also considered to be central to T-cell-dependent immune responses in regulating T-cell proliferation and function (Atkins 2002). The IL-2/IL-2 receptor interaction stimulates the growth, differentiation, and survival of antigen-specific cytotoxic T cells (Beadling and Smith 2002). Recent studies have suggested the importance of IL-2 in peripheral T-cell tolerance, and the primary role of IL-2 in the generation and maintenance of regulatory T cells (Malek and Bayer 2004; Setoguchi and others 2005).
Regulatory T (Treg) cells act by suppressing the activation and function of other T cells (Shevach 2001). Treg cells prevent other T cells from recognizing and reacting against self-antigens, which could induce autoimmune disorders. However, because tumor antigens are largely self-antigens, Treg cells also prevent the tumor-bearing host from mounting an effective antitumor immune response. The importance of Treg cells in controlling tumor growth is further highlighted by the demonstration that depletion of Treg cells using anti-CD25 antibodies can induce effective antitumor immunity (Onizuka and others 1999; Shimizu and others 1999). Although IFN-α is a standard immunotherapy for metastatic RCC, its influences on Treg cells in RCC patients receiving IFN-α and/or IL-2 treatment have not been fully characterized. In this report, the influence of IFN-α and IL-2 on Treg cells, and the correlation of Treg cells with the resulting clinical response were analyzed in the RCC patients.
Materials and Methods
Patients
All patients with the primary tumor in place at diagnosis underwent nephrectomy. Patients with histologically confirmed RCC and measurable metastatic disease were included. All patients are high Karnofsky performance status (>90%) and favorable group according to MSKCC risk factors. Patients were enrolled after giving their informed consent. The exclusion criteria were exposure to other immunotherapies or immunosuppressive treatments, evidence of other active malignant neoplasms, history of autoimmune disease, presence of acute or chronic infections, and participation in other clinical trials. Before the first administration of IFN-α and/or IL-2, an evaluation that included clinical history, physical examination, hematological and biochemical parameters, computed tomography (CT) scan, and scintigraphy was performed.
Flow cytometry analysis
Flow cytometry analyses were performed using the following antibodies: anti-CD4-APC, anti-CD25-FITC, anti CD152 (CTLA-4)-Cy5 (BD PharMingen, San Diego, USA), and anti-FoxP3-PE (eBioscience, San Diego, USA). Peripheral whole blood cells were stained for the expression of CD4 and CD25 and then fixed and permeabilized, using a staining kit (eBioscience) according to the manufacturer’s instructions for FoxP3-staining protocol. FoxP3 and CTLA-4 staining was performed on cells that had been fixed and permeabilized. Fluorescent-activated cell sorting (FACS) data were collected using a FACSCanto machine (BD Biosciences); the data were analyzed using the FlowJo software program (Tree Star).
Patient treatment and evaluation of clinical status
Patients received 6 × 10⁶ units of IFN-α, subcutaneously administrated, three times a week. Patients receiving both IL-2 and IFN-α were given the same regimen of IFN-α along with 7 × 10⁵ units of IL-2, intravenously administrated, five times a week. Disease progression was evaluated by CT scans before the initiation of treatment and every 3 months thereafter. The Response Evaluation Criteria in Solid Tumors (RECIST) was used to evaluate clinical responses. The statistical significance of the number of Treg cells between patients with CR/PR or SD and those with PD was determined by Mann–Whitney U-test.
Results
Patients and immune status
Between June 2006 and September 2007, 18 patients with metastatic RCC (14 men, 4 women; average age: 68.7 years; range: 60–77 years) were enrolled in this study. Five patients had metastatic disease at the time of their nephrectomies. Twelve patients with no prior systemic therapy received with IFN-α monotherapy. Six patients received IFN-α with IL-2 treatment after showing progressive disease (PD) following IFN-α monotherapy for 3- to 12-month periods. All patients could continuously receive the immunotherapy until the first evaluation. In patients receiving IFN-α monotherapy, one patient showed a complete response, five patients showed SD, and six patients showed PD for 6 months after initiation of treatment. Among the six patients treated with both IFN-α and IL-2, one patient showed a PR, and five patients showed PD for 6 months after initiation of treatment.
To assess the influence of IFN-α and/or IL-2 administration on white blood cells (WBCs) including lymphocytes and monocytes, peripheral blood cells (PBCs) were counted before and after treatment. As shown in Figure 1A and 1B, administration of IFN-α significantly decreased the number of WBCs (P < 0.002) and lymphocytes (P < 0.03) for 2 weeks after the initiation of IFN-α treatment. Although WBCs were maintained at low levels for 2 months, the number of lymphocytes continuously decreased for 2 months (P < 0.05) (Fig. 1B). However, no change in monocyte levels was observed in response to IFN-α monotherapy (Fig. 1C). Lymphocyte levels were not significantly changed during treatment in patients given IL-2 with IFN-α therapy (data not shown).
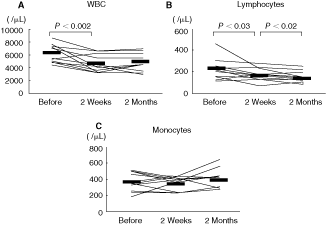
Numerical changes in white blood cells (WBCs), lymphocytes, and monocytes per microliter of blood during the interferon-α (IFN-α) treatment. (
To analyze the forward scatter/side scatter (FSC/SSC) distribution of Treg cells in flow cytometry analysis, PBCs were analyzed by gating CD4 expression. CD4+ cells showed two frequency classes: Treg cells were found as CD4+, CD25+, FoxP3+, CTLA-4+ cells in low FSC classes (Fig. 2). CD4+, CD25−, FoxP3− cells were found in high FSC classes. These may have been CD4+ T cells other than Tregs, such as monocytes or macrophages, which express CD4 on their surfaces.
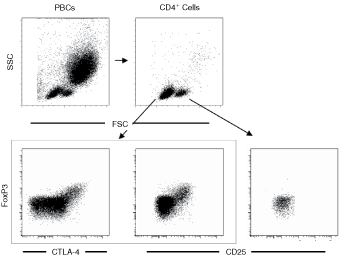
Two frequency classes were observed in flow cytometry analyses of CD4+ cells. There are high and low FSC classes in CD4+ cells (upper right). Among the low FSC Treg cells were found CD4+, CD25+, FoxP3+, CTLA-4+ cells (lower left and center). Abbreviations: PBCs, peripheral blood cells; FSC, forward-scattered cells; SSC, side-scattered cells; Treg, T regulatory cells.
As shown in Figure 3A, Treg cell levels significantly decreased 2 weeks after the initiation of IFN-α administration (P < 0.01), but 2 months later they had recovered to the levels observed prior to IFN-α administration. In patients receiving IFN-α with IL-2, the number of Treg cells increased for 2 weeks after the initiation of the treatment (P < 0.01), then decreased as treatment continued (Fig. 3B).
When Treg cell levels before treatment IFN-α monotherapy were compared between patients who had shown CR/PR or SD and those who had shown PD, Treg cell levels in patients with CR/PR or SD were significantly lower than those in patients with PD (P < 0.01) (Fig. 4A and 4B). However, after 2 weeks and 2 months after the initiation of treatment, there was no difference in Treg levels between patients with CR/PR or SD and those with PD (Fig. 4B).

Changes in regulatory T (Treg) cell levels during the interferon-α (IFN-α) and/or interleukin (IL-2) treatment. (

Correlation of regulatory T (Treg) cell with clinical response before interferon-α (IFN-α) treatment. (
Discussion
IFN-α is a member of the type I IFN family. It was the first cytokine ever discovered, the first used in human clinical trials, and the first approved by regulatory authorities for use in humans (Isaacs and Lindenmann 1957; Jonasch and Haluska 2001; Belardelli and others 2002). IFN-α exerts direct and indirect effects on almost every cell type and function in the immune system, and its influence on Treg cells has not yet been fully characterized. Recent reports have revealed increased IFN-α levels and decreased Treg cells levels in autoimmune diseases, such as systemic lupus erythematosus and insulin-dependent diabetes mellitus (Theofilopoulos and others 2005; Valencia and others 2007). IFN-α up-regulates interferon regulatory factor-1, a negative regulator of Treg cells, through direct repression of Foxp3 expression (Lehtonen and others 2003; Fragale and others 2008). Furthermore, IFN-α-conditioned DC diminished the activation of Treg cells and induced stronger activation of a CD4+ T-cell response (Gigante and others 2008). These results suggest a relationship between IFN-α and regulation of Treg cell.
We therefore examined the influence of IFN-α treatment on Treg cells in patients with metastatic RCC. In our cases, the number of Treg cells significantly decreased for 2 weeks after the initiation of IFN-α treatment and thereafter recovered with ongoing treatment. The cause of these changes in Treg cell levels has not been determined, and may be a direct or indirect effect of IFN-α. A previous report has shown the influence of IL-2 on Treg cells in patients with lymphopenia induced by chemotherapy and decreased Treg cell levels following continuous IL-2 treatment (Zhang and others 2005). In our patients, additional IL-2 treatment markedly expanded Treg cell levels for 2 weeks after the initiation of the treatment; Treg cell levels then decreased with ongoing treatment. Because after continuous IFN-α and/or IL-2 administration, Treg cells recovered to the levels taken prior to treatment, the change of Treg cell levels may be influenced by indirect immune responses caused by IFN-α or IL-2. Monocytes including macrophages and DCs can also play diverse roles in the immune system. Our report also suggested that the monocytes from the patient received with immunosuppressive treatments had a poor ability to differentiate into DCs (Tatsugami and others 2004). Steroid treatment inhibits the immune response by modulating DC differentiation, maturation, and function (Piemonti and others 1999). IFN-α has the ability to induce a great variety of immune response and plays an important role in modulating the immunologic functions of DCs (Gigante and others 2008). Although numerical changes in monocytes were not observed in this study, the changes of frequencies in these cells may occur in response to IFN-α therapy.
Treg cells suppress tumor-specific T-cell immunity and correlate with the survival of patients with malignant ovarian carcinoma (Curiel and others 2004). Furthermore, the depletion of Treg cells using anti-CD25 antibodies evoked effective antitumor immunity (Onizuka and others 1999; Shimizu and others 1999). To address this issue, we analyzed the relationship between the clinical course and the numerical change of Treg cells in RCC patients receiving IFN-α treatment. From our results, it seems difficult to explain the antitumor effect of IFN-α with Treg cells alone, because 2 months after the initiation of IFN-α monotherapy in patients who had shown CR/PR or SD, Treg cells increased to above their pretreatment levels. The patients treated with both IFN-α and IL-2 also showed CR/PR or SD in spite of the increase in Treg cells. In those patients who benefited clinically, immune reaction may be enhanced more strongly by immunotherapy, and the control of the response may result in increased Treg cells after treatment.
Considering the low response rate and substantial adverse effects associated with IFN-α therapy, identification of reliable predictive markers for response to IFN-α is essential for establishing optimal treatment strategies. Our group has recently reported a useful genetic marker to predict the response to IFN-α therapy in patients with metastatic RCC (Ito and others 2007). In our study, Treg cell levels tested before IFN-α treatment were significantly lower in patients who showed CR/PR or SD than in patients who showed PD, suggesting that initially low Treg levels may be advantageous for subsequent IFN-α treatment. However, since this research was small pilot study, the further examination in large cases is necessary. Some reports showed that inflammatory cytokines enhance invasion of renal cancer cells (Chuang and others 2008), and that the presence of a systemic inflammatory response such as the elevation of C-reactive protein (CRP) is a prognostic factor in RCC patients (Ramsey and others 2006). In our study, elevated CRP was not associated with clinical outcome, or with the number of Treg cells before treatment (data not shown).
It is difficult to evaluate or predict an immune reaction in vivo, or to predict a clinical effect with immunotherapy, because immunotherapy induces a variety of complicated responses. This process could be simplified by the discovery and development of critical cytokines or immune-regulating cells that could be used as therapies or predictive markers.
Footnotes
Acknowledgments
This work was supported in part by the Japan Society for Promotion of Science, a Grant-in-Aid for Scientific research from the Ministry of Education, Culture, Sports, Science and Technology, Japan (No. 19591855).