




Abstract
Natural killer (NK) cells control Mycobacterium tuberculosis infection mainly through secreted cytokines. Cytokine dysregulation among HIV may cause rapid disease progression. Our objective was to examine whether impaired production of innate cytokines are responsible for cytokine dysregulation during HIV infection. The study included 30 subjects each of normal healthy subjects (NHS), pulmonary tuberculosis patients (TB), HIV-infected individuals (HIV), and HIV–TB co-infected patients (HIV–TB). Intracellular cytokine staining method was used to enumerate the cytokine-positive NK cells. Unlike NHS (100%), only 27% of HIV–TB and 57% of HIV infected patients have detectable plasma interleukin (IL)-15 levels that signify impaired rather than decreased IL-15 production. Basal type 1 cytokine (IL-2, interferon-γ [IFN-γ], and tumor necrosis factor-α [TNF-α])-secreting NK cells (NK1 cytokines) were decreased significantly (P < 0.05) in TB, HIV, and HIV–TB, when compared with NHS. Stimulation with M. tuberculosis H37Rv enhanced the NK1 cytokines in NHS (P < 0.05), but not in other groups. With IL-15+IL-12 stimulation, we found increased NK1 cytokines (IL-2 and IFN-γ) in HIV (P < 0.05), but not in HIV–TB, when compared to unstimulated condition. Supplementing IL-15+IL-12 has potential in improving the frequency of NK1 cytokines for HIV, but not HIV–TB, suggesting that TB influences cytokine response during HIV infection.
Introduction
T
Persons infected with M. tuberculosis and HIV are at greater risk for progressive disease from both pathogens. M. tuberculosis-mediated stimulation of HIV replication has been related with the activation of the long terminal repeat sequence followed by host immune response activation (Kitaura and others 2001). The frequency of mutations in HIV among patients with dual infection has been found to be 2–3 times higher than in patients with HIV infection alone. Increased levels of tumor necrosis factor-α (TNF-α) and monocyte chemotactic protein-1 (MCP-1) induced by TB enhance HIV replication and also lead to an increase in HIV diversity (Collins and others 2002).
Natural killer (NK) cells participate in maintaining the hematopoietic system and regulate immune responses via cytokine production, induced in response to stimulation with several cytokines and/or target cell recognition (Perussia 1991). There are very few reports that describe the cytokine secretion pattern in HIV and TB co-infection. We and others have demonstrated previously that HIV-infected patients have decreased IFN-γ production and NK cytotoxicity (Chehimi and others 1997; Ramana Rao and others 2008).
Cytokines are the key regulators of immune response and cytokine dysregulation might have a role in rapid disease progression (Bal and others 2005). Lowered cytokine production by the monocytes in the microenvironment affects the effector functions of immune cells (Chehimi and others 1997; Lin and others 1997). We hypothesize that an effector function of NK cells, cytokine response is defective in HIV-infected individuals especially when co-infected with tuberculosis.
NK cells can be rapidly activated with IL-2 and macrophage/dendritic cell-derived cytokines such as IL-12, IL-15, and IL-18 (Fehniger and others 1999; Gerosa and others 2002; Ramana Rao and others 2008) that stimulate IFN-γ production via different intracellular pathways (Carson and others 1994; Carson and others 1995; Okamura and others 1998). Low levels of plasma IL-15 in patients with HIV and HIV–TB co-infection have been observed earlier in our laboratory. Deficiency in NK cell functions, namely the cytotoxic response and IFN-γ secretion are known to be partially relieved in vitro by interleukin (IL)-2 and IL-12 (Denis 1994), IL-15 and IL-12 (Ramana Rao and others 2008).
In this context, the objective of the study was to investigate the NK cell cytokine response (type 1/type 2) against M. tuberculosis in HIV infection and to evaluate the influence of pulmonary TB co-infection. We also want to examine whether impairment in production of innate cytokines is responsible for cytokine dysregulation during HIV infection and whether supplementing them will ameliorate NK cytokine function.
Materials and Methods
Subjects
All protocols were approved by the Institutional Ethics Committee of Tuberculosis Research Centre, India. Informed consent was obtained from the subjects. Pretest counseling was offered to all subjects. South Indian patients (Tamil Nadu and Andhra Pradesh) were recruited from Government Hospital of Thoracic Medicine, Tambaram Sanatorium, Chennai during May 2006 to February 2008.
The study includes normal healthy subjects (NHS, n = 30, 13 males, 21–31 years [median 22]), pulmonary tuberculosis patients (TB, n = 30, 23 males, 18–61 years [median 37]), HIV-infected individuals without TB (HIV, n = 30, 18 males, 21–58 years [median 35.5]), and patients with HIV and TB co-infection (HIV–TB, n = 30, 23 males, 26–54 years [median 35]). Demographic characteristics of the subjects recruited for the study is shown in Table 1.
Abbreviations: n, number of subjects; NHS, normal healthy subjects; TB, pulmonary tuberculosis patients; HIV, HIV-infected subjects; HIV–TB, HIV-seropositive tuberculosis patients.
The diagnosis of pulmonary TB was made as per guidelines of the Revised National Tuberculosis Control Program (RNTCP 2005). The criteria used were a positive sputum smear test for acid-fast bacilli (AFB), symptoms suggestive of TB, and radiological evidence consistent with TB. Culture and mycobacteria speciation are not routine practice under RNTCP and hence were not done. Based on a study from our center in this population, out of 2,361 TB patients recruited from RNTCP centers 111 (4.7%) were HIV-seropositive and none of these HIV–TB patients has nontuberculous mycobacteria (NTM) infection (Ramachandran and others 2003).
HIV seropositivity was determined by two rapid tests HIV TRI-DOT (J. Mitra & Co, India) and Retroquic (Qualpro Diagnostics, Goa, India). Patients with diabetes, chronic renal failure, or malignant diseases were excluded. Twenty one of 30 HIV-positive subjects had no co-morbid conditions. HIV–TB patients had no co-morbid conditions other than TB except two who had oral candidiasis. The HIV subjects had opportunistic infections and other conditions such as oral candidiasis, wasting, acid peptic disease, anemia, acute gastroenteritis, bronchitis, allergic rhinitis, and allergic bronchopulmonary disease. CD4 count ranges from 28.9 to 1,099.4 cells/mm3 (median 212.2) for HIV and 21.2 to 633.8 cells/mm3 (median 147.9) for HIV–TB.
Plasma collected in the EDTA tubes from each subject was separated and stored at −70°C until use.
Separation of PBMCs
Peripheral blood mononuclear cells (PBMCs) were separated from blood samples collected in heparinized containers by Histopaque density gradient centrifugation (Sigma-Aldrich Corp, St. Louis, MO). The cells were washed twice with Hank’s balanced salt solution (Sigma-Aldrich) and resuspended at a density of 2 × 10⁶ cells/mL in RPMI-1640 (Sigma-Aldrich Corp) supplemented with heat-inactivated 10% human AB serum (Sigma-Aldrich Corp) and 1× antibiotic/antimycotic solution (Invitrogen Corp, CA).
Intracellular cytokine staining
In vitro culture with recombinant cytokines. PBMCs at a density of 2 × 10⁶ cells/mL were cultured overnight in 24-well tissue culture plates (Costar, Corning Inc., NY) with 10 ng/mL each of IL-15 (BD Biosciences, SanJose, CA), combination of IL-15 with IL-12 (R&D Systems Inc., MN), or IL-2 (BD Biosciences) in 37°C, 5% CO2 atmosphere. The optimum concentration required for stimulation was determined for each cytokine/combination in preliminary experiments (data not presented). Cultures were pulsed with 5 µg/mL of Brefeldin A (Sigma-Aldrich Corp, St. Louis, MO) overnight. Cells were then washed, transferred to BD Falcon FACS tubes at a density of 0.3 × 10⁶ cells/tube, stained for surface receptors using the monoclonal antibodies anti-CD3-FITC, CD16+CD56-PE-Cy5 (BD Biosciences), and incubated at 4°C for 30 min. After staining, cells were washed and treated with BD Cytofix/Cytoperm buffer for 30 min at 4°C. Cells were washed again and stained for intracellular cytokines PE-conjugated monoclonal antibodies IL-2, IL-4, IFN-γ, and TNF-α (BD Biosciences). Finally, cells were washed and resuspended in 1% paraformaldehyde (PFA).
Stimulation with M. tuberculosis. For stimulation experiments with M. tuberculosis H37Rv, blood was diluted in equal volume with RPMI-1640, seeded onto six-well tissue culture plates (BD Biosciences, SanJose, CA). Cultures were stimulated overnight with live M. tuberculosis, at a MOI of 10:1 with respect to monocytes, along with 5 µg/mL of Brefeldin A (Sigma-Aldrich Corp, St. Louis, MO) at 37°C in 5% CO2 atmosphere and 95% humidity. After in vitro culture, diluted blood was washed and transferred to BD Falcon FACS tubes using 1× PBS. After staining for surface antibodies, RBCs were lysed using 1× BD FACS Lysing Solution (BD Biosciences) and processed as described earlier.
Data acquisition and analysis. Tubes were gently mixed and acquired on a FACSCalibur flow cytometer (BD Biosciences, San Jose, CA) and data were analyzed using FlowJo software (Tree Star Inc., San Carlos, CA, version 7.1.1). A dot plot of antibodies CD3-FITC versus CD16+CD56 PE-Cy5 was set within lymphocyte region and at least 25,000 events were collected per sample. The events from the quadrant CD3− CD16+CD56+ were transferred to a histogram of PE-labeled cytokine. The percentage of cytokine-positive NK cells represents the percent NK cells secreting cytokine.
Measurement of plasma IL-15
Enzyme-linked immunosorbent assay (ELISA) was performed to quantitate IL-15 levels in plasma samples of various groups using human IL-15 Duoset (R&D Systems Inc., MN). All tests were performed following the instructions of the manufacturer. The minimal detection limit for this commercial kit is 15 pg/mL.
Enumeration
Phenotyping of PBMCs was done by flow cytometry. In brief, 100 µL of whole blood was incubated with the monoclonal antibodies CD3-FITC, CD16-PE, CD56-PE-Cy5, CD4-APC, and CD8-APC (BD Biosciences, SanJose, CA) for 30 min at 4°C. After staining, RBC was lysed using 1× BD FACS Lysing Solution (BD Biosciences). The tubes were centrifuged at 250g for 10 min, washed once again with 1× PBS, and resuspended in 1% paraformaldehyde.
Total and differential white blood cell counts were determined for all samples using an automated ABX Pentra 60 hematology analyzer (ABX Diagnostics, France). The absolute cell numbers were calculated by multiplying the percentage of cells with the total lymphocyte count.
Statistical analysis
Percent NK cell-secreting cytokines were expressed as mean + SEM of 15 subjects in each group. Cytokine responses between various groups were compared and determined by one-way ANOVA followed by Tukey’s multiple comparison test using GraphPad Prism version 4.03 for windows (GraphPad software, SanDiego, CA). The responses between different stimulants in each group were compared using two-way ANOVA followed by Bonferroni’s posttest. Asterisk and hash represent significant values (P < 0.05). Pearson’s correlation coefficient was used to calculate the correlation analysis.
Results
Plasma IL-15 levels
Scatter plot of the plasma IL-15 level in various groups as measured by ELISA is depicted in Figure 1. Dashed horizontal line represents minimal detection limit (15 pg/mL) of the kit. Values below the minimal limit are considered undetectable and are taken as zero. Of the 30 subjects recruited for each group, we found that only 17 HIV (56.7%) and eight HIV–TB (26.7%) subjects had detectable plasma IL-15 as compared to 30 NHS (100%) and 20 TB (66.7%).

Plasma IL-15 level in various groups. Scatter diagram of plasma IL-15 levels is shown as measured by ELISA. Dashed line in the plot represents the lower detection limit of the ELISA kit. Horizontal bar refers to the median of those values that are detected. Plasma IL-15 levels between NHS and other groups in the context of detected values were statistically compared using Kruskal–Wallis test followed by Dunn’s multiple comparison test– * P < 0.05. Abbreviations: IL, interleukin; HIV, HIV-infected subjects; HIV–TB, HIVseropositive tuberculosis patients; NHS, normal healthy subjects; TB, pulmonary tuberculosis patients.
When the undetected samples are considered zero and total (detected and undetected) samples are compared, significant reduction in IL-15 levels were observed in HIV and HIV–TB compared to NHS.
NK cell numbers
The absolute number of mean NK cells (total and subpopulations) among NHS, TB, HIV, and HIV–TB groups was given in Figure 2. When compared with NHS, we observed a reduction in NK cells (total, CD16+, CD56+, and CD16+CD56+) for the groups HIV and HIV–TB. However, the difference was significant in CD56+ and total NK cells (P < 0.05) only. Similarly, decreased NK cells (total and subpopulations) were observed in HIV and HIV–TB groups (P < 0.05), when compared with TB. Besides NK cell numbers, total lymphocytes were found to be depleted in HIV and HIV–TB (data not shown).
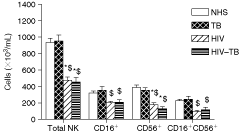
NK cell numbers among different groups. Data are expressed as mean + SEM. Statistical analysis was performed by two-way ANOVA followed by Bonferroni’s posttest. * Significance (P < 0.05) when the comparison is with NHS. $ Significance (P < 0.05) when the comparison is with TB. Abbreviations: IL, interleukin; HIV, HIV-infected subjects; HIV–TB, HIV-seropositive tuberculosis patients; NHS, normal healthy subjects; NK, natural killer cells; TB, pulmonary tuberculosis patients.
Basal frequency of cytokine-secreting lymphocyte profile
Basal cytokine expression pattern of lymphocytes among various groups is presented in (Fig. 3). Cytokine response of NK cells were studied in total NK cells (CD3+ CD16+CD56+) cells and not in subpopulation of NK cells. Basal type 1 cytokine (IL-2, IFN-γ, and TNF-α)-secreting NK cells (NK1 cytokines) were decreased significantly in TB, HIV, and HIV–TB groups (P < 0.05) when compared with NHS. No such difference in cytokine pattern was observed in CD3+ cells or with Th2 cytokine (IL-4). The expression of type 1 and type 2 cytokines were elevated in all groups for NK cells when compared with CD3 cells (P < 0.05).

Basal cytokine expression profile of lymphocytes. Expression pattern of IL-2, IL-4, IFN-γ, and TNF-α on lymphocyte populations (
NK cell cytokine response after stimulation with M. tuberculosis
Stimulation with M. tuberculosis H37Rv enhanced the NK1 cytokines in NHS (P < 0.05) compared to unstimulated culture, but did not affect the NK cytokine response in other groups (Fig. 4A–4D). No significant changes were observed upon stimulation with M. tuberculosis in any of the groups for NK2 cytokine (Fig. 4D). Similar to basal response, M. tuberculosis-stimulated NK1 cytokines were also reduced significantly in TB, HIV, and HIV–TB groups (P < 0.05) when compared with NHS. Representative scattergram showing NK cell cytokine response upon stimulation with M. tuberculosis is given in Figure 4E.
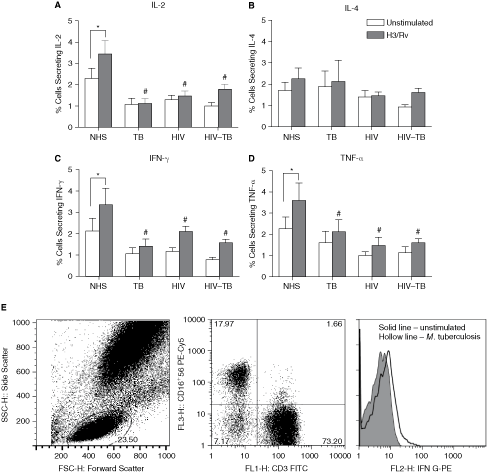
Cytokine-positive NK cell pattern against Mycobacterium tuberculosis. Expression of IL-2, IL-4, IFN-γ, and TNF-α on NK cells upon infection with M. tuberculosis (
NK cell cytokine response upon stimulation with recombinant cytokines
The NK cell cytokine expression pattern in response to recombinant cytokines is shown in Figure 5A to 5D and representative histograms of a normal healthy subject are given in Figure 5E. Upon stimulation with IL-15+IL-12, we found increased number of NK1 cytokines (IL-2 and IFN-γ) in HIV (P < 0.05), but not in HIV–TB, when compared to unstimulated condition. Similar increase in IFN-γ-positive NK cells (P < 0.05) was observed in HIV with IL-15+IL-12 combination compared to IL-15 alone. No significant changes were observed in the number of NK cells secreting TNF-α and IL-4 for all the groups. After stimulation with IL-15+IL-2, we found elevated IL-2-positive NK cells in HIV–TB (P < 0.05), when compared with unstimulated condition. However, this difference was not observed for IFN-γ, TNF-α, or IL-4.
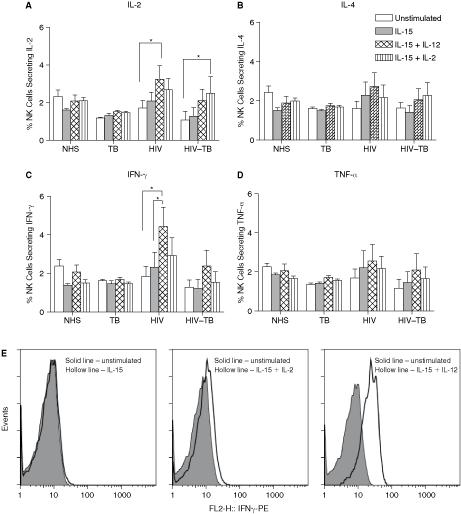
Effect of cytokine stimulation on NK cells. Expression of IL-2, IL-4, IFN-γ, and TNF-α on NK cells upon stimulation with recombinant cytokines (
NK cell cytokine response and CD4 counts
Correlation analysis of the NK cell cytokine response based on CD4 counts was performed. In HIV, a negative trend of correlation was observed for both unstimulated and IL-15+IL-12 stimulation, but the trend is not significant. In HIV–TB, no correlation between the frequency of NK-positive IFN-γ and CD4 counts was observed for both unstimulated culture and IL-15+IL-12 stimulation (data not shown). Furthermore, we do not found any correlation between CD4 counts and other NK cytokines (IL-2, IL-4, and TNF-α for HIV and HIV–TB (data not shown).
Correlation of CD4 counts with plasma IL-15 levels and NK cell numbers
Analyses of correlation among CD4 counts, plasma IL-15 levels, and NK cell numbers were performed and given in Figure 6. Results show no correlation between CD4 counts and plasma IL-15 levels in HIV-positive individuals irrespective of the TB status (Fig. 6A and 6B). However, we observed a direct correlation between CD4 counts and NK cell numbers in HIV (r = 0.81, P < 0.05) and HIV–TB (r = 0.47, P < 0.05) individuals (Fig. 6C and 6D).

Correlation of CD4 counts with plasma IL-15 levels and NK cell numbers. The relationship between CD4 count and plasma IL-15 for HIV and HIV–TB is given in (
Discussion
Tuberculosis causes more extensive and life-threatening disease in patients with HIV infection, than in immunocompetent persons. The type 1 cytokines IFN-γ and IL-2 predominate at the site of disease in patients with pleuritis (Barnes and others 1993), but the pattern of cytokine production in patients with pulmonary tuberculosis particularly when co-infected with HIV is uncertain. We hypothesized that the severe manifestations of HIV–TB co-infected patients are due to alterations in the cytokines and therefore evaluated the cytokine profile in patients co-infected with HIV and M. tuberculosis.
Studies demonstrated that killing of intracellular M. tuberculosis occurred within the first 24 h of co-culture of infected monocytes with unstimulated peripheral blood lymphocytes, which implied a role for innate immune responses, particularly unstimulated NK cells, in containment of intracellular M. tuberculosis (Brill and others 2001). Natural Killer cells represent a population of lymphocytes, which could mediate innate protection against M. tuberculosis. NK cells have been implicated in early immune responses to viruses and to a variety of intracellular pathogens and are capable of rapidly producing gamma interferon (IFN-γ) as well as lysing specific target cells in the absence of prior activation (Robertson and Ritz 1990; Bancroft 1993; Biron and others 1999).
Cytokines have been thought to play an important role in altering the course of disease in dually infected patients (Bal and others 2005). Lowered cytokine production by the monocytes in the microenvironment affects the effector functions of immune cells (Chehimi and others 1997; Lin and others 1997). Low levels of plasma IL-15 in HIV compared to NHS have been observed earlier in our laboratory. In the present study, we observed that only 56.7% HIV and 26.7% HIV–TB subjects had detectable plasma IL-15 as against 100% NHS and 66.7% TB. These results suggest impaired rather than reduced level of plasma IL-15 in HIV-infected subjects irrespective of the TB status.
In the present study, reduced NK cell numbers were found in HIV and HIV–TB (P < 0.05) when compared with NHS. Such a difference was not seen in TB. Similarly, a decreasing pattern of percentage of NK cells was also observed for HIV and HIV–TB subjects. Total lymphocyte count (P < 0.001) is also depressed in these groups, which is mainly due to the destruction of CD4 cells and macrophages by the virus (Mosier 2000).
The frequencies of basal type 1 and type 2 cytokines were significantly higher (P < 0.05) among NK cells than CD3 cells regardless of the infection with HIV, TB, or both. Studies have reported CD4 cell as the major contributor of IFN-γ and majority of these studies have measured IFN-γ using ELISA or have expressed the percentage of CD4+ IFN-γ+ cells out of total lymphocytes. In this study, we have expressed the percentage of IFN-γ+ NK+ cells within total NK cells. In this scenario, though CD3 cell is the major cell type of lymphocytes (∼70%), percentage of cytokine-positive cells was found to be significantly lower as compared to NK cells. In comparison with NHS, basal NK1 cytokines were decreased (P < 0.05) in TB and HIV or when dually infected with both. No such difference in cytokine pattern was observed with NK2 cytokine (IL-4). Reduced IL-2 and IFN-γ response in TB and HIV groups could probably be due to altered innate cytokines present in the microenvironment.
Upon stimulation with M. tuberculosis in vitro, percentage of NK1 cytokines was elevated (P < 0.05) in NHS alone, when compared to unstimulated condition. Similar to basal response, M. tuberculosis-stimulated NK1 cytokines was reduced (P < 0.05) in TB, HIV, or with dual infection compared to that of NHS. PBMCs from HIV-infected TB patients had reduced proliferative and type 1 responses, compared with HIV-seronegative tuberculosis patients, which is probably induced by immunosuppressive cytokines produced by macrophages/monocytes rather than by type 2 cells (Zhang and others 1994).
Decreased IFN-γ secretion by TB patients might be attributed to genetic predisposition, compartmentalization of responsive cells to the site of infection associated with the suppressed cellular immunity (Lorgat and others 1992a, 1992b), and abnormalities in cytokine production by monocytes (Hirsch and others 1996; Vankayalapati and others 2000). Some studies have reported higher levels of TGF-β from TB patients and up-regulation of IFN-γ production upon neutralization of TGF-β (Hirsch and others 1996; Hirsch and others 1997).
Activation of NK cells by recombinant cytokines such as IL-12, IL-15, and IL-18 (Fehniger and others 1999; Gerosa and others 2002; Ramana Rao and others 2008) has been demonstrated to stimulate IFN-γ production through various intracellular pathways (Carson and others 1994; Carson and others 1995; Okamura and others 1998). We and others (d’Ettorre and others 2002) have observed reduced plasma IL-15 production in HIV and HIV–TB individuals. In our earlier study, deficiency in NK cytotoxicity has been reported to be partially relieved in vitro by IL-15 and IL-12 (Ramana Rao and others 2008). Others have also reported similar results with IL-2 and IL-12 combination (Denis 1994). Hence the present study investigates the effect of recombinant cytokines on other NK cell functions in particular type 1 cytokine response.
Stimulation with recombinant cytokines activated the frequency of NK cell-secreting Th1 cytokines and the maximal cytokine response was produced by IL-15+IL-12 combination. Upon stimulation with IL-15+IL-12, NK cell-mediated type 1 cytokine response was specifically elevated in HIV-infected individuals unlike TB or HIV–TB patients, which could be due to the influence of tuberculosis. Moreover, some of the patients recruited in this study were hospitalized suggesting severe disease.
We found no correlation between CD4 cell count and NK cell-mediated IFN-γ response among HIV or HIV–TB even after stimulation with IL-15 and IL-12. HIV-infected individuals with lower CD4 count also show higher NK cell-mediated IFN-γ response, which means severity of HIV infection have not compromised the NK cytokine response. We did not find any correlation between CD4 counts and plasma IL-15 levels in HIV-positive individuals irrespective of the TB status, which suggests that disease severity in HIV might not be reflected by plasma IL-15 levels. However, a direct correlation between CD4 counts and NK cell numbers was observed in HIV (r = 0.81, P < 0.05) and HIV–TB (r = 0.47, P < 0.05) individuals suggesting that disease severity in HIV influences NK cell numbers.
Although the mechanism of IFN-γ in protection from TB in humans is still not clear, decreased production of IFN-γ in HIV co-infection may lead to faster progression of TB. It is evident from the observations that dually infected patients show a profound suppression of both NK1 and NK2 cytokines. HIV and TB may have additive effects on the immune system with each infection contributing to cytokine dysregulation. As a result of this cytokine imbalance, dysregulated immune response to either pathogen could lead to further detrimental effects on the host and may enhance disease progression. Partial immune reconstitution reflected by proliferation of PBMCs in response to PPD and increased secretion of IFN-γ has been reported to occur following anti-retroviral therapy in HIV-infected patients (Schluger and others 2002). The present study demonstrated partial reconstitution of NK cell function in HIV–TB individuals after stimulation with IL-15+IL-12, but the increase is not statistically significant. However, this cytokine combination has demonstrated enormous potential in partial restoration of IFN-γ for HIV-positive individuals without TB.
To summarize, IL-15 production is impaired in HIV-positive subjects. Supplementing recombinant IL-15 along with IL-12 in vitro has improved the frequency of NK cell type 1 cytokines in HIV-infected subjects recruited from south India. This enhancement is not apparent in HIV–TB perhaps due to the influence of tuberculosis on HIV.
Footnotes
Acknowledgments
P.V.R.R. thanks the Indian Council of Medical Research (ICMR), New Delhi, India, for providing Senior Research Fellowship. Technical support rendered by Mr. Murugesan for flow cytometry is kindly acknowledged. We gratefully thank the patients and controls for participating in the study.