




Abstract
The transforming growth factor-β1 (TGF-β1) bioassay developed in this study monitors increased luciferase activity in MCF10A cells containing the matrix metalloproteinase-2 (MMP-2) promoter with a luciferase reporter and treated with increasing TGF-β1 concentrations. The response was linear in the concentration range from 75 to 2,500 pg/mL. The abilities of 3 types of TGF-β in inducing MMP-2 were different. The luciferase activity induced by TGF-β1 was about 2 times more than that by TGF-β2 and TGF-β3. The MMP-2 promoter bioassay showed greater reproducibility (coefficient of variation [CV] 10%) than the previously developed anticell proliferation assay of TF-1 cell (CV 16%) and the MMP-2 zymogram assay (CV 40%).
Introduction
T
TGF-β, which has an amazing diversity of biological effects including cell proliferation, differentiation, migration, and apoptosis (de Martin and others 1987), is frequently involved in cell growth regulation in embryogenesis, tissue repair, and human tumors (Massague 1990). One function of TGF-β associated with cell proliferation is to induce expression of platelet-derived growth factor (PDGF) (Karsdal and others 2002), which promotes cell growth. Another is the growth inhibition of astrocytes with the induction of apoptosis (Platten and others 2001; Wang and others 2006). Regarding these functions, enhanced TGF-β production appears to be a characteristic feature in a variety of disease states such as atherosclerosis and fibrosis, hepatic cirrhosis, pulmonary fibrosis, and glomerular sclerosis (Gerard and others 2000).
TGF-β has dual roles as tumor suppressor and tumor promoter in tumorigenesis. It generally acts as a tumor suppressor by inhibiting cellular proliferation or by promoting apoptosis (Markowitz and Roberts 1996; Hanahan and Weinberg 2000; Moustakas and others 2002). But in cancer cells, tumor invasiveness is increased with increasing TGF-β production (Gerard and others 2000). TGF-β induces epithelial-to-mesenchymal transitions, type IV collagenase, 72-kDa matrix metalloproteinase (MMP-2), 92-kDa MMP-9 at late stages of tumorigenesis, and tumor cell invasion and migration (Harold and others 1990). It regulates MMP-2 activity and transcriptional regulation (Massagué and Wotton 2000).
Of these effects, the ability of MMP-2 to degrade the extracellular matrix, resulting in migration of endothelial cells, is known to play a role in angiogenesis, tumor growth, and metastasis (Coussens and others 2002). Recently, MMPs have been seen as potent candidates for target molecules in antiangiogenesis therapies for several solid tumors in which the goal is to increase the overall survival of the patient. Inhibition of MMP is a target for anticancer therapy (Curran and Murray 2000). Enhanced TGF-β1 activity in the cancer indicates that the cancer might also have increased potency for metastasis. Blocking the development of metastasis in cancer by decreasing the TGF-β levels might be a target of anticancer therapy. It is necessary to develop a TGF-β bioassay that involves MMP-2.
Several biological and immunological assays are available to test for TGF-β. A bioassay for TGF-β quantitates the inhibition of TF-1 cell proliferation induced by interleukin-5 (IL-5) (Randall and others 1993), and the growth of MvLu mink lung epithelial cells, AKR-2B (clone 84A) cell proliferation (Moses and others 1981; Like and Massagué 1986), or the luciferase activity transfected with the growth hormone gene (Farmer and Weigent 2006). However, the cell proliferation assays cannot represent the biological target effect of TGF-β1 on MMP-2. The AKR-2B cell line bioassay involves colony formation in soft agar, which is affected by many variables, eg, batch variation in calf serum and a laborious qualitative procedure requiring considerable skill (Moses and others 1981).
Therefore, in this study, we have developed a TGF-β1 bioassay based on its ability to induce MMP-2 production in MCF10A cells at the transcriptional regulation level.
Materials and Methods
Cell culture
MCF10A cells (ATCC; 500 mL DMEM-F12; 0.5 mg/mL, 0.5 mL hydrocortisone; 10 μg/mL, 0.5 mL human epidermal growth factor (hEGF); 5 mg/mL, 0.5 mL insulin; 100 ng/mL cholera toxin; and 10% horse serum) and TF-1 [ATCC; RPMI-1640; 2 ng/mL recombinant human granulocyte macrophage colony-stimulating factor (rh GM-CSF); 10% fetal bovine serum (FBS)] cells were incubated in growth medium at 37°C in a humidified atmosphere containing 5% CO2.
Establishment of pGL4.20 puro/MMP-2 promoter MCF10A cell line
MCF10A cells (2.5 × 10⁵ cells/mL) were incubated overnight in 96-well plates (Nunc) containing growth medium without antibiotics. The pGL4.20/MMP-2 promoter plasmid was purified with a Plasmid Midi Kit (Qiagen). The pGL4.20/MMP-2 promoter is the pGL4.20 puro/luciferase plasmid (Promega) containing the MMP-2 promoter. The purified plasmid was cut with SalI at 37°C for 4 h and quantitated by measuring UV absorbance A at 280/260 nm. A purified solution containing 12 μg of DNA was mixed with 1.5 mL of OptiMEM (Gibco). Thirty microliters of lipofectamine (Promega) and 1.5 mL of OptiMEM were mixed, followed by incubation at room temperature for 5 min. The DNA mixture and the lipofectamine mixture were mixed and incubated for 20 min. The mixtures were added to the cell suspensions followed by shaking for 6 h. Then the cell growth medium without antibiotics was changed to medium with antibiotics. The next day, the cells were split with the selection medium at a ratio of 1:10. After 2 days, colony formation in new growth medium was confirmed. These colonies were moved into 96-well plates and one colony per well was selected.
Luciferase activity of TGF-β1 in MCF10A/MMP-2 promoter stable cell line
The MCF10A/MMP-2 promoter cells (5 × 10⁴ cells/well) were incubated in a 96-well plate and grown overnight in the absence of horse serum. The cells were treated with TGF-β1 (Sigma) over the concentration range from 1 to 10,000 pg/mL for 48 h, followed by washing with phosphate-buffered saline. The TGF-β1 solution at a concentration of 10,000 pg/mL was diluted with serum-free growth medium to final concentrations of 1, 2, 5, 10, 20, 39, 78, 156, 312, 625, 1,250, 2,500, 5,000, and 10,000 pg/mL. Lysis buffer (20 μL/well; Promega) was added to each well and the cells were frozen at −70°C for overnight, followed by lysis at 4°C for 15 min. Luciferase reagent (200 μL/well; Promega) was added to each well and luciferase activity was measured immediately. Each measured value was divided by the value of the control (without TGF-β1) and expressed as a percentage [ie, (luciferase activity of sample)/(luciferase activity of control) × 100].
Anticell proliferation assay of TF-1 cells with TGF-β1
TF-1 cells (1 × 10⁴ cells/well; a human erythroleukemia cell line; ATCC) were seeded in 96-well plates and cultured in RPMI-1640 medium (Gibco) supplemented with 5% FBS (Gibco), penicillin/streptomycin (Gibco), and 2 ng/mL GM-CSF in the presence of TGF-β1 over the concentration range from 1 to 10,000 pg/mL for 48 h.
Gelatine zymogram assay
A total of 1 × 10⁶ MCF10A cells were plated into each well of 6-well plates and incubated until 90% confluence. The cells were treated with TGF-β1 at a concentration of 10, 100, 1,000, and 10,000 pg/mL in a serum-free growth medium for 48 h. The medium was collected and centrifuged with a centricon (molecular weight [mw] cutoff: 10,000) at 3,000 g for 80 min. The concentration of collected protein was quantitated using bicinchoninic acid (BCA) protein assay. The same concentration of protein was mixed with 4× laemmli nonreducing sample buffer at room temperature for 30 min, followed by loading into precasted 10% sodium dodecyl sulfate–polyacrylamide gel containing 1 mg/mL of gelatin. Then electrophoresis was done at 120 V for 90 min. The gel was washed with 2.5% Triton X-100 for 30 min thrice and with 50 mM Tris-HCl containing 5 mM CaCl2, 0.02% Brij-35, and 0.25 mM sodium azide for 15 min. Then the gel was incubated with the same buffer at 37°C for overnight, followed by staining with 0.5% Coomassie brilliant blue R-250 for 40 min and destaining with 10% acetic acid for 30 min twice. Whole gel containing gelatin was blue, while the bands digested with gelatinase were white.
Results
Bioassay of induction of MMP-2 expression by TGF-β1
A human MMP-2 promoter construct was inserted into the pGL4.20 puro/luciferase plasmid. This vector, pGL4.20/MMP-2, was transfected into MCF10A cells and the transfected cells were selected with puromycin.
To optimize TGF-β1 concentrations, the cells were treated with TGF-β1 over the concentration range from 1 to 10,000 pg/mL. A linear response was observed between 78 and 2,500 pg/mL (Fig. 1 and Table 1).
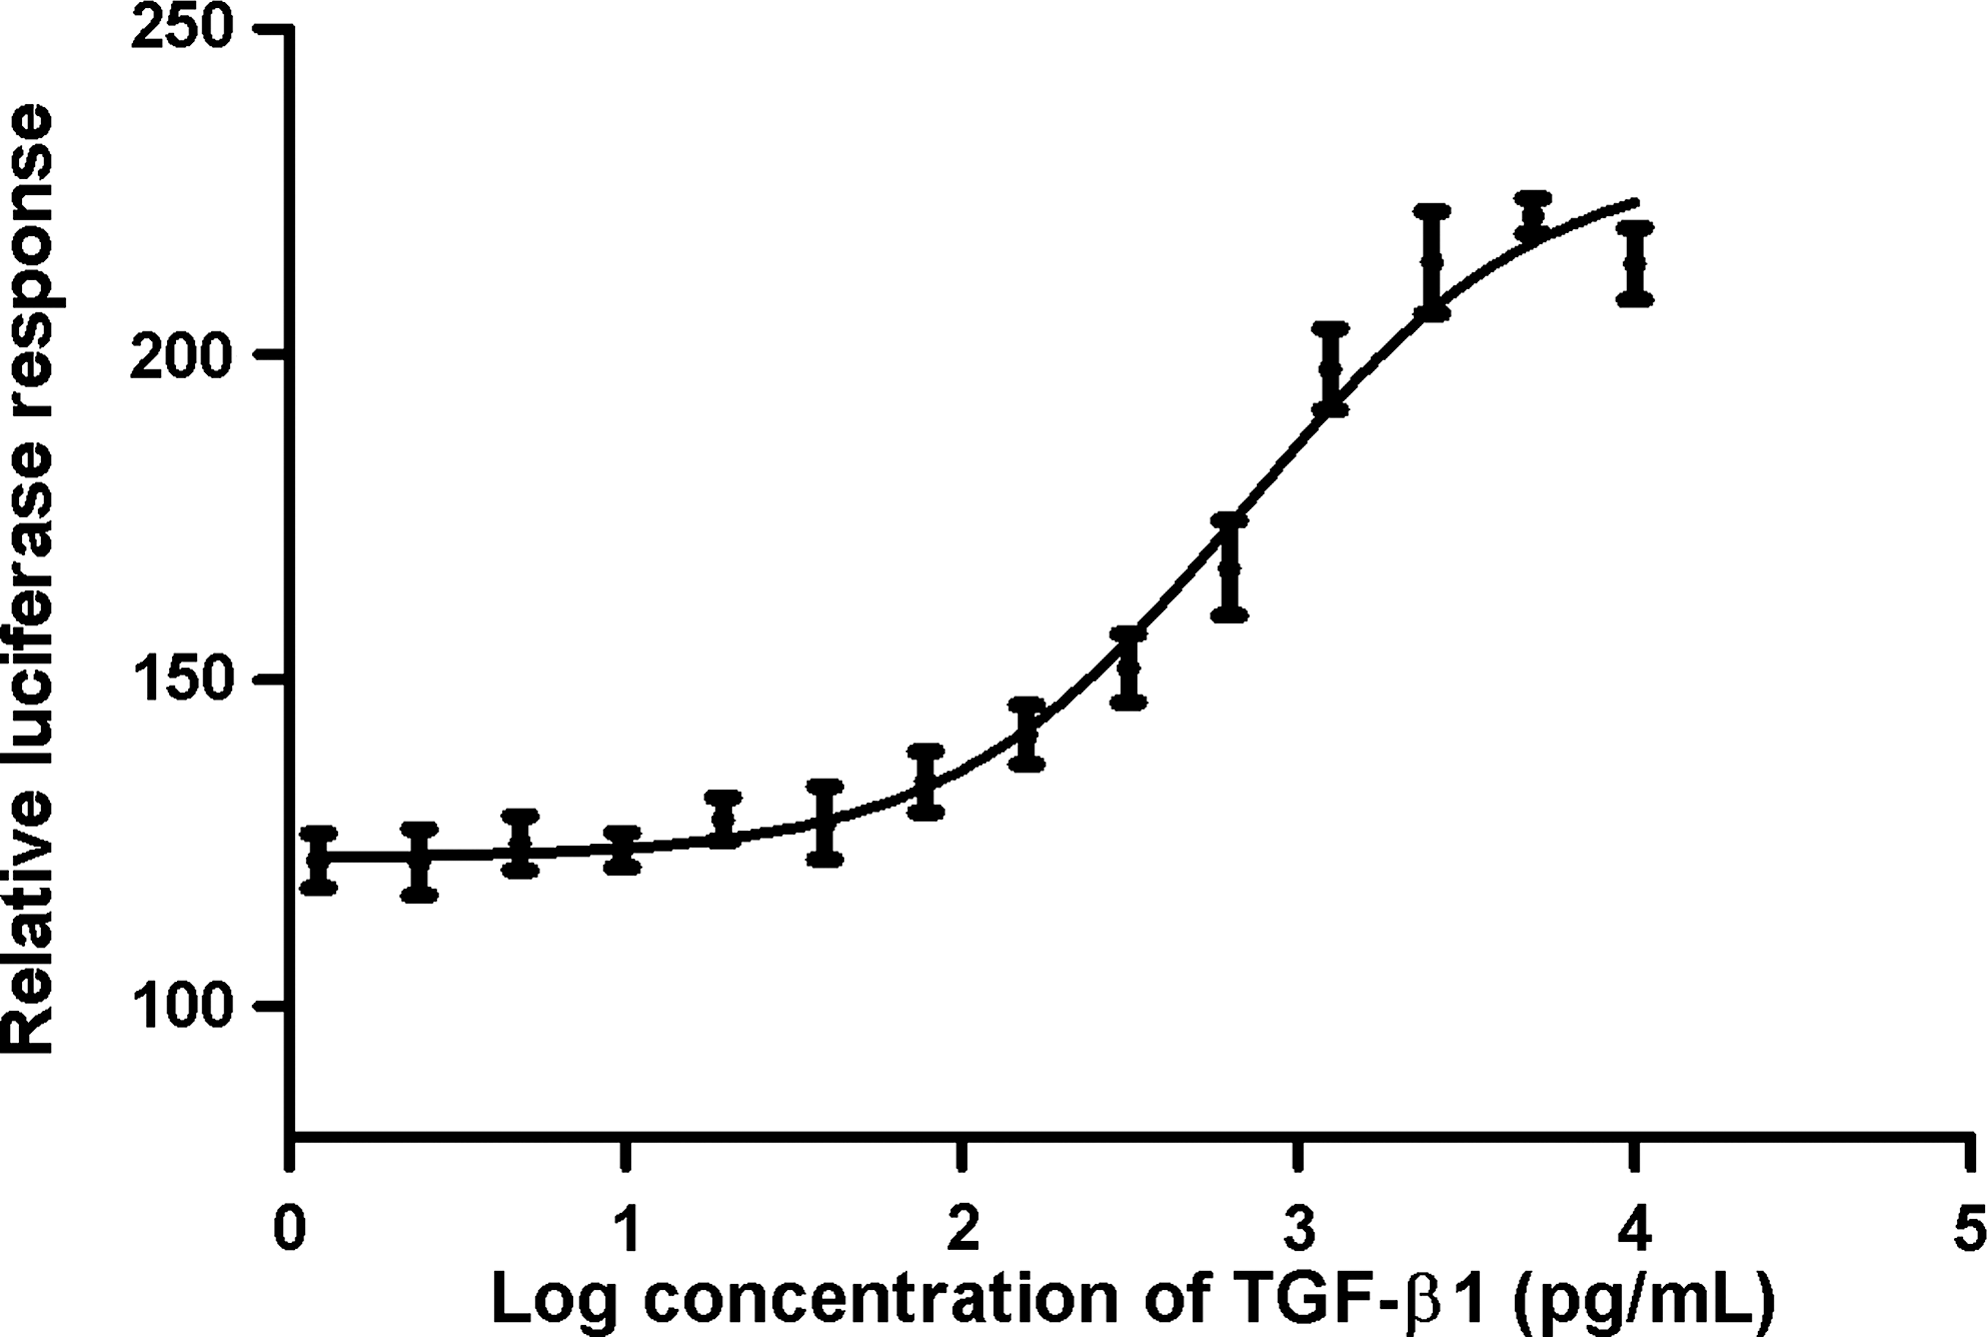
A total of 3 × 10⁵ cells/mL were incubated in a 96-well plate with serum-free medium for overnight. Then the cells were treated with various concentrations of TGF-β1 for 48 h (n = 3). Relative luciferase response = [(luciferase activity with TGF-β1)/(luciferase activity without TGF-β1) × 100]. TGF, transforming growth factor.
Abbreviations: TGF-β1, transforming growth factor-β1; MMP-2, matrix metalloproteinase-2.
There are 3 kinds of TGF-β subunits: TGF-β1, TGF-β2, and TGF-β3 (Derynck and others 1985, 1988; Wang and others 2006). TGF-β induces MMP-2, and MMP-2 activates latent TGF-β (de Martin and others 1987; Karsdal and others 2002). But it is not certain that individually TGF-β1, TGF-β2, and TGF-β3 induce MMP-2. To identify the ability of TGF-β1, TGF-β2, and TGF-β3 to induce MMP-2, MCF10A cells transfected with pGL4.20/MMP-2 were incubated with TGF-β1, TGF-β2, or TGF-β3 over the concentration range from 1 or 19 pg/mL to 10,000 pg/mL. TGF-β1 and TGF-β2 induced MMP-2 at the concentration range from 78 to 2,500 pg/mL, whereas TGF-β3 induced MMP-2 at the concentration range from 19 to 625 pg/mL (Fig. 2).
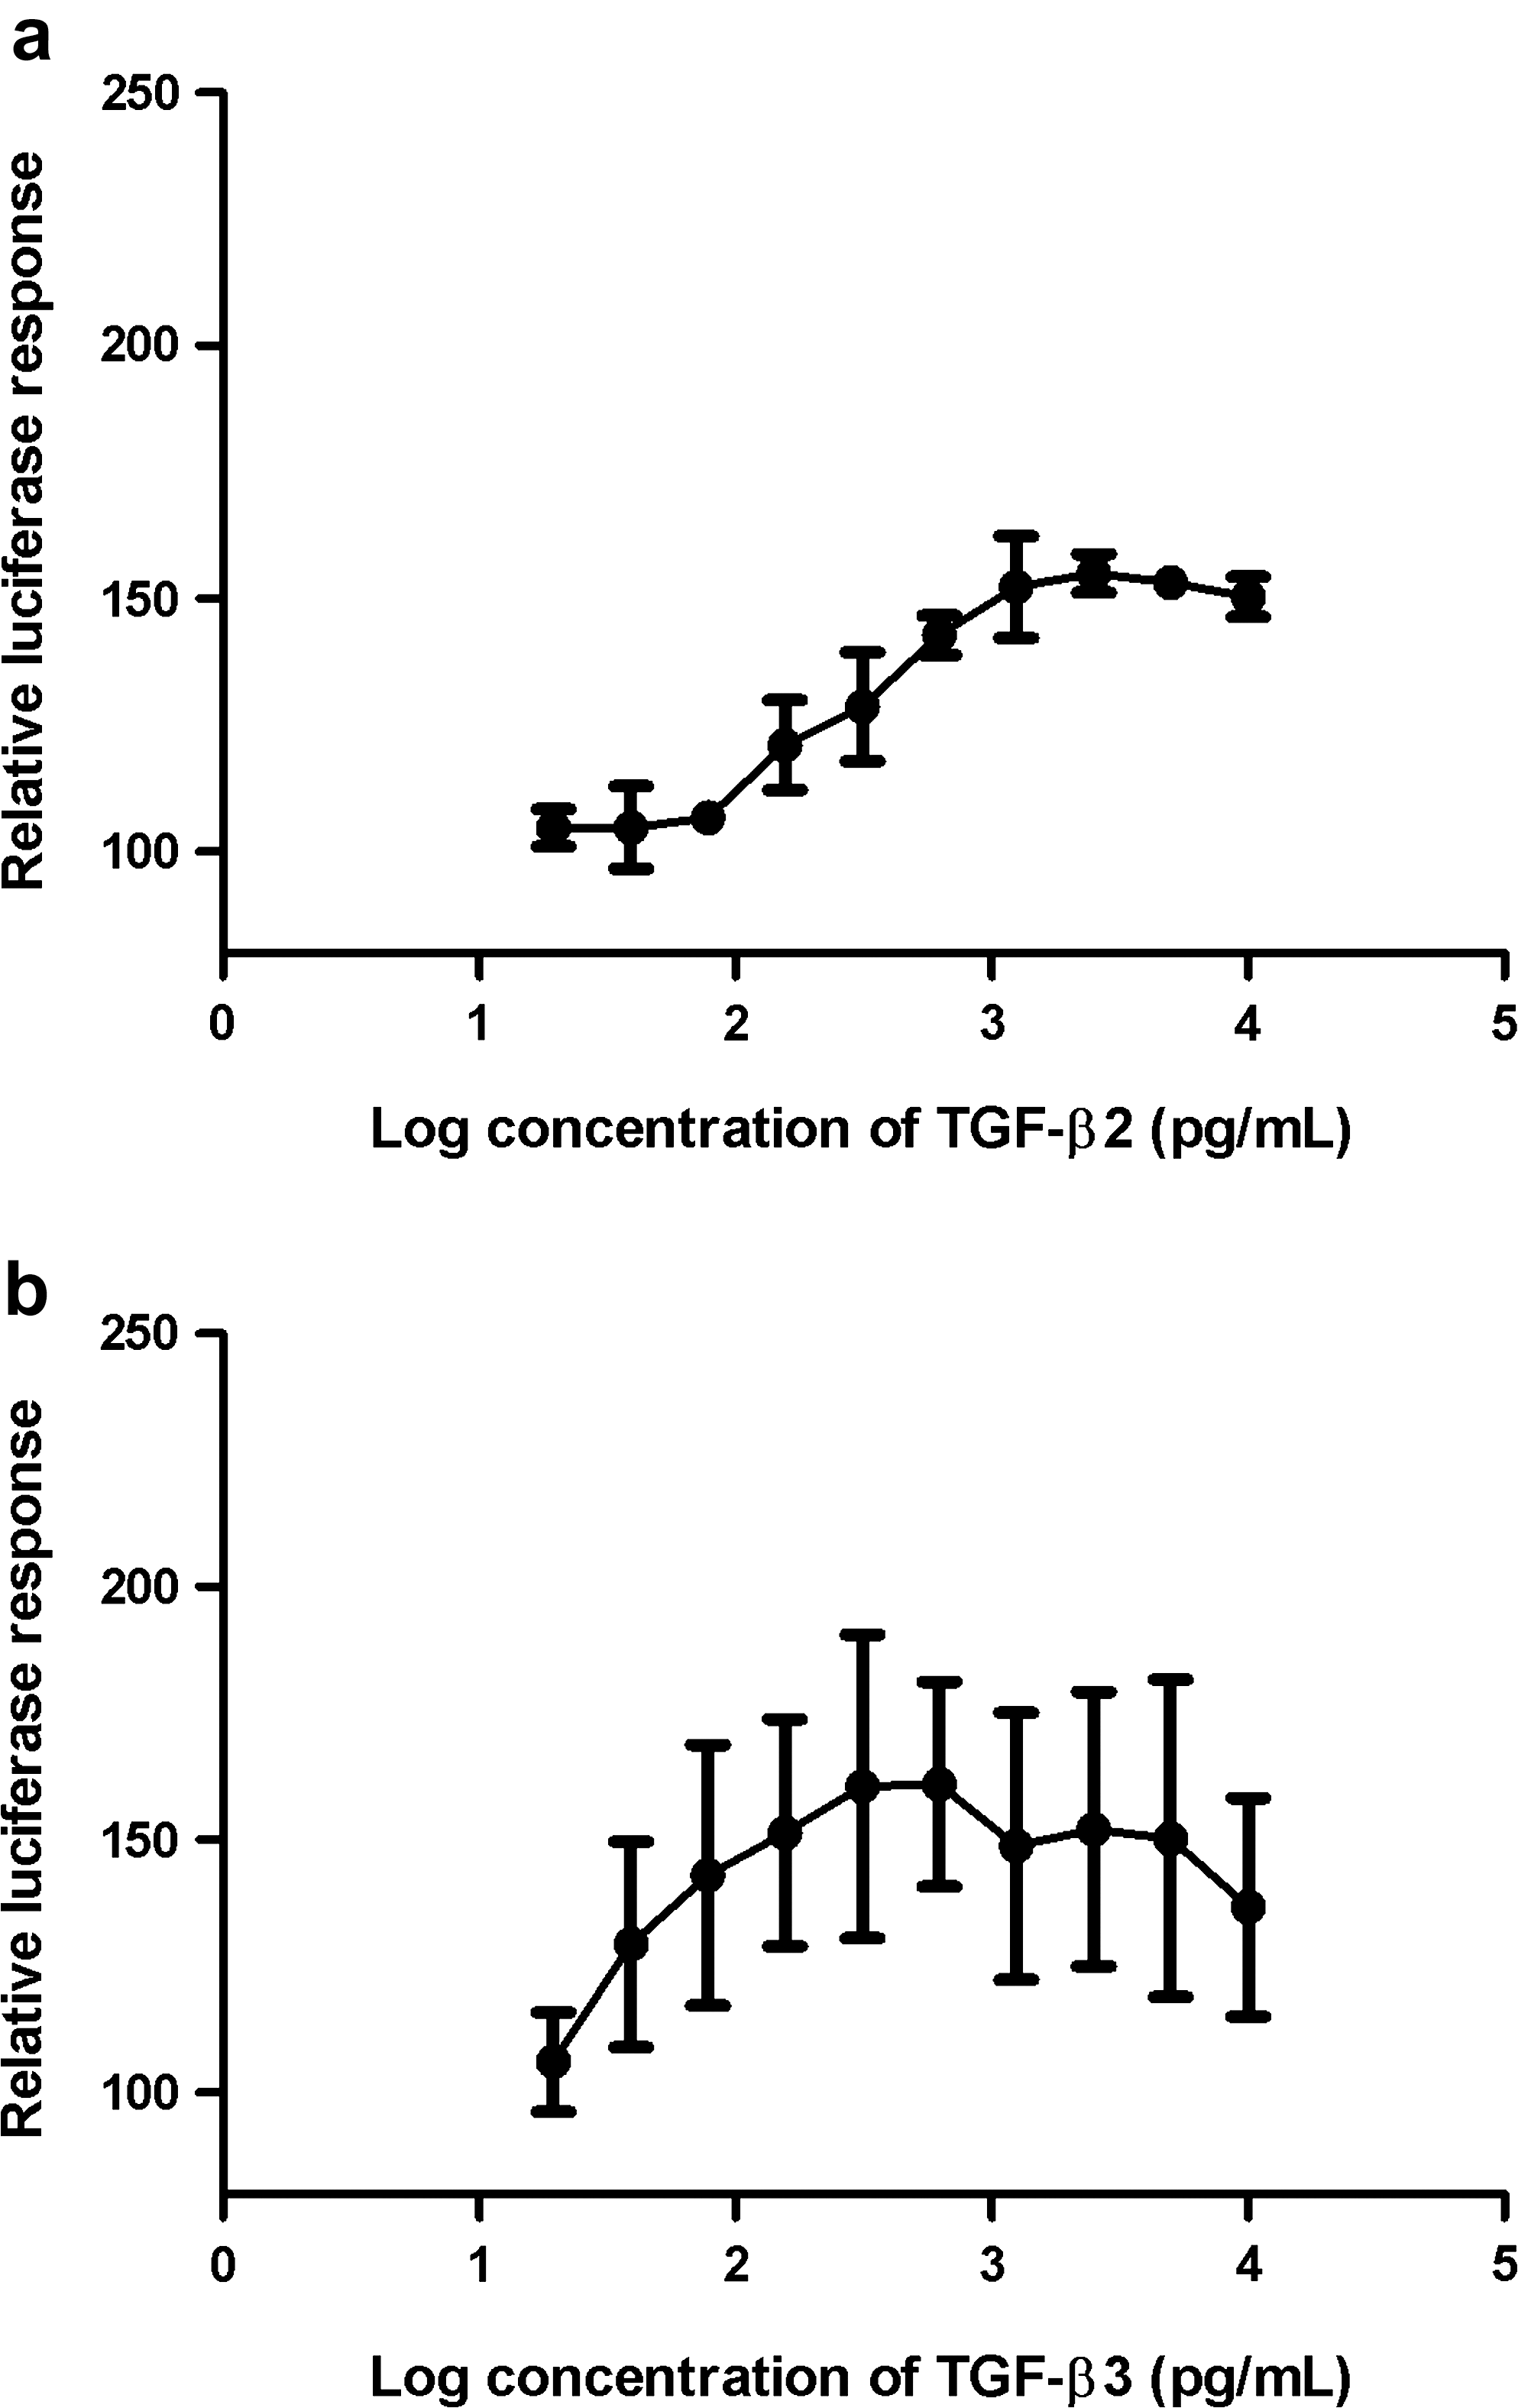
Luciferase activity expressed by (
Anticell proliferation assay of TF-1 cells with TGF-β1
The cells were treated with TGF-β1 at the concentration range from 1 to 10,000 pg/mL for 48 h in the presence of 2 ng/mL rhGM-CSF. Cell viability was measured with AlamarBlue treatment for 4 h. The proliferation of TF-1 cells induced by rhGM-CSF was arrested by TGF-β1 in the range of 78–1,250 pg/mL (Fig. 3 and Table 1).

Effect of TGF-β1 on the proliferation of TF-1 cells induced by rh GM-CSF. TF-1 bioassay was performed at various concentrations of TGF-b1 using AlamarBlue. TF-1 cells were plated at a density of 1 × 10⁴ cells/well in 96-well culture plates and incubated with 20 μL of AlamarBlue for 4 h. The fluorescence was detected with excitation wavelength at 530 nm and emission wavelength at 590 nm (n = 3). Relative cell survival = [(fluorescence with TGF-β1)/(fluorescence without TGF-β1) × 100]. TGF, transforming growth factor.
Induction of MMP-2 with TGF-β1
MCF10A cells were treated with 10, 100, 1,000, or 10,000 pg/mL of TGF-β1 for 48 h. The activity of MMP-2 induced by TGF-β1 was measured using a gelatin zymogram assay. The experiments were repeated 3 times. Band densities were measured using Genetool program in Image Analyzer and displayed as quantities relative to control band densities. The activity of MMP-2 was increased in a dose-dependent manner. As the TGF-β1 concentration was increased, the amount of induced MMP-2 was also increased (Fig. 4).
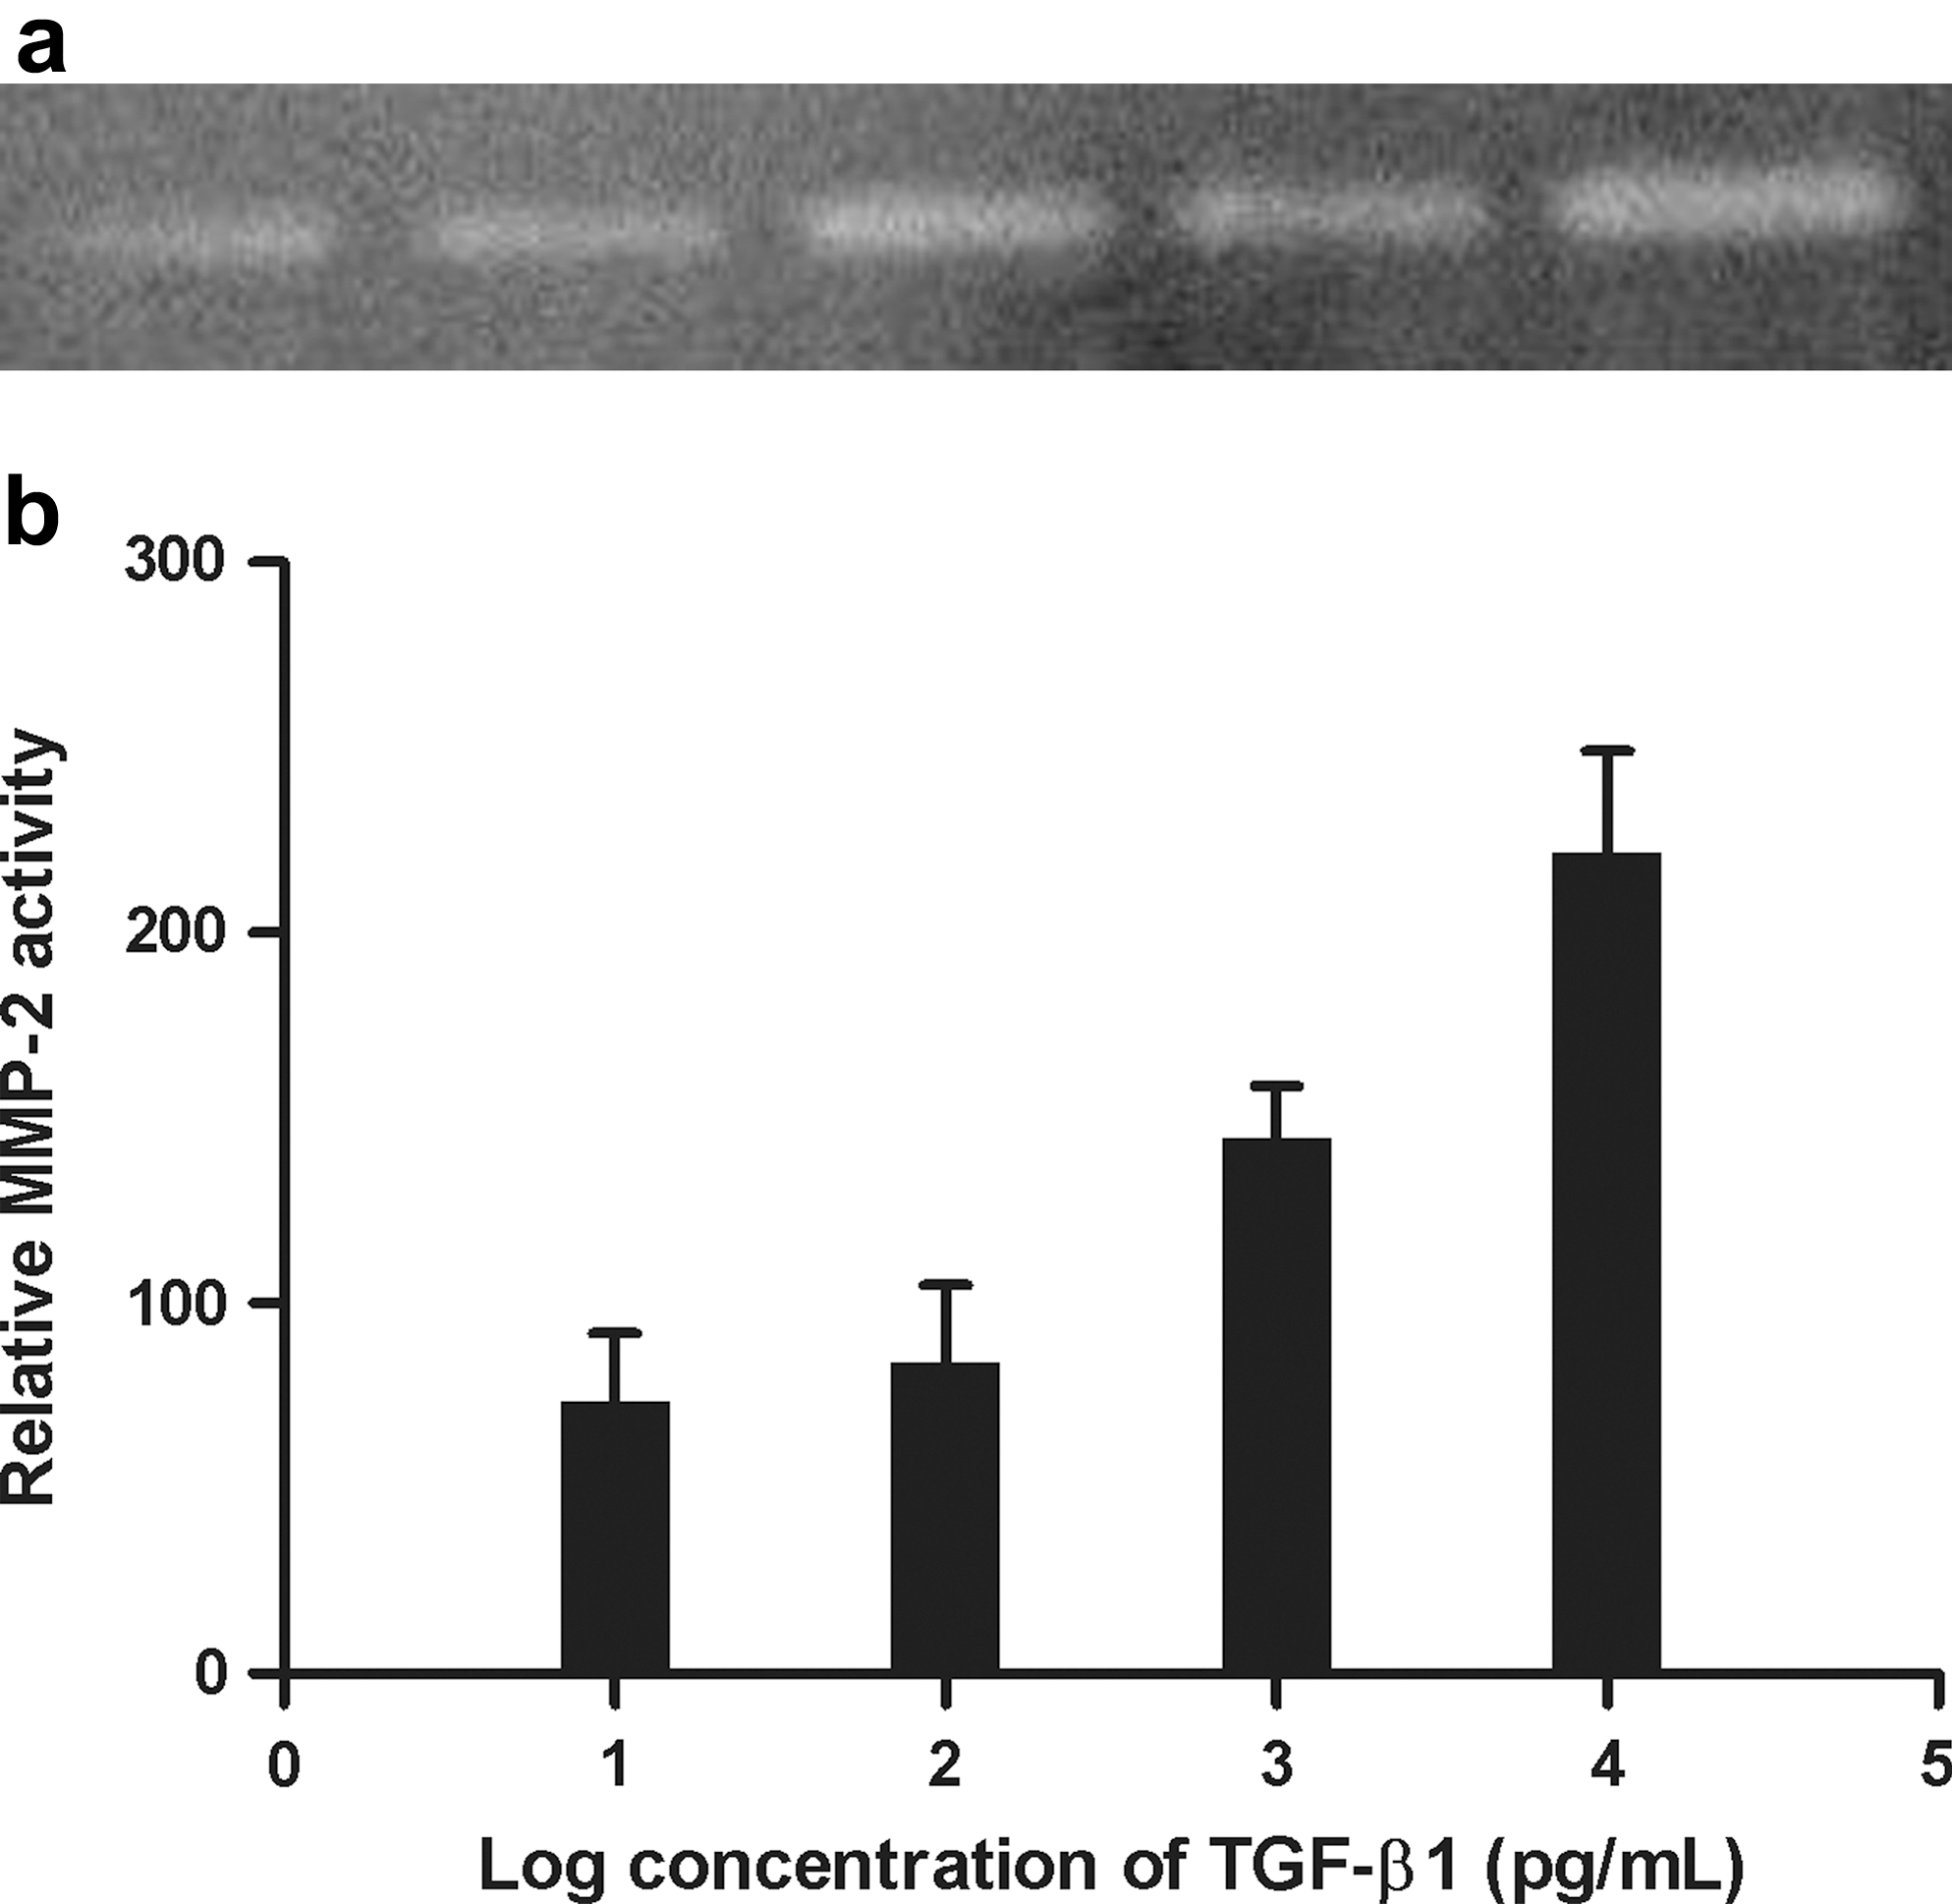
MMP-2 activity of MCF10A cells by treatment with various concentrations of TGF-b1. (
Comparison between TGF-β1 bioassays
The validation parameters of the assays were compared. The precision between the plates of the bioassay of induction of MMP-2 expression and that of anticell proliferation assay of TF-1 cells was about 10%. The precision within plates of MMP-2 expression assay was about 7.5%, whereas that of TF-1 cell assay was about 16% (Table 2). The regression coefficient for the linearity of MMP-2 expression assay was about 0.9502 at the range from 78 to 2,500 pg/mL, whereas that of TF-1 cell assay was about 0.9720 at the range from 78 to 1,250 pg/mL (Tables 1 and 2).
Abbreviations: TGF-β1, transforming growth factor-β1; MMP-2, matrix metalloproteinase-2; RSD, relative standard deviation.
The zymogram assay has an advantage of measuring MMP-2 activity directly, but cannot measure MMP-2 activity repeatedly and accurately. The zymogram assay measures the accumulated MMP-2 activity. MCF10A cells transfected with MMP-2 promoter have great advantages for measuring induced MMP-2 amounts accurately and precisely and for measuring specific gene expression. The cell survival assay can measure directly the inhibition of cell proliferation by TGF-β1, but cannot measure specific gene expression.
Three kinds of TGF-β1 bioassays were compared (Table 3). pGL4.20/MMP-2 TGF-β1 bioassay has the best precision and linearity among various TGF-β1 bioassays.
Abbreviations: MMP-2, matrix metalloproteinase-2; TGF, transforming growth factor.
Discussion
The TGF-β1 promoter assay developed in this study quantified MMP-2 induction at the level of transcriptional regulation by measuring induced luciferase activity. Effective TGF-β1 concentrations in the TGF-β promoter assay ranged from 78 to 2,500 pg/mL (Table 1). The effective TGF-β1 concentration range in the TF-1 cell survival assay was from 78 to 1,250 pg/mL (Table 1), but this assay showed a lower response and reproducibility than the MMP-2 promoter assay (Tables 2 and 3).
TGF-β1, TGF-β2, and TGF-β3 have structural similarities (Derynck and others 1985, 1988; Gail and others 2006). TGF-β induces MMP-2, and MMP-2 activates latent TGF-β (Wang and others 2006). TGF-β1, TGF-β2, and TGF-β3 have similar activities, but there are distinct differences in potency between the different TGF-β subtypes depending on the cell type and assay (Graycar and others 1989). To identify the role of TGF-βs regarding MMP-2 in MCF10A, MCF10A cells transfected with pGL4.20/MMP-2 were treated with various concentrations of TGF-βs. TGF-β1 induced about 2 times more MMP-2 than TGF-β2 and TGF-β3 (Figs. 1 and 2). This bioassay has a selective response to TGF-β1, suggesting that TGF-βs might have different abilities to induce MMP-2 activity in MCF10A cells.
In the TF-1 cell bioassay in a previous study, TGF-β was used to arrest cell proliferation induced by IL-5 (Randall and others 1993). But inconsistently with the result of their study, we did not observe any cell survival induction by IL-5. Hence, instead of the IL-5, GM-CSF was used in this study during the bioassay and the cell culture. In another article, GM-CSF was added to the cell culture medium and removed from the cell culture medium during the assay (Kitamura and others 1989). The principle of the TF-1 assay is to measure growth arrest. Because TF-1 cells do not divide under normal cell culture medium without growth factor, GM-CSF was used in the normal cell culture medium and in the bioassay medium. This is another TF-1 cell assay for TGF-β1. But the reproducibility was not as good as that of the pGL4.20/MMP promoter assay (Tables 2 and 3); hence, it is necessary to validate the assay. The cell survival assay can measure the unspecific TGF-β1 response directly, but cannot measure specific gene expression (Table 3).
The zymogram assay has an advantage of measuring MMP-2 content directly, but cannot measure it repeatedly or accurately. Zymogram assay showed lower reproducibility (about 40%) than MMP-2 promoter assay.
MCF10A cells transfected with the MMP-2 promoter has a great advantage of measuring accurately and precisely MMP-2 induction and measuring the expression of specific genes.
Footnotes
Acknowledgments
This work was supported by a grant (07101KFDA397) from the Korea Food and Drug Administration in 2007. Thanks to A. Rhee Moon for the MMP-2 promoter.
Disclaimer
The views presented in this article do not necessarily reflect those of the Korea Food and Drug Administration.
Author Disclosure Statement
No competing financial interests exist.