




Abstract
Breast tumor cells alter their microenvironment in part through the expression of protumor molecules that influence macrophages during tumor progression and metastasis. Macrophage recruitment is stimulated by chemotactic factors, including tumor necrosis factor alpha (TNF-α), which also stimulates the cytotoxic/tumor cell killing macrophage phenotype. Through TNF-α converting enzyme (TACE/ADAM17) activities, breast tumor cells shed membrane-bound proteins, including their TNF receptors (sTNFR1/2), which serve as decoys sequestering TNF-α and preventing TNF-α-driven apoptosis of tumor cells, thereby decreasing TNF-α bioavailability. Here we investigated the levels of sTNFRs shed by breast tumor cells and determined the effects of shed sTNFRs on macrophage migration toward TNF-α. TNF-α and sTNFRs concentrations were measured in murine normal epithelial, stromal, and mammary tumor cells. The migration of murine macrophages towards TNF-α in the presence of tumor derived soluble factors (TDSFs) shed by TACE was determined. TNF-α concentrations secreted by tumor and normal epithelial cells were below the detection limit contrasting with stromal cells, especially macrophages, which expressed higher levels of TNF-α (P<0.001). Regardless of the cell tested, treatment with the TACE inhibitor TAPI-0 led to a significant decrease in sTNFR2 shed (P<0.05). The dose-dependent macrophage migration toward TNF-α prevented by incubation with TDSFs was not observed with TDSFs collected following TAPI-0 treatment (P<0.05). Furthermore, the TNF-α-driven increased pAkt expression in macrophage was inhibited by TACE shed TDSFs (P<0.05). These results highlight the role of tumor-shed sTNFRs in TNF-α -driven macrophage chemotaxis.
Introduction
B
The breast tumor microenvironment consists of nonmalignant cells that infiltrate the developing tumor, including fibroblasts, adipocytes, endothelial cells, and immune cells, all of which may enhance cancer progression (Tlsty and Coussens 2006). Tumor associated macrophages (TAMs) account for a large fraction of the infiltrating immune cells within most breast tumor masses and their presence has been linked to poor prognosis (Kelly and others 1988; Lin and Pollard 2004). The phenotype of TAMs is similar to M2 macrophages, which are associated with wound-healing properties (Sica and others 2006). In contrast to M1 macrophages, which promote cytotoxicity, M2 macrophages through their cytokine and chemokine expression promote tumor growth and invasiveness (Mantovani and others 2005; Sica and others 2006). TAMs contribute to tumor progression and invasion through remodeling of the extracellular matrix, release of growth and angiogenic factors and suppression of antitumor immune responses (Lin and Pollard 2004; Condeelis and Pollard 2006).
At the tumor site, the macrophages are influenced by various physical and chemical interactions with the tumor and surrounding microenvironment. Some early inflammatory cytokines expressed in the tumor mass include tumor necrosis factor alpha (TNF-α) and colony stimulating factor 1 (CSF-1) (Hernandez and others 2009; Soria and others 2011). TNF-α is expressed by multiple cell types, including tumor cells, macrophages, and adipocytes (Meng and others 2001; Hagemann and others 2004; Tilg and Moschen 2006). The binding of TNF-α to either one of its receptors, TNF Receptor 1 (TNFR1) or TNFR2 promotes tumor cell apoptosis or survival, respectively, but also stimulates macrophage migration and secretion of proinflammatory molecules further promoting macrophage infiltration (Aggarwal 2003; Ben-Baruch 2003). The TNF-α binding to TNFR1 activates c-Jun N-terminal kinases (JNK) and c-Jun, whereas TNF-α binding to TNFR2 led to the activation of Akt in various cells, including macrophages (Al-Lamki and others 2005; Lim and others 2006). In particular, TNF-α promotes monocyte/macrophage invasion through positive chemotaxis and has been associated with increased metastasis (Meng and others 2001; Hagemann and others 2004). The TNF-α signaling pathway is modulated by various factors, including lipopolysaccharide, transforming growth factor β and interleukin 10 (IL-10) (Bogdan and Nathan 1993; Benveniste and others 1995). This pathway is also modulated by the bioavailability of both TNF-α and TNFRs within the tumor microenvironment. Indeed, cells through ectodomain shedding by TNF-α converting enzymes (TACE) release both TNF-α and soluble (sTNFRs), which can neutralize the response to shed TNF-α thereby, preventing TNF-α signaling (Terlizzese and others 1996). Increased expression of TACE in breast tumor cells is linked to poor prognosis (Kenny and Bissell 2007). Although the general mechanisms of the shedding of sTNFRs and TNF-α is well understood (Bell and others 2007; DasGupta and others 2009), the role of the TACE activity of breast tumor cells on the migration of macrophages has yet to be fully investigated.
Increased local and systemic concentrations of shed molecules, including TNFRs, CSF-1, and CSF-1R have been implicated in inflammatory/autoimmune diseases and some malignancies (Beck and others 2009; Dossus and others 2011). A link between serum concentrations of sTNFR in breast cancer patients and poor prognosis has not been demonstrated (Krajcik and others 2003), possibly because the serum sTNFR concentrations significantly differ from the sTNFR concentrations within the tumor (Alireza and others 2008). Indeed, in addition to sTNFRs expression that has primarily been assessed in immune cells (Dickensheets and others 1997; Reddy and others 2000), both adipocytes and breast tumor cells also shed sTNFRs and CSF-1 (Lin and others 2001; Beck and others 2009).
Whether sTNFRs shed by tumor cells through TACE activities modulate the chemotaxis of macrophages toward TNF-α is unknown. Here we investigated the chemotaxis toward TNF-α and signaling in the presence of tumor derived soluble factors (TDSFs) collected following treatments with or without a sheddase inhibitor. Results underline the role of sTNFRs in modulating macrophage chemotaxis.
Materials and Methods
Cell culture conditions
Murine mammary epithelial cells NMuMG, carcinoma cells 4T1, endothelial cells 2H11, and mesenchymal stem cells D1 were obtained from ATCC (Manassas, VA). Murine mammary cells 67NR and 4T07 were a generous gift from Dr. Miller (Karmanos Cancer Institute, Detroit, MI). Media supplies were obtained from Mediatech (Herndon, VA). Epithelial and endothelial cells were cultured at 37°C and 5% CO2 in DMEM media supplemented with 10% FBS, gentamycin, and amphotericin B. For NMuMG and D1 cells, media were also supplemented with 10 μg/mL of insulin and 4 mM glutamine (SigmaAldrich, St. Louis, MO), respectively. Adipocytes were derived from D1 cells following incubation with a differentiation treatment composed of 100 μg/mL insulin, 0.5 μM dexamethasone (SigmaAldrich), and 0 .5 mM isobutylmethylxanthine (SigmaAldrich) for 48 h (Maxson and Burg 2008). To block the shedding of TNFRs, 4T1 and NMuMG cells were treated with the TACE inhibitor TAPI-0 diluted in DMSO (250 nM; CalBiochem, Rockland, MA) for 24 h.
The macrophage J774.2 and RAW264.7 (here on referred to as J774 and RAW, respectively) cells were obtained from ATCC. These cells were cultured in DMEM supplemented with 10% FBS, 1.5 g/L NaCO3, 4.5 g/L glucose, 4 mM glutamine amphotericin B, and gentamycin (all reagents were obtained from Mediatech).
Collection of conditioned media
Conditioned media (CM) was obtained as described previously (Maxson and Burg 2008; Youn and others 2008). The collection time was optimized through a time curve and 48 h incubations were optimal. Briefly, epithelial (NMuMG, 4T1), endothelial (2H11), preadipocyte (D1), differentiated adipocyte, and monocyte (J774, RAW) cells were cultured in media described above at 37°C and 5% CO2. For tumor cells, CM contains tumor-derived soluble factors (TSDFs), and thus, TDSFs is used to refer to 4T1 CM. Once cells reached 90% confluence serum-free media with TACE inhibitor treatment (TAPI-0) or vehicle control (DMSO) was added for 24 h. Treatments were removed by washing twice with phosphate buffer saline (PBS) and cells were incubated in 7 mL RPMI media depleted of serum and phenol red. Following a 48 h incubation, the CM was collected, filtered (0.2 μm), and stored at −20°C. The volume of each conditioned medium was adjusted to 1 mL per 106 cells based on the number of cells present in the culture vessel as determined by Trypan blue cell counting at collection time.
Immunocytochemistry analyses
J774 and RAW cells (50,000 cells/well) were seeded in 8-well chamber slides and allowed to grow for 24 h until confluent. Cells were fixed with 4% paraformaldehyde (PFA) for 15 min at 37°C and blocked with 1% bovine serum albumin (BSA) for 30 min, and then incubated with either anti-TNFR1 or anti-TNFR2 antibodies for 1 h at room temperature. After washing, cells were incubated with a fluorophore (Texas red) - conjugated secondary anti-rabbit antibody for 1 h at room temperature. Cells were stained with the vital dye Hoechst and mounted with VectaShield (Burlingame, CA). The presence of either TNFR1 or TNFR2 was visualized using a IX71 fluorescent microscope (Olympus) and microphotographs were taken using similar conditions of fluorescence illumination for a given set of immune-stained samples and similar conditions of magnification (Size is denoted by a bar on microphotographs) using a DP70 camera (Olympus).
Transwell chemotaxis assays
J774 and RAW macrophage cells (60,000 cells/well) were seeded in serum-free media supplemented with the vital nuclear dye Hoechst (1:2000 dilution) in the top chamber of transwell migration chambers in 24 well plates. The lower chambers were filled with 500 μL (1:2 dilution) of either TDSFs collected after treatment with or without TAPI-0 (250 nM) in the presence or in the absence of TNF-α (0.5 ng-15 ng) or control media (0% FBS, 10% FBS for negative and positive controls, respectively). After 6 h, cells were removed from the upper side of the transwell membrane using a cotton swab and microphotographs of the cells attached to lower side of the membranes were taken (at least 5 random fields; 200× magnification), counted and the number of macrophages that migrated was normalized to the total transwell membrane surface area.
TNF-α and sTNFRs ELISAs
TNF-α and sTNFR levels were assessed using ELISAs conducted following the manufacturer's recommendations (R&D Systems, Minneapolis, IN) with all steps conducted at room temperature. Briefly, 96-well plates were coated with the capture antibody and incubated overnight. Following blocking with 1% BSA for 1 h, CM samples were added and the plates were incubated for 2 h. In the subsequent incubations, a biotin conjugated detection antibody and streptavadin-Horseradish Peroxidase (HRP) were added for 60 and 20 min, respectively. The presence of HRP-conjugated complexes was determined following the addition of the substrate solution (TMB, Pierce, Inc., Rockford, IL) and the enzymatic reaction stopped by the addition of H2SO4 (2N). Optical densities (450 nm) resulting from HRP activities were measured using a microplate reader (Biotek, Winooski, VT) and based on standard curves ran along with the samples, TNF-α and sTNFRs were expressed in pg/mL per 106 cells.
Western blots
Protein lysate immunoblotting was conducted as described earlier (Swamydas and others 2011). Briefly, 25 μg of total protein per well were loaded on 8% polyacrylamide gels and run in SDS-PAGE denaturing conditions and the proteins were then transferred onto nitrocellulose membranes. Loading of equal protein amounts was assessed by staining membrane with 0.1% Ponceau S (Sigma) in 5% acetic acid and further, assessed by evaluating the presence of β-actin by immunoblots. After a 1-h incubation with TBS-T (0.1% Tween 20) containing 5% nonfat milk to block nonspecific binding, membranes were incubated with antibodies specific for Akt and pAkt (Santa Cruz biotechnology, Santa Cruz, CA), pJNK and cJun (Cell signaling, Danvers, MA) or β-actin (SigmaAldrich, St Louis, MO). Following a 1-h incubation with the appropriate HRP-conjugated secondary antibody and the addition of a chemiluminescent substrate (Pierce, Rockford, IL), the presence of protein was detected using a biochemiluminescent imaging system and the VisionWork software (UVP, Upland, CA). Differences in protein expression were evaluated by densitometry using Quantity One software (Biorad, Hercules, CA) following normalization to β-actin expression.
Flow cytometry
Following cell collection using trypsin (epithelial cells) or scraping (macrophages), cells were fixed with 1% PFA for 30 min at room temperature and resuspended in PBS supplemented with 1% BSA. The presence of TNFR1 and TNFR2 surface receptors was determined by cell surface staining using antibodies specific for TNFR1 and TNFR2, respectively. Briefly, resuspended cells were incubated with either anti-TNFR1 or anti-TNFR2 antibodies (Santa Cruz Biotechnology) for 45 min at 4°C. Cells were then washed twice with PBS and incubated with appropriate FITC-conjugated secondary antibody (Invitrogen, Grand Island, NY). Control stain included the secondary antibody alone. Following additional washes, the presence of cell surface TNFR1 and TNFR2 was monitored by flow cytometry (Fortessa cytometer, Becton Dickinson, San Jose, CA). Analyses were conducted using the CellQuest software and graphical representation was obtained using FlowJo software (FlowJo, Ashland, OR). Data are presented as percentage of positive cells for either TNFR1 or TNFR2. The control corresponding to the background stain associated with the secondary antibody is displayed on each histogram.
Statistical analyses
All data were expressed as mean±SEM. Statistical analyses were conducted using one-way ANOVAs and Newmann-Keul post-hoc tests (Prism, Graphpad Software, Inc., La Jolla, CA). Significance was set a priori to P-value below 0.05. The correlation between concentration of TAPI-0 and sTNFR2 excretions was determined using a linear regression analysis of log transformed values.
Results
TNF-α is secreted by mammary stromal cells, in particular macrophages but not epithelial or tumor cells
First, we determined whether TNF-α, which is mainly produced by stromal cells, and often found at high levels in breast carcinomas, was secreted by the murine cells investigated here by ELISA in CM from each cell type. TNF-α was not detected (ND or below the detection limit) in the CMs collected from the noninvasive (67NR), nonmetastatic (4T07), and metastatic (4T1) murine mammary carcinoma cells or murine epithelial cells (NMuMG) (Fig. 1A). In contrast, TNF-α was present in the culture media of murine mesenchymal D1 stem cells, differentiated adipocytes and 2H11 endothelial cells (Fig. 1A). The J774 and RAW macrophage cells secreted between 10-fold and 40-fold higher concentrations of TNF-α than other stromal cells (P<0.001, Fig. 1B). Furthermore, the expression of TNF-α varied among the macrophage cells tested with much higher levels of TNF-α in the CMs collected from RAW cells (P<0.001).

Mammary stromal cells but not epithelial or tumor cells secrete tumor necrosis factor alpha (TNF-α). Conditioned media (CMs) were harvested following a 24-h serum starvation period and a 48-h incubation with phenol red free RPMI of the following murine cells:
TNFR1 and TNFR2 are expressed on the cell surface of macrophages and tumor cells
As TNF-α signaling is initiated through binding of TNF-α to one of its 2 cognate receptors TNFR1 or TNFR2 bound to the cell membrane, using immunocytochemistry (ICC), Western blots and flow cytometry, we investigated TNFR1 and TNFR2 expressions on murine macrophages. TNFRs were expressed by both J774 and RAW macrophages as assessed by ICC (data not shown), Western blots (data not shown) and flow cytometry (Fig. 2A, B). The tumor cells tested by flow cytometry expressed TNFRs regardless of their metastatic potential (Fig. 2A, B). Interestingly, whereas the expression of TNFR1 was comparable between the cells tested, the expression of TNFR2 was consistently higher in the metastatic 4T1 cells as compared to the noninvasive 67NR and nonmetastatic 4T07 cells (Fig. 2B).
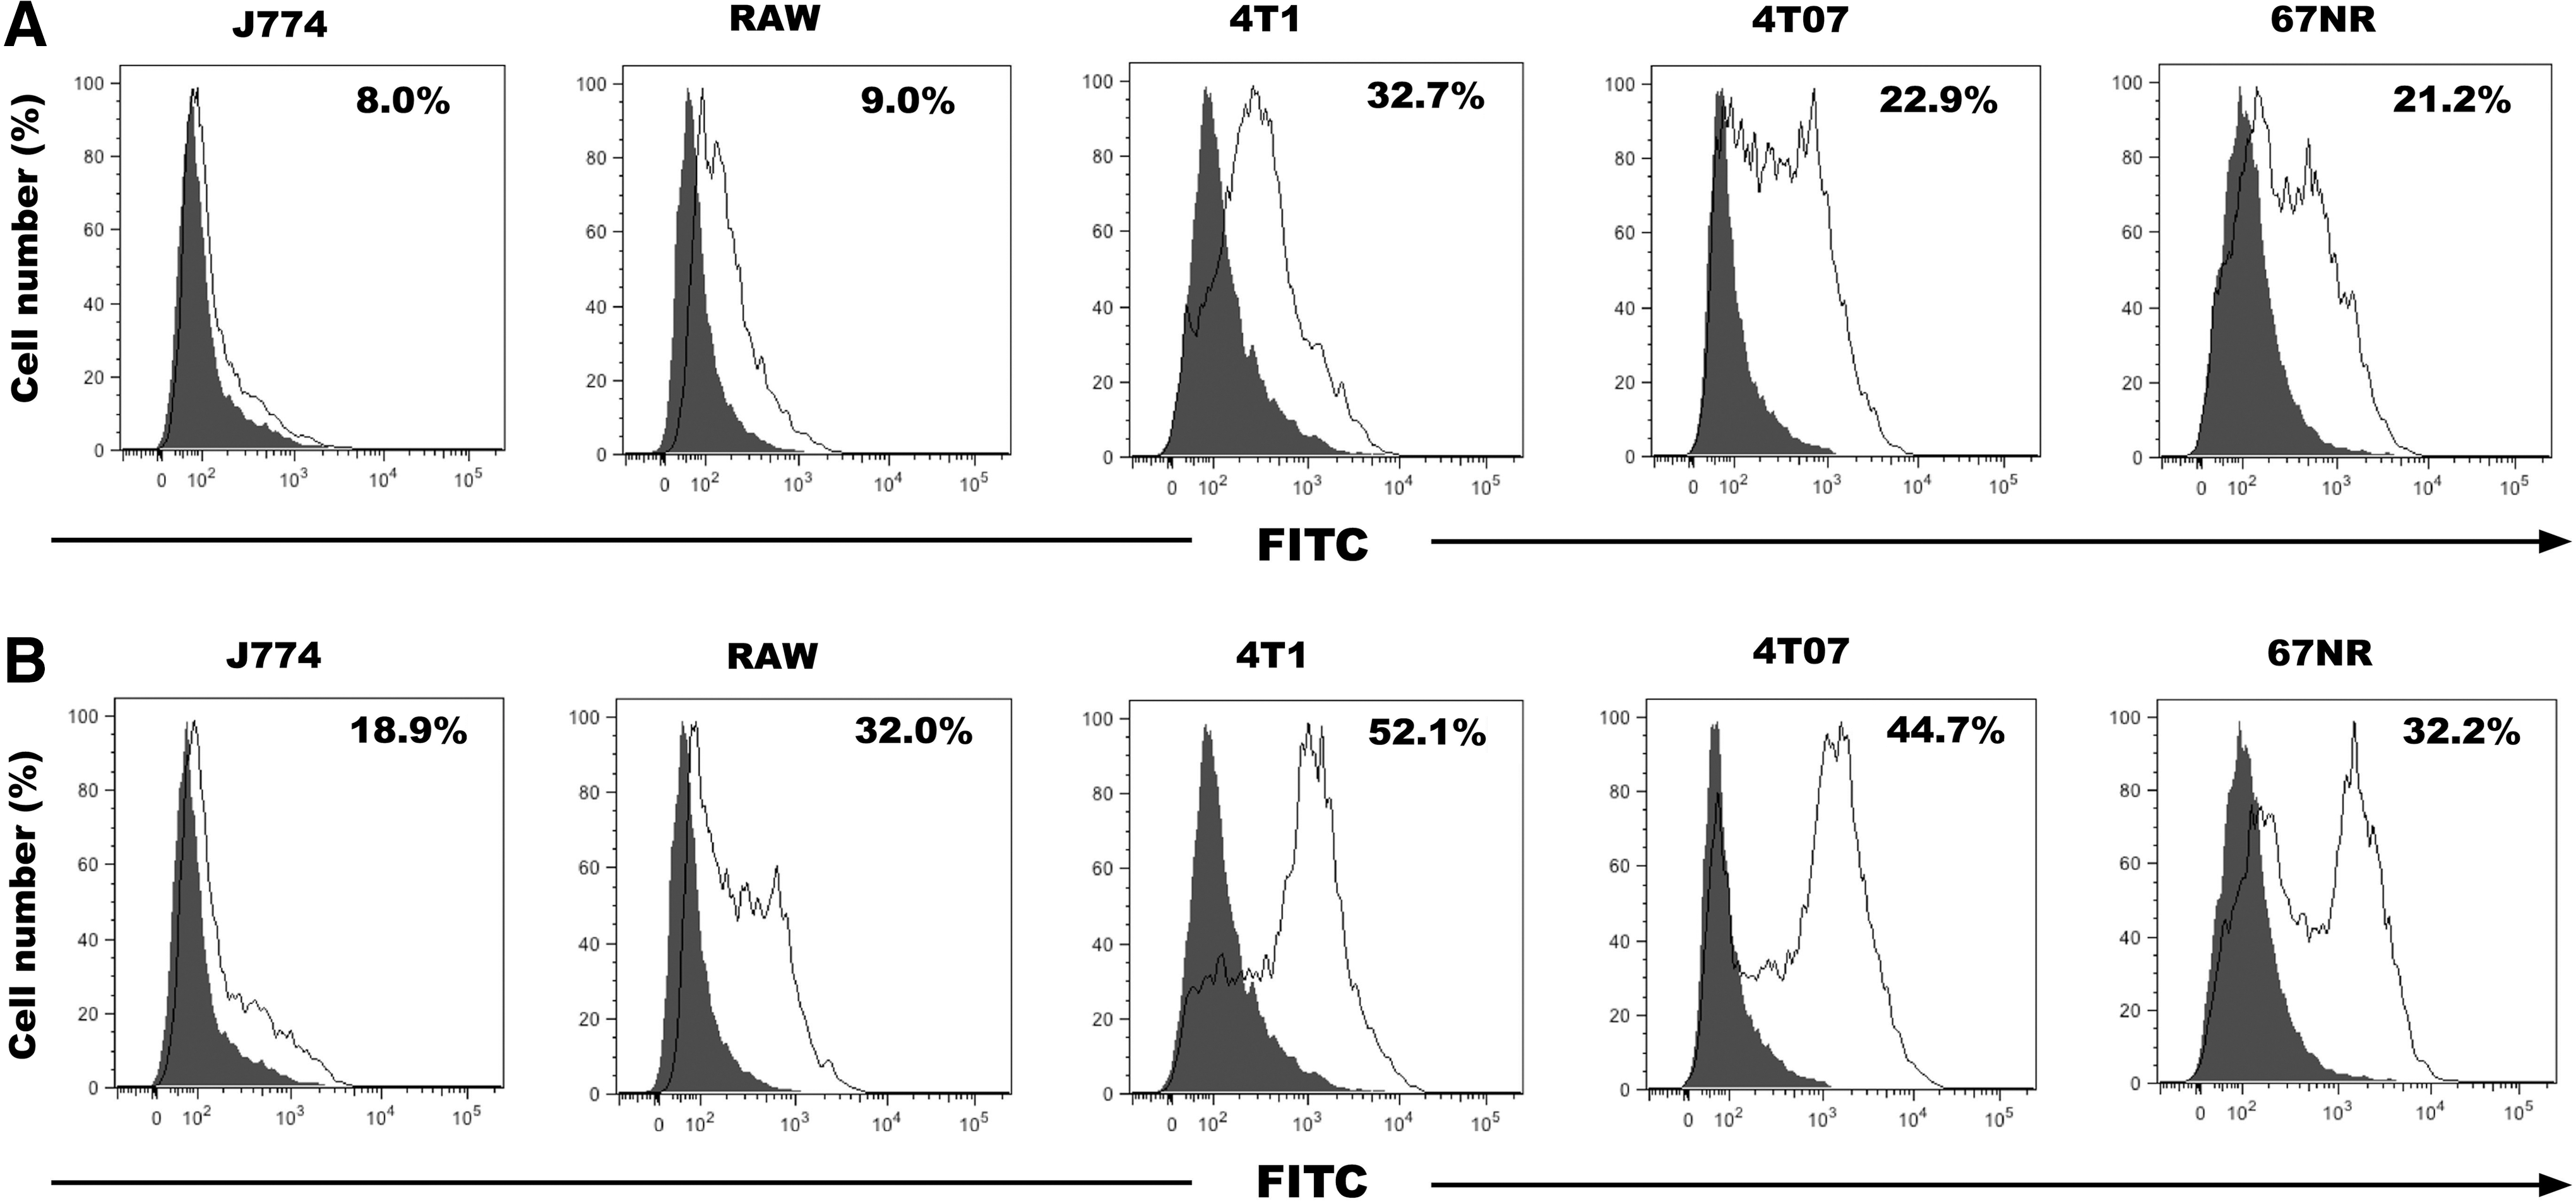
Both TNFR1 and TNFR2 are expressed by mammary tumor cells and macrophages.
sTNFR1 and sTNFR2 are shed by mammary epithelial and cancer cells and this shedding can be blocked through incubation with the TACE inhibitor TAPI-0
To determine whether TNFR1 and TNFR2 are shed through ectodomain shedding, the soluble forms of TNFR1 (sTNFR1) and TNFR2 (sTNFR2) were measured by ELISA in secretions from 4T1 and NMuMG cells. Both sTNFR1 and sTNFR2 were present in CMs from 4T1 and NMuMG cells with sTNFR1 concentrations similar between 4T1 and NMuMG cells (Fig. 3A). Concentrations of sTNFR2 in 4T1 CM were significantly higher than concentrations of sTNFR1 in 4T1 CM and sTNFR2 in NMuMG (5.6-fold and 1.8-fold, respectively, P<0.001, Fig. 3A).
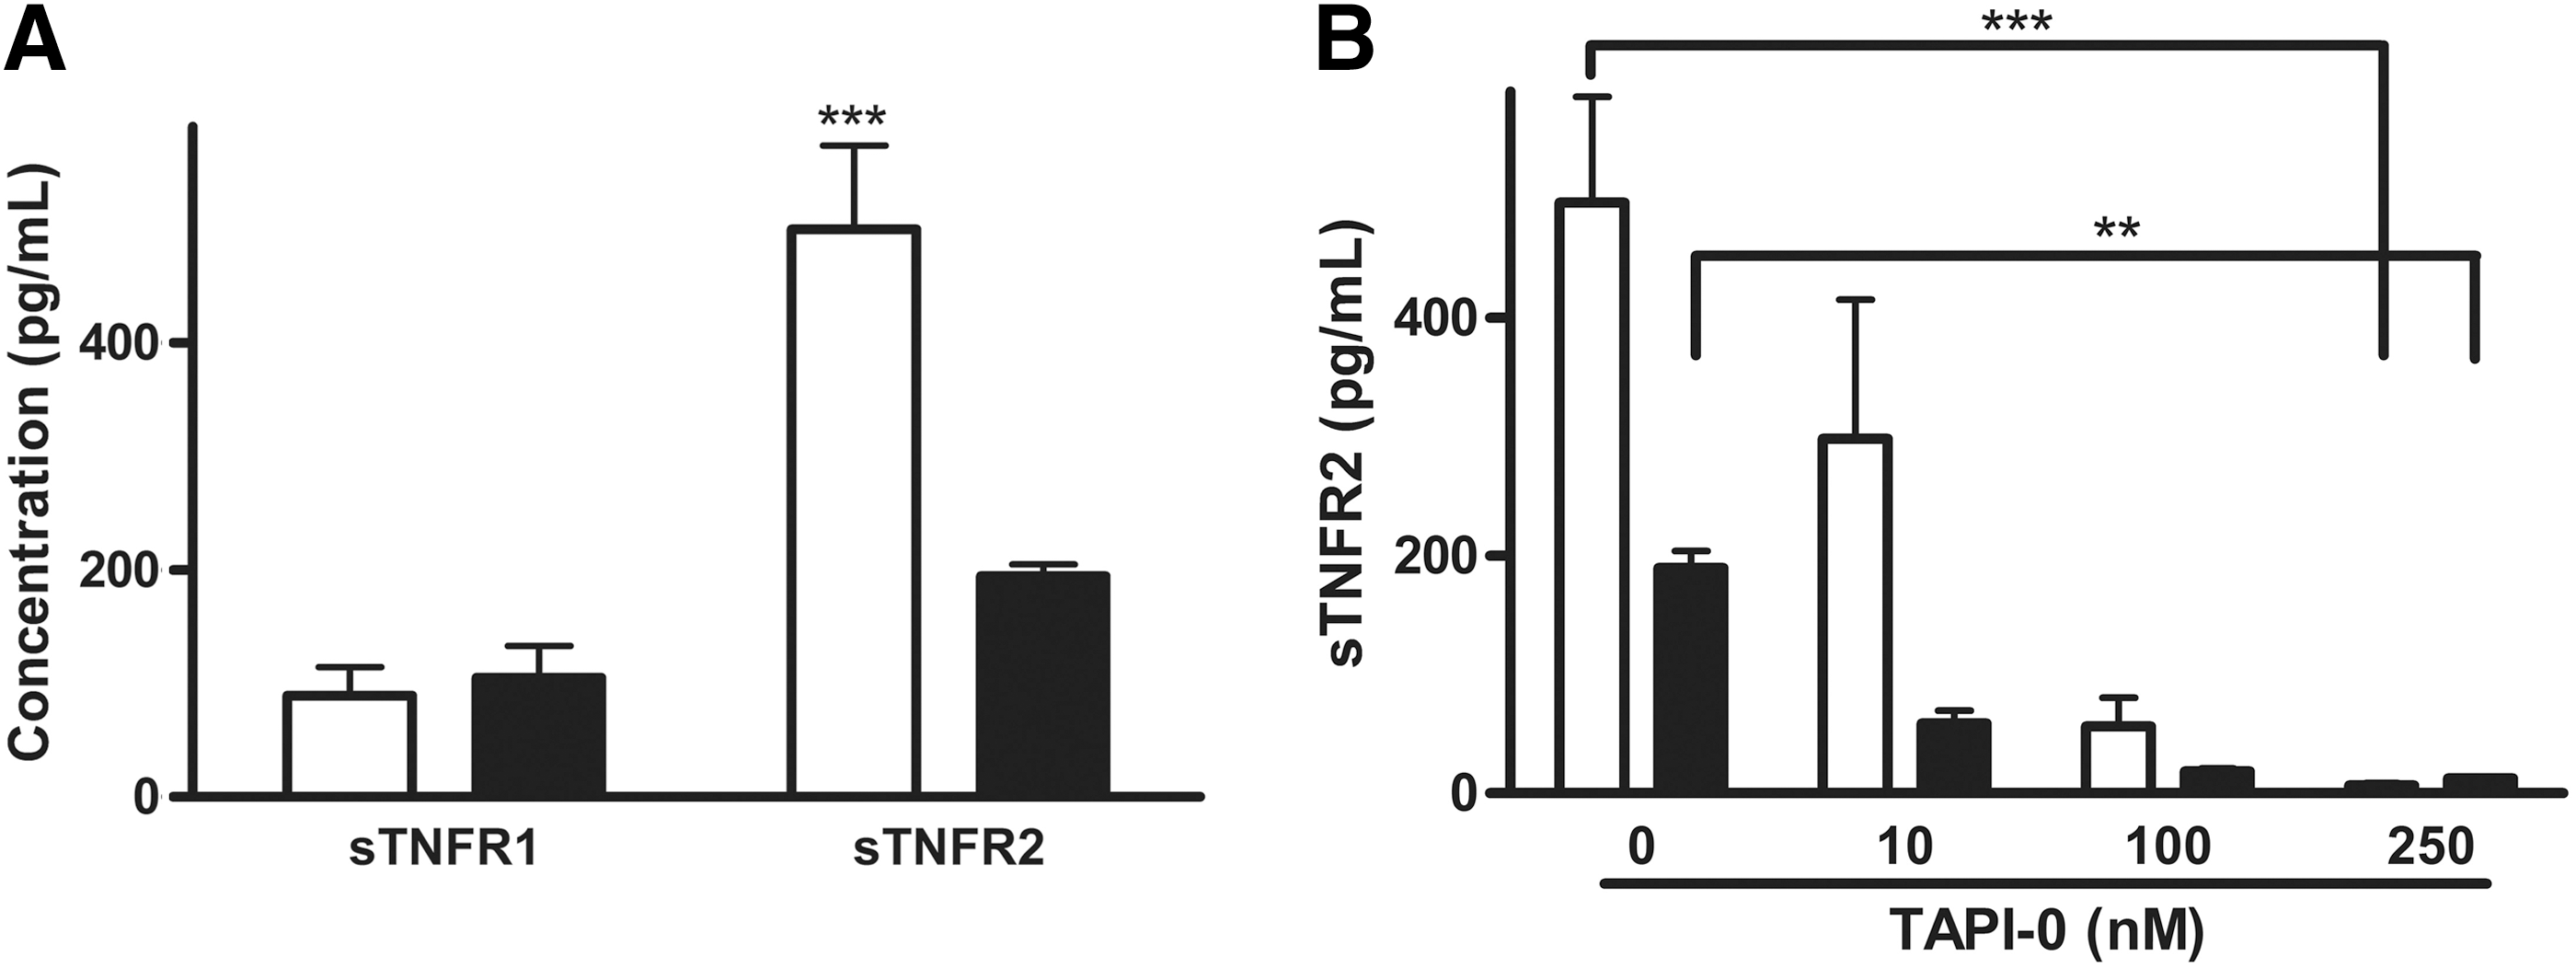
4T1 mammary tumor cells shed more sTNFR2 than sTNFR1 and treatment with the TNF-α converting enzymes (TACE) inhibitor TAPI-0 prevented sTNFR2 shedding.
The chemical inhibition of TACE through incubation with the TACE/ADAM-17 specific inhibitor TAPI-0 led to a dose-dependent decrease in sTNFR2 concentrations in 4T1 CM (r 2=0.9634, P=0.0185, Fig. 3B). Compared to vehicle treatment, the incubation with the TACE/ADAM-17 specific inhibitor TAPI-0 at 250 nM led to significant decreases in sTNFR2 concentrations in both NMuMG and 4T1 CMs (P<0.05, Fig. 3B).
TNF-α-driven macrophage chemotaxis is inhibited by 4T1 TDSFs but not by 4T1 TDSFs collected following treatment with the TACE inhibitor TAPI-0
Next we investigated whether sTNFRs present in 4T1 tumor CMs modulated TNF-α-driven macrophage chemotaxis, by sequestering TNF-α. Increasing concentrations of TNF-α led to a dose-dependent increase in the chemotaxis of J774 macrophages (Fig. 4A, B) and RAW macrophages (Fig. 4C, D). The addition of 4T1 CMs inhibited the chemotaxis of both J774 and RAW macrophages towards either 1.5 or 15 ng/mL concentrations of TNF-α (Fig. 4A–D).

TNF-α-driven macrophage chemotaxis is inhibited by factors in 4T1 TDSFs. J774
In contrast, the 4T1 CMs collected following treatment with the TACE/ADAM17 inhibitor, TAPI-0 and thus, containing lower sTNFR concentrations did not inhibit the TNF-α-driven macrophage chemotaxis (P<0.001, Fig. 5).

TACE-shed TDSFs decrease TNF-α-driven macrophage chemotaxis.
The TNF-α-driven macrophage chemotaxis is in part mediated through the Akt pathway and blocked by tumor TACE-shed molecules
To ascertain whether specific pathways downstream of TNF-α/TNFR signaling were involved in the observed alterations of macrophage chemotaxis led by 4T1 TDSFs, the Akt and JNK pathways were analyzed in both J774 and RAW macrophages following activation and inactivation by TDSFs of the TNF-α/TNFR signaling pathway. No significant differences were observed in total Akt, β-actin (n.s., Fig. 6A), or cJun and pJNK (data not shown) regardless of treatment. However, the ratio of pAkt/total Akt protein expression in J774 and RAW macrophages was significantly increased following incubation with increasing TNF-α concentrations (P<0.05, Fig. 6B, C). This increase in pAkt/total Akt was inhibited by concomitant 4T1 TDSFs and TNF-α treatments but not by concomitant treatments with TNF-α and 4T1 TDSFs collected following TAPI-0 treatment (P<0.05, Fig. 6A–C).

The expression of pAkt is increased in TNF-α-stimulated J774 and RAW macrophages incubated with 4T1 TDSFs collected following TAPI-0 treatment.
Discussion
The pleitropic cytokine TNF-α is expressed in breast cancer tissue and stimulates macrophage migration and activates cytotoxic macrophages (i.e., M1 macrophages); however, M1 macrophages are mostly absent within the breast tumor (Mace and others 1988; Taylor and others 2000; Meng and others 2001; Mantovani and others 2005). TNF-α has been shown to promote chemotaxis of macrophages in various pathologies; however, its role in macrophage trafficking to the breast tumor site is unclear (Taylor and others 2000; Ben-Baruch 2003; Grivennikov and others 2006). The primary mechanisms by which tumor cells alter macrophages include release of immunomodulatory factors (CSF1, CCL2, CCL5) leading to increased recruitment and stimulation of alternatively activated macrophages (i.e., M2) (Lin and others 2002; Ben-Baruch 2003; Soria and Ben-Baruch 2008). Importantly, the shedding activities of TACE/ADAM17, highly expressed by cancer cells (Kenny and Bissell 2007), leads to the release of TNFRs. However, the role of TACE activities and tumor shed TDSFs on TNF-α-driven macrophage chemotaxis remains to be addressed. Furthermore, whether the observed TNF-α-driven recruitment of macrophage to inflamed tissues is through either activation of TNFR1 or TNFR2, which stimulate the JNK and Akt signaling pathways, respectively, in breast cancer is unclear (Taylor and others 2000; Ben-Baruch 2003; Al-Lamki and others 2005; Grivennikov and others 2006). Our data show that stromal cells, including macrophages shown to be present in the breast tumor microenvironment secrete TNF-α (Ben-Baruch 2003). Furthermore, the results indicate that TNF-α-driven macrophage chemotaxis is dose-dependent. More interestingly, our data highlight a mechanism by which mammary tumor cells alter the response of macrophages to TNF-α by shedding their TNFRs through TACE activities leading to an inhibition of TNF-α-driven macrophage chemotaxis. In addition, our results suggest a role for the Akt pathway in the TNF-α-driven macrophage chemotaxis.
The in vitro models used here to investigate the TNF-α-TNFR signaling between tumor cells and macrophages have been utilized extensively to further our understanding of the protumor microenvironment (Green and others 2009; Hagemann and Lawrence 2009). Despite their limitations, in vitro 2D and 3D models of mammary tissues and breast cancer progression have proven invaluable in the assessment of the mammary microenvironment, including the cell-cell interactions between tumor and stroma cells (Green and others 2009; Hagemann and Lawrence 2009).
The results presented here confirm that the TNF-α pathway is active in the tumor microenvironment through TNF-α mainly secreted by stromal cells, including macrophages and by signaling via the membrane-bound TNFR1 and TNFR2 expressed on the macrophage cells (Miles and others 1994; Pusztai and others 1994). TNF-α activates TNFR1 or TNFR2, the latter of which lacks a death domain, leading to either cell death or cell survival, respectively (Rothe and others 1994; Hsu and others 1995; Sprowl and others 2012). In line with a previous study (Pusztai and others 1994), we show TNFR1 and TNFR2 are expressed by both malignant and stromal cells in the breast tumor, including macrophages. Interestingly, here we further demonstrate TNFR2 levels are relatively higher in the metastatic tumor cells (4T1) as compared to nonmetastatic tumor cells (4T07 and 67NR) and macrophages (J774 and RAW) (Fig. 2B).
The increased expression of TNFR2 may be one of the mechanisms by which breast tumor cells subvert apoptosis and promote their survival, as observed in colon cancer (Hamilton and others 2011). Alternatively, the proapoptotic effects of TNF-α/TNFR signaling are diminished through the sequestration of TNF-α by soluble forms of TNFR1 and TNFR2 (Higuchi and Aggarwal 1992). Our data highlight the shedding of TNFR especially TNFR2 through TACE/ADAM17 activities. The increase in sTNFR2 shed by tumor cells observed here may be associated with a higher cell surface expression and/or a preferential shedding of TNFR2 by TACE/ADAM17. In addition, increased internalization of the receptors by normal cells may also be involved (D'Alessio and others 2005).
TNF-α is present in the breast tumor microenvironment; however, its stimulation of tumor cell apoptosis has been shown to be prevented by tumor cells shedding TNFRs (Higuchi and Aggarwal 1992). Macrophages also respond to TNF-α concentrations present in the breast tumor microenvironment through both paracrine and autocrine signaling leading to prolonged inflammation caused by a positive feedback loop with TNF-α (Wang and others 2006). The effects of TNF-α on macrophage migration have been seldom studied in breast tumors. Our data indicate that tumor cells through the shedding of TNFR2 significantly inhibit the macrophage chemotaxis toward TNF-α in part through inhibition of the Akt pathway. The inhibition of the TNF-α stimulated Akt pathway downstream of TNFR2, but not of the JNK/c-Jun pathway, in macrophages by TACE-shed TDSFs strongly support the modulation of the infiltration and cytotoxic activities of the macrophage subsets within the tumor microenvironment. The inhibition of the TNF-α-driven macrophage chemotaxis by tumor CM and especially by TACE tumor-shed molecules highlight the importance of this mechanism. Furthermore, although the data presented do not address directly the macrophage infiltration of the tumor mass, the strong modulation of the macrophage chemotaxis and invasion observed here may interfere with the recruitment and or differentiation of cytotoxic macrophages within the tumor mass (Taylor and others 2000; Ben-Baruch 2003).
Our observations, that sTNFRs shed by tumor cell TACE activity negatively impact the ability of TNF-α to stimulate macrophage chemotaxis further underscore the protumor role of TACE/ADAM17 (Kenny and Bissell 2007; McGowan and others 2008). Our results (not shown) and others demonstrate the presence the activities of TACE in all the epithelial and tumor cell tested (Kenny and Bissell 2007). Tumor cell TACE activities shed many growth factors and immunomodulatory cytokines that play key roles in tumor progression (Gooz 2010). Indeed, TACE inhibitors are currently in phase II clinical trials for a subset of metastatic breast cancer patients (Infante and others 2007; Newton and others 2010). To date, clinical trials using TACE inhibitors have been unsuccessful partly because of the lack of specificity exhibited by inhibitors tested (Arribas and Esselens 2009; Gooz 2010). The data presented here suggest that the testing of more specific inhibitors may be more successful. Furthermore, the targeting of sTNFRs especially sTNFR2 may also modulate both the infiltration of cytotoxic macrophages and/or the activation of cytotoxic macrophages within the breast tumor microenvironment that in turn may promote tumor regression.
Taken together, our findings along with previous studies support a mechanism by which mammary tumor cells abrogate the TNF-α signaling response in macrophages by shedding their TNFRs through TACE enzyme activities. This pathway offers many potential targets to promote the cytotoxicity of macrophages in the breast tumor beyond the direct actions on TNF-α or TACE activities, including interferences with the breast tumor concentrations of sTNFR1 and sTNFR2, respectively. Further validation of these observations may provide new avenues with more targeted approaches promoting the stimulation of the patient's own immune system especially macrophages leading to the therapeutic benefit of the destruction of breast tumor cells.
Footnotes
Acknowledgments
The authors would like to thank Drs. Danielle Van and Michelle Coleman for their help and critical review of the manuscript, respectively. This work was supported by grants from the Department of Defense (Era of Hope program # BC044778) and the National Science Foundation (EFRI program # CBE0736007).
Author Disclosure Statement
The authors report no conflict of interest.