




Abstract
The hepatitis B virus (HBV) infection-induced chronic inflammation is considered to be the major etiological factor for HBV-related disease chronicity. Cytokines act as the key coordinators of the inflammatory responses involved in HBV disease pathogenesis. The present study assessed association among IL-12B(+1188), IL-2(−330), TGF-β1(−509), and IL-4(−590) genotypes; mRNA; and protein levels with HBV-hepatocellular carcinoma (HCC) risk in India. For this, 403 subjects (153 controls, 67 inactive HBV-carriers, 62 chronic-active HBV patients, 62 HBV-cirrhotics, and 59 HBV-HCC ssubjects) were enrolled in the study. The genotyping was carried by polymerase chain reaction (PCR)-restriction fragment length polymorphism (IL-12+1188A/C, IL-2−330T/G, and TGF-β1−509C/T), and allele specific (AS)-polymerase chain reaction (IL-4−590C/T). Enzyme-linked immunosorbent assay and reverse transcriptase–polymerase chain reaction methods were used for assessing protein and the mRNA expression, respectively, of the mentioned cytokines. The study revealed that the IL-12B(+1188) CC genotype shared a significant positive association with hepatitis, among controls. While, in the case of IL-2(−330), both the TG and GG genotypes were not significantly associated with HCC risk. The TGF-β1(−509) TT genotype acted as a potential protective factor for cirrhosis and the HCC risk, among carriers. On the contrary, the IL-4(−590) CT genotype was found to be a vital protective factor for the development of hepatitis, among carriers. Besides, IL-12B, TGF-β1, and IL-2 seem to be majorly involved in the development of HCC, while, IL-4 might be responsible for the progression of the HBV disease till cirrhosis development. These initial findings are indicative of the vital role of genotypes and/or levels of IL-12B, IL-2, IL-4, and TGF-β1 in HBV disease chronicity in Indian population.
Introduction
H
IL-12 is an important Th1 proinflammatory cytokine, mainly produced by the antigen-presenting cells. It causes activation of NK and T cells, resulting in induction of cytokines, importantly interferon-gamma (IFN-γ) and imparts resistance to tumors, by promoting Th1 adaptive immunity and cytotoxic T lymphocyte responses. Several molecular epidemiologic studies have stated the functional importance of SNP at +1188(A/C) in the 3′UTR of the IL-12B in immune-mediated diseases and cancer risk. A study conducted showed significantly increased cervical cancer risk in women with IL-12B variant genotypes (AC/CC) (Chen and others 2009). However, 2 separate studies done in the Chinese population where the 3′UTR +1188 CC and AC genotypes of IL-12B were not found to be significantly associated with HBV-induced HCC (Nieters and others 2005; Liu and others 2011). This SNP (+1188A>C at the 3′UTR) of IL-12B has been correlated with increased in vitro IL-12 secretion (Seegers and others 2002) and susceptibility to infectious diseases (Morahan and others 2002; Zafra and others 2007).
IL-2 is a proinflammatory cytokine derived from Th1 cells, mainly required for host antiviral immune response and is principally involved in the cell-mediated immunity. Since the −330 promoter region polymorphism has 2 common alleles, it acts as an ideal marker for genetic association studies. The IL-2(−330T>G) polymorphism did not appear to modify HBV-HCC risk in the Chinese and American populations (Nieters and others 2005; Ognjanovic and others 2009). However, IL-2−330 TT genotype was found to be associated with an increased chronic hepatitis risk, in case of HBV/hepatitis C virus (HCV) or HBV-HCV coinfection in a study by Gao and others (2009). A study conducted in the Italian population revealed markedly elevated (P<0.01) plasma IL-2 levels in chronic hepatitis B patients (Falasca and others 2006).
Transforming growth factor-β1 (TGF-β1) is regarded as a multifunctional, immunosuppressive non Th1/Th2 cytokine, which acts a potent growth inhibitor involved in wound healing and differentiation. To date, it has been well documented that the C-509T polymorphism in TGF-β1 promoter is associated with circulating levels of this cytokine. A study reported significantly lowered HCC risk in hepatitis B patients with TT genotypes, than in those with CC genotype (Qi and others 2009). Serum TGF-β1 levels were also found to be potentially elevated (P<0.01) in the hepatitis B group in a study by Akpolat and others (2005).
IL-4 is a central anti-inflammatory Th2 cytokine, which counteracts the IFN-mediated Th1 differentiation and stability. It has a major role in viral persistence as it along with IL-10 inhibits the cytokine production by Th1 cells. Moreover, it has been described that the IL-4−590 T compared with the −590 C allele increases the strength of the IL-4 promoter, which leads to high production of IL-4. A study reported, IL-4(−590) CT and CC genotype frequencies to be significantly higher in chronic hepatitis B patients with abnormal alanine aminotransferase (ALT) levels, thereby associating them with liver inflammatory injury (Gao and others 2009). Studies by Akpolat and others (2005) and Falasca and others (2006), similarly reported significantly raised IL-4 levels (P<0.05 and P<0.001, respectively) in HBV-infected patients, compared with controls.
Further, despite some isolated reports, no comprehensive study on the genotypes and expression of IL-12B, IL-2, TGF-β1, and IL-4 in various stages of HBV disease is available in literature. Moreover, not even a single study is available concerning IL-12B(+1188 3′UTR A>C), IL-2(−330T>G), TGF-β1(−509C>T), and IL-4(−590C>T) polymorphism and expression in HBV-HCC disease susceptibility in India. Therefore, a cross-sectional study was designed to correlate the polymorphism, protein, and mRNA expression of these cytokines, during various phases of HBV disease.
Materials and Methods
Many of these methods have been described before, in our previous study (Saxena and others 2013).
Subjects
A total of 403 subjects were enrolled in this study.
Group 1 included 153 healthy subjects showing no clinical signs and symptoms to suggest any form of disease and underwent HBsAg screening, and so they were designated as the control group. The subjects of this group were the relatives or the attendants of the patients attending the Hepatology OPD at Postgraduate Institute of Medical Education and Research. Group 2 was comprised of 67 inactive HBV-carriers HBsAg positive for a period of 6 months or more but with normal levels of transaminases, were HBeAg negative or anti-HBe positive, had serum HBV DNA less than 105 copies/mL, and no clinical symptoms of liver disease along with no radiological evidence of cirrhosis or varices on endoscopy. Group 3 consisted of 62 chronic-active HBV patients characterized as HBsAg positive for a period of 6 months or more along with raised transaminases >1.5×ULN, had serum HBV DNA more than 105 copies/mL and imaging techniques showing no evidence of cirrhosis or no varices on endoscopy. Group 4 included 62 HBV-related cirrhotics who were HBsAg positive for a period of 6 months or more along with raised transaminases >1.5×ULN, had serum HBV DNA more than 105 copies/mL and imaging techniques showing evidence of cirrhosis or varices on endoscopy and ascites is detectable by ultrasound. Group 5 included 59 HBV-HCC subjects characterized by concomitant finding of 2 imaging techniques showing nodule larger than 2 cm with arterial hypervascularization or by one positive imaging technique showing hypervascularization associated with α-fetoprotein levels higher than 400 ng/mL (Zhou and others 2006). Also, the serum HBV DNA was more than 105 copies/mL. Groups 2, 3, 4, and 5 comprised of subjects attending the Hepatology OPD at Postgraduate Institute of Medical Education and Research.
The protocol of the study was approved by the Institute's Ethics Committee. Informed consent was obtained from all the subjects involved in the study. Six milliliters of venous blood was collected from all the subjects.
DNA isolation
High-molecular-weight genomic DNA was isolated from the peripheral blood samples using the standard sodium perchlorate method (Daly and others 1996) and was suspended in TE buffer (pH 8.0; 10 mM Tris and 1 mM ethylenediaminetetraaceticacid) and finally used for IL-12(+1188A/C), IL-2(−330T/G), TGF-β1(−509C/T), and IL-4(−590C/T) genotyping.
Genotyping of IL-12B(+1188)
The analysis of IL-12B(+1188A>C; rs3212227) polymorphism was done by polymerase chain reaction–restriction fragment length polymorphism (PCR-RFLP) based method as described by Nieters and others (2005). The following primers were used: IL-12B forward primer: 5′-TTCTATCTGATTTGCTTT-3′ and IL-12B reverse primer: 5′-TGAAACATTCCATACATCC-3′. Briefly, the PCR reactions were carried out in 10 μL volume consisting of 100 ng genomic DNA, 1×PCR buffer, 3.5 mM MgCl2, 0.6 U Taq DNA polymerase, 1 μM primers, and 200 μM each dNTP. The PCR conditions consisted of initial denaturation at 94°C for 2 min, 35 amplification cycles with denaturation at 94°C for 1 min, annealing at 45°C for 1 min, and elongation at 72°C for 1 min. Final extension was carried out at 72°C for 10 min. The PCR-amplified product was electrophoresed on a 2% agarose gel. Each set of reaction included an internal (β-actin), positive and negative controls.
Genotyping of IL-2(−330)
The protocol standardized for the amplification of IL-2(−330T>G; rs2069762) included a 8 μL reaction mixture consisting of 1×PCR buffer (50 mM KCl; 20 mM Tris HCl, pH 8.4), 2.5 mM MgCl2, 200 μM each dNTP, 1 μg/mL of both forward and reverse primers, 50 ng genomic DNA, and 0.6 U Taq DNA polymerase. Initial denaturation was carried out at 95°C for 2 min. This was followed by 35 cycles of denaturation at 94°C for 1 min, annealing at 54°C for 1 min, and synthesis at 72°C for 1 min. Final elongation was carried out at 72°C for 10 min. Primer sequences, as described by Gao and others (2009), were as follows: IL-2(−330) forward primer: 5′-TATTCACATGTTCAGTGTAGTTCT-3′, IL-2(−330) reverse primer: 5′-ACATTAGCCCACACTTAGGT-3′. Each set of reaction included an internal (β-actin), positive and negative controls.
Genotyping of TGF-β1(−509)
A standardized PCR-RFLP based method (Kim and others 2003) was done for analyzing the TGF-β1(−509C>T; rs1800469) polymorphism. The primers used for the analysis were as follows: TGF-β1(−509) forward primer: 5′-CAGTAAATGTATGGGGTCGCAG-3′ and TGF-β1(−509) reverse primer: 5′-GGTGTCAGTGGGAGGAGGG-3′. The analysis was done in 10 μL of PCR reaction mixture, consisting of 100 ng genomic DNA, 1×PCR buffer, 3.5 Mm MgCl2, 0.6 U Taq DNA polymerase, 0.5 μM primers, and 200 μM each dNTP. The PCR conditions consisted of initial denaturation at 95°C for 3 min, 40 amplification cycles with denaturation at 94°C for 1 min, annealing at 66.6°C for 1 min and elongation at 72°C for 1 min. Final extension was carried out at 72°C for 10 min. The PCR amplified product was electrophoresed on a 2% agarose gel. Each set of reaction included an internal (β-actin), positive and negative controls.
Genotyping of IL-4(−590)
Allele specific (AS)-polymerase chain reaction-based method (Lin and Karin 2007) was done for analyzing the IL-4(−590C>T; rs2243250) polymorphism. The primers used for the analysis were as follows: Generic primer (antisense): 5′-CACTTGGGGCCAATCAGCA-3′, PrimerC (sense):5′-CTAAACTTGGGAGAACATTGTC-3′ and Primer T (sense):5′-CTAAACTTGGGAGAACATTGTT-3′. The PCR reactions were carried out in 8 μL volume consisting of 50 ng genomic DNA, 1× PCR buffer, 0.6 U Taq DNA polymerase, 0.25 μM each sequence specific primer, 0.5 μM each internal control (β-actin) primer, 2.5 mM MgCl2, and 200 μM each dNTP per tube. The PCR conditions were as follows: 95°C for 2 min; 15 cycles of 95°C for 25 s, 61°C for 50 s, 72°C for 40 s; 25 cycles of 95°C for 30 s, 60°C for 50 s, 72°C for 50 s; with a final extension of 10 min at 72°C in the last cycle. PCR amplification resulted in a 452 bp (IL-4) and 350 bp (β-actin) products, when visualized on 2% agarose gel. Each set of reaction included positive and negative controls.
RFLP analysis of IL-12B, IL-2, TGF-β1, and IL-4
To assess IL-12B(+1188 A→C) 3′UTR, IL-2(−330 T→G) and TGF-β1(−509 C→T) genotyping, their PCR products were respectively digested with 2 U of Taq1 (65°C), 2 U of BfaI endonuclease (37°C), and 1 U of Bsu36I (37°C) respectively, for 12–16 h and then electrophoresed on 3% (IL-12B, IL-2) and 2% (TGF-β1) agarose gel.
Measurement of cytokine levels in peripheral blood mononuclear cells
Peripheral venous blood was collected in sterile heparinized tubes and peripheral blood mononuclear cells (PBMCs) were isolated by using the standard Histopaque (Sigma) density gradient centrifugation method (Boyum 1984). Their viability was assessed by trypan dye exclusion test and were later stored at −80°C. PBMCs were lysed in phosphate-buffered saline through repeated freeze-thaw cycles before the determination of the cytokine levels (105 cells/well) using enzyme-linked immunosorbent assay kit (BD OptEIA™ Set Human; BD Biosciences Pharmingen). Sensitivity of the kit was 31.3 pg/mL (IL-12B), 7.8 pg/mL (IL-2), 125 pg/mL (TGF-β1), and 7.8 pg/mL (IL-4).
Reverse transcriptase–polymerase chain reaction analysis
Total RNA was isolated from PBMCs (2×10⁵ cells) by using HiPurA™ Total RNA Miniprep Purification Spin kit (HiMedia Laboratories Pvt. Ltd.) and cDNA synthesis was carried out from the purified and intact total RNA (100 ng) according to manufacturer's instructions (RevertAid™ First Strand cDNA Synthesis Kit; MBI Fermentas). Expression of TGF-β1 and β-actin was evaluated by conventional PCR analysis by using sequence specific primers. Ten microliter PCR mixture was prepared in 1×PCR buffer consisting of 1 U of Taq polymerase, 1 μM of each primer along with 200 μM of each dNTP. In optimized PCR, the initial denaturation step was carried out for 2 min at 95°C. The denaturation, annealing, and elongation steps were carried out respectively for 45 s at 94°C, 45 s at 66°C (TGF-β1), or 60°C (β-actin) and 1 min at 72°C for 40 cycles. The final extension step was carried out for 10 min at 72°C. IL-12B, IL-2, and IL-4 expressions were evaluated by real-time reverse transcriptase–polymerase chain reaction (RT-PCR) analysis by using sequence-specific primers. Ten microliter PCR mixture consisted of 5 μL of 1×Absolute QPCR SYBR Green Mix consisting of 3 mM MgCl2 and DNA polymerase, 4 μL reaction mixture consisting of 0.15 μM (IL-12B) and 0.3 μM (IL-4, IL-2) of both forward and reverse primers (Sigma-Aldrich Pvt. Ltd.), and water, to which 1 μL of cDNA was finally added. In optimized PCR, the initial denaturation step was carried out for 2 min at 95°C. The PCR conditions used are as follows: initial denatuation for 15 min at 95°C, amplification (40 cycles): 30 s at 94°C, 30 s at 64°C (IL-12, IL-2, and IL-4) or 68°C (β-actin). Annealing (°C), synthesis: 20 s at 72°C, Melting(1 cycle): 1 s at 95°C, 1 min at 73°C/66°C, and continous melting at 95°C. The sequences of the primers (Primer3 Input v 0.4.0) used are discussed in Table 1.
IL, interleukin; TGF-β1, transforming growth factor-β1.
The expected PCR products of size 203, 227, 239, 152, and 318 bp were obtained for IL-12, IL-2, TGF-β1, IL-4, and β-actin (internal control) respectively, when electrophoresed on 2% agarose gel.
Statistical analysis
Genotype frequencies were calculated as the number of participants with a particular genotype divided by the total number of participants. Hardy–Weinberg equilibrium (HWE) was also tested. Only the genotypic distribution of TGF-β1 deviated from HWE test. Based on the genotype distribution data, power of the study was found to be 80% for IL-12B, 68% for IL-2, 98% for TGF-β1(−509), and 90% for IL-4(−590). The statistical significance was depicted by using Pearson P value. Association between genotypes/haplotypes with HCC risk was calculated as odds ratios (ORs) with 95% confidence intervals (CIs), and their statistical significance was determined by chi-square test using SPSS (v.15 for Windows) and PHASE v2.1 softwares respectively. Further, the adjustment of the OR with the confounding factors like age, sex, and/or biochemical parameters [bilirubin, total protein, albumin/globulin (A/G), aspartate aminotransferase (AST), ALT, and alkaline phosphatase (ALP)] was done by logistic regression analysis. The densitometric analysis was done by SCION Image Software. The non-parametric Kruskal–Wallis one way-analysis of variance and Student's t-test were used to determine the significance of differences in continuous variables using GraphPad Prism software, while multiple comparisons were done by Bonferroni test. Pearson's correlation analysis was used to estimate the correlations between different parameters. The association of independent variables with cytokine concentration was assessed by multiple regression analysis using SPSS software. A P value under 0.05 was considered statistically significant.
Results
On analyzing the demographic characteristics of the subject groups, the subjects diagnosed as HBV-HCC showed the highest mean (mean±standard deviation) and median age with respect to the other categories, showing that the HBV-HCC is a disease of later half of life. Moreover, an increased gender ratio (male:female) revealed a distinct male preponderance for HBV-HCC in the present study in all the mentioned groups (data not shown).
Also the liver function test profile depicted that nearly all the investigated parameters (ASP, ALT, ALP, and A/G ratio) were significantly elevated as the disease progresses to cirrhosis, with reference to the controls, thus reflecting an enhancement in degree of disease severity (Table 2).
Data are expressed as mean±standard errors.
Normal range: Total bilirubin, 0.3–1.3 mg/dL; total protein, 6.4–8.3 g/dL; A/G, 1.5–2.5; AST and ALT, 2–40 IU/L; ALP, 98–306 IU/L.
P<0.05, ** P<0.01, *** P<0.001 w.r.t. control + P<0.05, ++ P<0.01 w.r.t. inactive HBV-carrier.
HBV, hepatitis B virus; HCC, hepatocellular carcinoma; ANOVA, analysis of variance; NS, nonsignificant; AST and ALT, aspartate and alanine aminotransferase; IU, international units; ALP, alkaline phosphatase, A/G, albumin/globulin ratio; w.r.t., with respect to.
Polymorphism analysis of cytokines
IL-12B(+1188 3′UTR)
The genotype distribution analysis of the polymorphic forms of the IL-12B(+1188 3′UTR) (Table 3, upper panel) showed that the wild genotype (AA) had highest frequency for control subjects (42.57%), was almost equivalent in carrier (37.31%) and hepatitis subjects (38.30%), while least in HBV-HCC subjects (32.20%). The heterozygous genotype was observed to be maximally present in HBV-HCC group (52.50%), significantly more in comparison to the hepatitis group (35%; P<0.05). However, this genotype frequency distribution was observed to be markedly less (P<0.05) in comparison to the HBV-carriers (52.24%). Moreover, the CC genotype was found to be significantly higher (26.70%) in chronic-active hepatitis B category, with respect to the controls (9.46%; P<0.001), and the HBV-carriers (10.45%; P<0.05).
Upper panel: Data represented as number of subjects (genotype distribution, %). *** P<0.001w.r.t. control; + P<0.05 w.r.t. inactive HBV-carrier; ^ P<0.05 w.r.t. chronic-active HBV.
Lower panel: Data represented as OR (95% CI), adjusted for age and sex. ** P<0.01 w.r.t. control.
OR, odds ratio; CI, confidence interval.
The OR for the association between the IL-12B(+1188 3′UTR) genotypes and the carcinoma progression taking wild genotype as reference (Table 3, lower panel) showed that in case of the AC genotype, after adjustment with age and sex, there was not any significant association with HBV disease progression to HCC, among controls and carriers. On the contrary, the CC genotype showed an almost 3-fold increased risk for hepatitis (OR=3.30; P<0.01), among controls.
IL-2(−330T>G)
The genotype distribution analysis of the polymorphic forms of the IL-2(−330T>G) (Table 4, upper panel) showed that the wild genotype (TT) had highest frequency for carrier subjects (34.33%), while was found to be least in the hepatitis group (21%). The heterozygous genotype (TG) was observed to be comparable in the control (57.50%) and the HBV-cirrhotic (58.10%) populations. The hepatitis B category showed the highest incidence of this particular genotype (63%). Besides, the variant genotype was found to be almost equivalent in the hepatitis and the cirrhotic groups (16% and 16.10%, respectively), while it was least in the controls (11.80%).
Upper panel: Data represented as number of subjects (genotype distribution, %).
Lower panel: Data represented as OR (95% CI), adjusted with age and sex.
The OR adjusted for age and sex, for the association between the IL-2(−330T>G) genotypes and the carcinoma progression taking wild genotype as reference (Table 4, lower panel) revealed that both TG and GG genotypes were not significantly associated with HBV-related disease risk, in the studied population.
TGF-β1(−509C>T)
The genotype distribution analysis of the polymorphic forms of the TGF-β1(−509) (Table 5, upper panel), revealed that the CC genotype distribution was significantly more in controls (28.76%), compared with the rest of the groups. The CT genotype was found to be predominantly present in the cirrhotics (80%), which was markedly more in comparison to the controls (61.44%; P<0.01), carriers (61.54%; P<0.05), and the hepatitis group (60.66%; P<0.05). The variant (TT) genotype was observed to be maximally present in the carriers (32.31%), significantly more than the controls (9.80%; P<0.001) and the cirrhotic subjects (6.67%; P<0.001). Besides, the cirrhotic group had the significantly least incidence of the TT genotype (6.67%), with respect to (w.r.t.) carriers (P<0.001) and the hepatitis categories (P<0.01), respectively.
Upper panel: Data represented as number of subjects (genotype distribution, %). * P<0.05, ** P<0.01, *** P<0.001w.r.t. control; + P<0.05, +++ P<0.001w.r.t. inactive HBV-carrier; ^ P<0.05, ^^ P<0.01 w.r.t. chronic-active HBV; # P<0.05 w.r.t. HBV-cirrhotic.
Lower panel: Data represented as OR (95% CI), adjusted with age and sex. * P<0.05 w.r.t. control; + P<0.05, ++ P<0.01 w.r.t. inactive HBV-carrier.
The OR for the association between the TGF-β1(−509) genotypes and the carcinoma progression taking wild genotype as reference (Table 5, lower panel) showed a 1.6–1.8-fold risk in controls while almost 6-fold protection in carriers, in case of CT genotype, though values were not significant. TT genotype acted as a potential protective factor for cirrhosis and the HCC risk (P<0.01 and P<0.05, respectively), among the carriers.
IL-4(−590C>T)
The genotype distribution analysis of the polymorphic forms of the IL-4(−590) (Table 6, upper panel) showed that the 59% of CC genotype frequency in hepatitis B group was found to be significantly higher than the controls (37.90%; P<0.01) and carriers (22.20%; P<0.001). Moreover, the cirrhotics (29%) and HCC group (27.12%), were observed to have markedly higher frequency, as compared to the chronic-active HBV subjects (P<0.001). Besides, the genotype distribution of CT was found to be predominant in the carrier group (76.20%), significantly more in comparison to controls (57.52%; P<0.01) and the hepatitis group (36%; P<0.001). Moreover, with chronic-active HBV category as reference, the controls (P<0.01), carriers (P<0.001), cirrhotics (P<0.01), and the HCC groups (P<0.001) were found to have significantly higher CT genotype distribution.
Upper panel: Data represented as number of subjects (genotype distribution, %). * P<0.05,** P<0.01 w.r.t. control; +++ P<0.001 w.r.t. inactive HBV-carrier; ^^ P<0.01, ^^^ P<0.001 w.r.t. chronic-active HBV.
Lower panel: Data represented as OR (95% CI, adjusted with age, sex, bilirubin, total protein, A/G, AST, ALT, ALP. + P<0.05 w.r.t. inactive HBV-carrier.
The OR for the association between the genotypes and the carcinoma progression taking wild genotype as reference (Table 6, lower panel) showed that the heterozygous (CT) genotype was found to be in negative association with the development of hepatitis (OR=0.21; P<0.05), cirrhosis (OR=0.36; P=NS, not significant), and HCC (OR=0.30; P=NS), among the carriers.
Analysis of cytokine levels in various categories
IL-12B
The IL-12B level analysis (Fig. 1a) revealed that the median levels were found to be highest in the control population (165.88 pg/mL), which were significantly more in comparison to the HCC group (74.71 pg/mL; P<0.001). Besides, a marked consistent decrease (P<0.001) was also observed in the diseased categories, with the disease progression from carrier (184.1 pg/mL), hepatitis (164.5 pg/mL), cirrhosis (124.4 pg/mL), and finally to HCC state.

Further, on analyzing the IL-12B levels (median±standard error of the mean) with its genotypes (Fig. 1b), it was found that the controls with AC genotype had significantly lower levels (87.36±17.15 pg/mL; P<0.001) w.r.t. the wild genotype (AA). Also, levels observed in subjects with CC genotype, were markedly higher (242.52±56.23 pg/mL; P<0.05), in comparison with the AC genotype individuals. On the contrary, in case of diseased category, the levels were found to be highest in the patients with the heterozygous genotype (154.14±11.23 pg/mL; P<0.001). However, the analysis of the level difference between the wild (A) and variant (C) allele subjects, revealed no potential change (data not shown). On Pearson correlation analysis of IL-12B levels, with different parameters (IL-12B genotypes, bilirubin, total protein, AST, ALT, ALP and A/G), none of them were found to be significantly correlated with IL-12B.
IL-2
The measurement of the unstimulated IL-2 levels in the PBMCs (Fig. 2a), revealed that in comparison to both the control (146.16 pg/mL) and carrier (249.35 pg/mL) groups, there was a steady elevation (P<0.001) in the levels as the disease culminates to HCC (415.79 pg/mL).

As is clearly depicted in Fig. 2b, IL-2 levels were found to be maximal in case of individuals with the GG genotype (276±36 pg/mL; P<0.001), in comparison to the subjects with the TT and TG genotypes, among controls. Moreover, the variant allele (G) subjects showed a marked increase in the levels (229.4±13.42 pg/mL; P<0.05) in comparison to the wild allele (T) subjects (159.5±9.8) pg/mL, upon combined analysis of all the subjects. On Pearson correlation analysis of IL-2 levels, with different parameters (IL-2 genotypes, bilirubin, total protein, AST, ALT, ALP, and A/G), none of them were found to be significantly correlated with IL-2.
TGF-β1
On estimation of the TGF-β1 levels in PBMCs (Fig. 3a), the levels were observed to be significantly high in all the categories viz. carrier (P<0.001), hepatitis (P<0.001), cirrhotic (P<0.01) and the HCC (P<0.001), as compared to controls, with maximum levels in the HCC group.
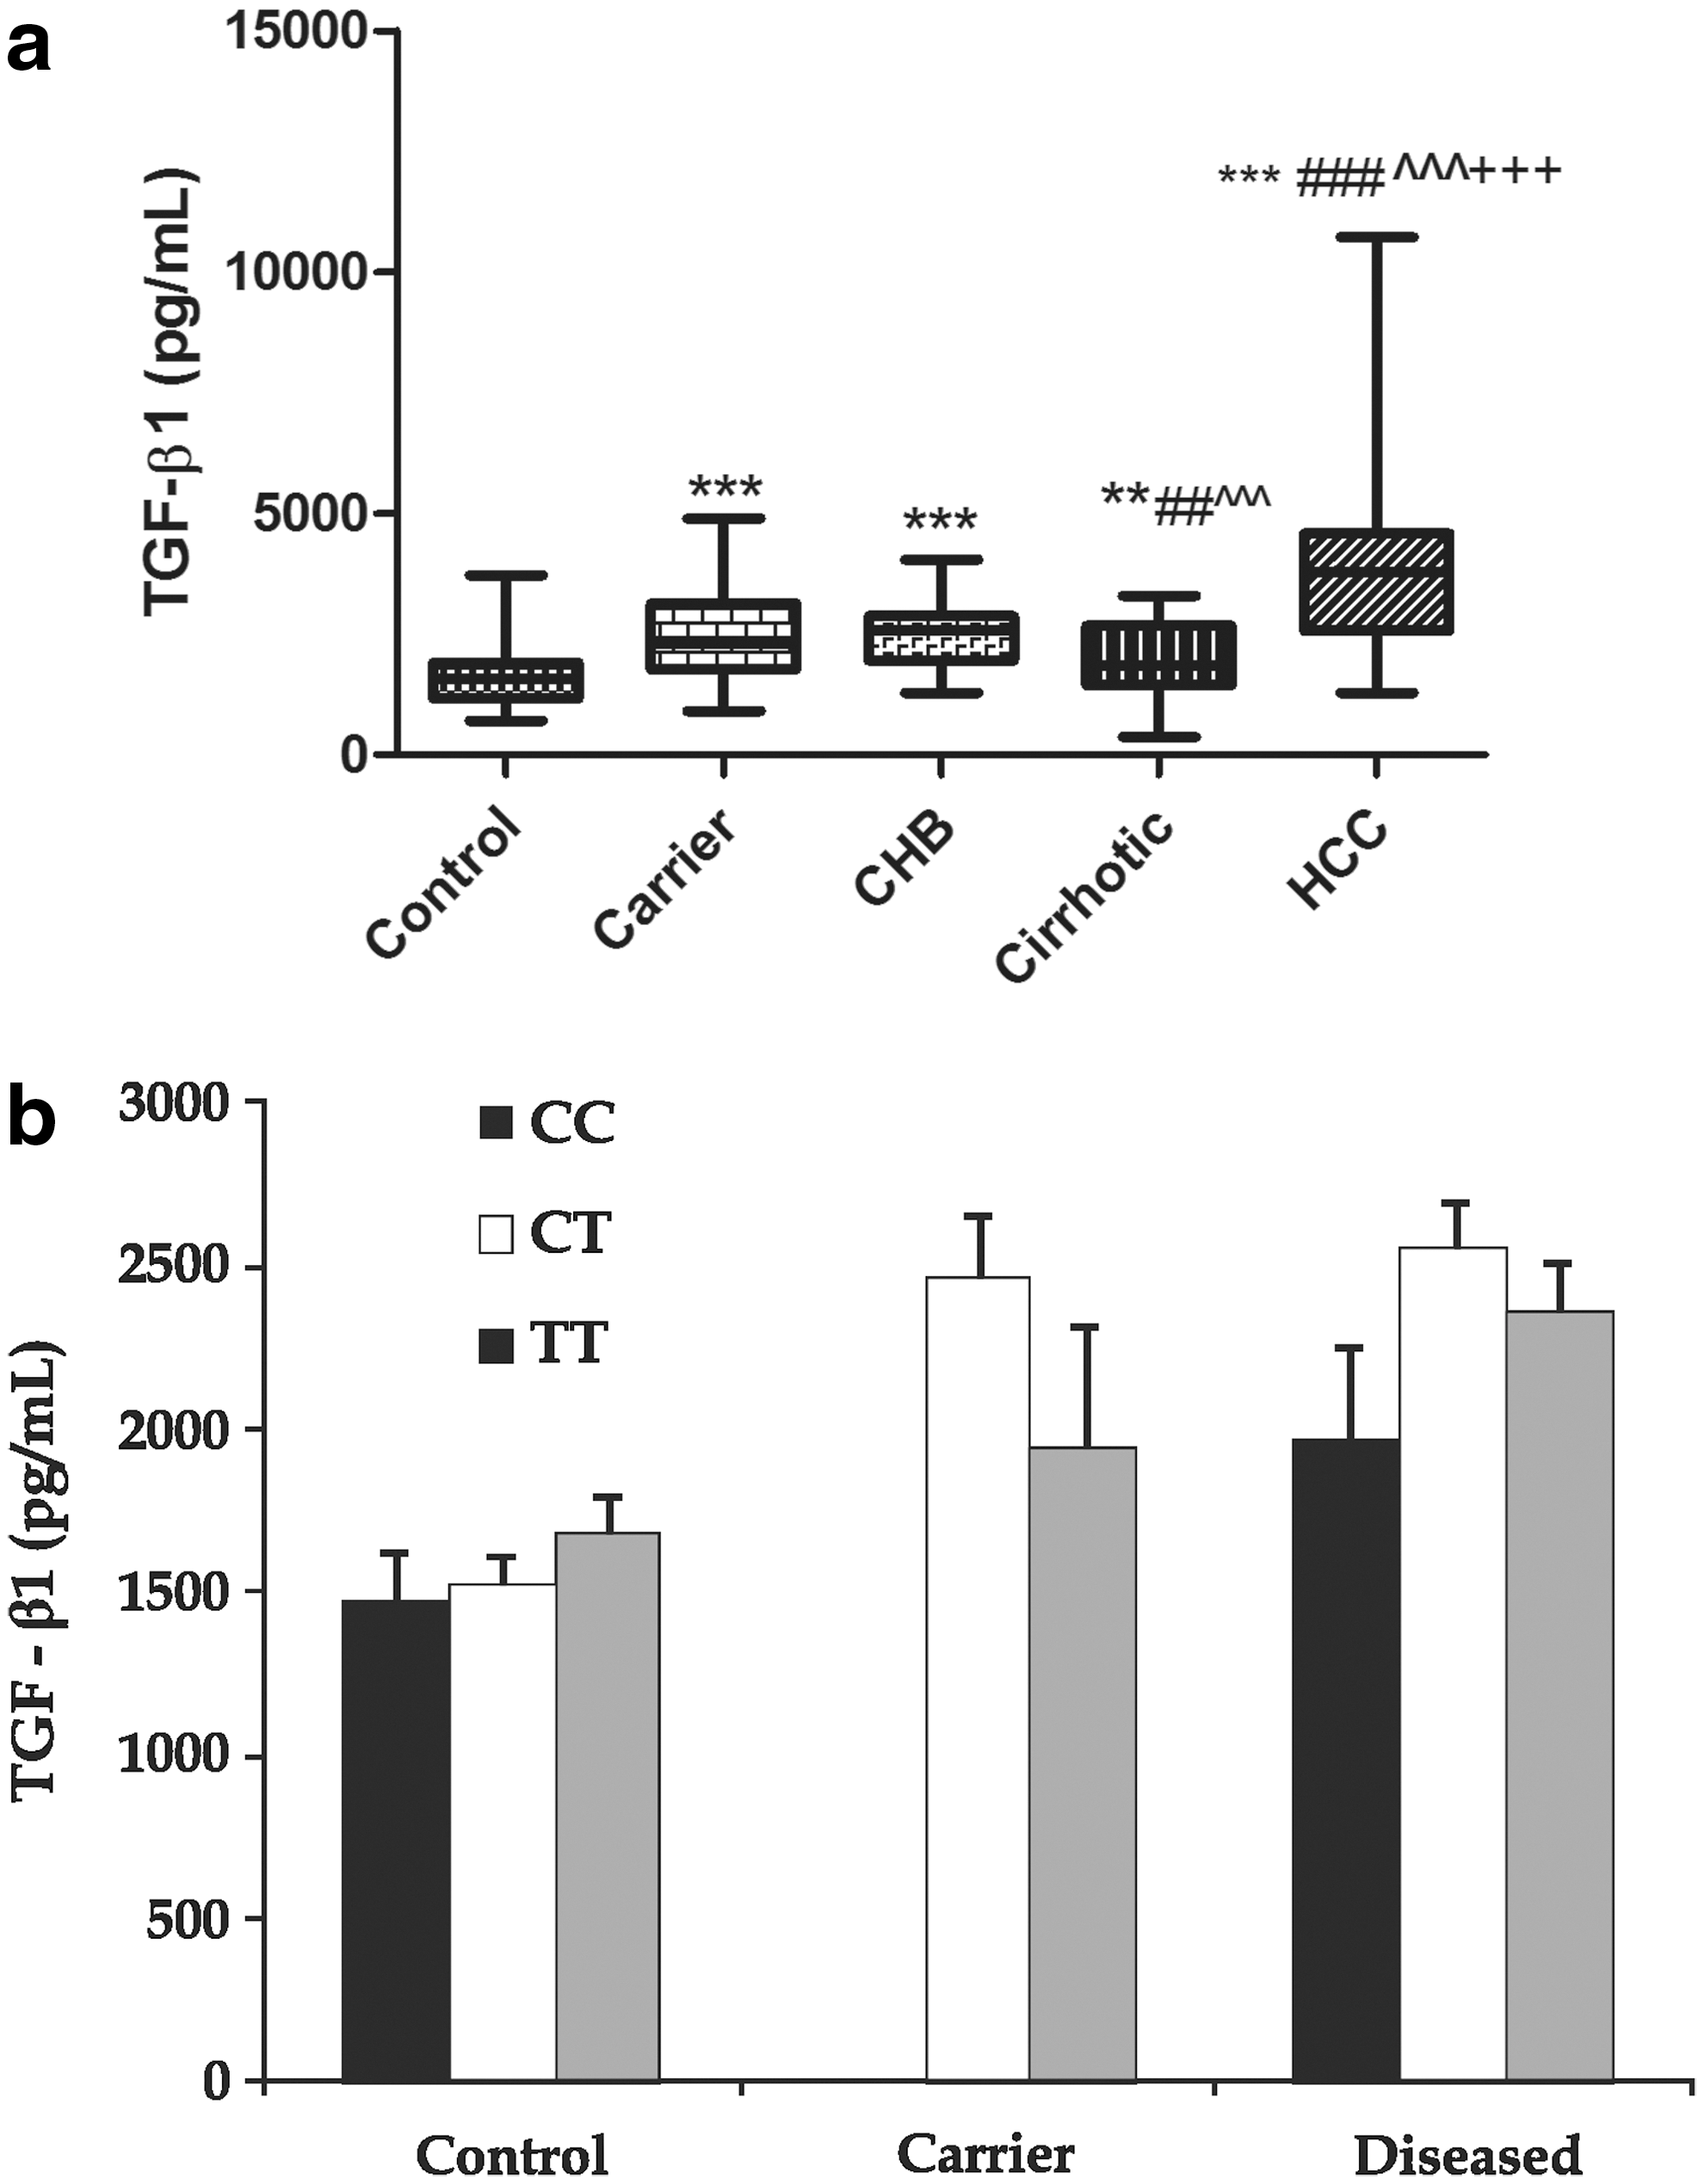
The TGF-β1 genotype-level estimation (Fig. 3b), showed that there was no significant difference in the levels in any of the genotypes studied, as observed in all the categories, under investigation. The Pearson correlation analysis of TGF-β1 levels, showed a positive relation between TGF-β1 levels versus ALP (r=0.234; P<0.05) and an inverse relation between TGF-β1 levels versus A/G ratio (r=0.206; P<0.05). Further, on multiple regression analysis, ALP was found to significantly affect TGF-β1 levels.
IL-4
The spontaneous IL-4 level analysis in the PBMCs, as depicted in Fig. 4a, showed that, compared with the healthy controls (84.25 pg/mL), a significant increase was observed till the cirrhosis development (134.51 pg/mL; P<0.01), but further the levels decreased with the HCC development (74.21 pg/mL; P<0.05).

The IL-4 level-genotype analysis (Fig. 4b), revealed that in both controls (93.75±16) pg/mL and the diseased groups (114.32±14.68) pg/mL, the levels were found to be significantly raised (P<0.001) in subjects with CT genotype, in comparison to those with the wild genotype (CC) that is, (29.56±8) pg/mL and (105.23±14.6) pg/mL, respectively. Moreover, there was a significant elevation in the levels of the individuals harboring T allele (103.6±10) pg/mL; P<0.01) pg/mL, when compared to those with the C allele (73.74±7.7) pg/mL. The Pearson correlation analysis, showed a positive relation between IL-4 levels versus genotypes (r=0.381; P<0.01) and IL-4 levels versus ALP (r=0.321; P<0.01). Further, on multiple regression analysis, both the variables were found to significantly affect IL-4 levels.
RT-PCR analysis
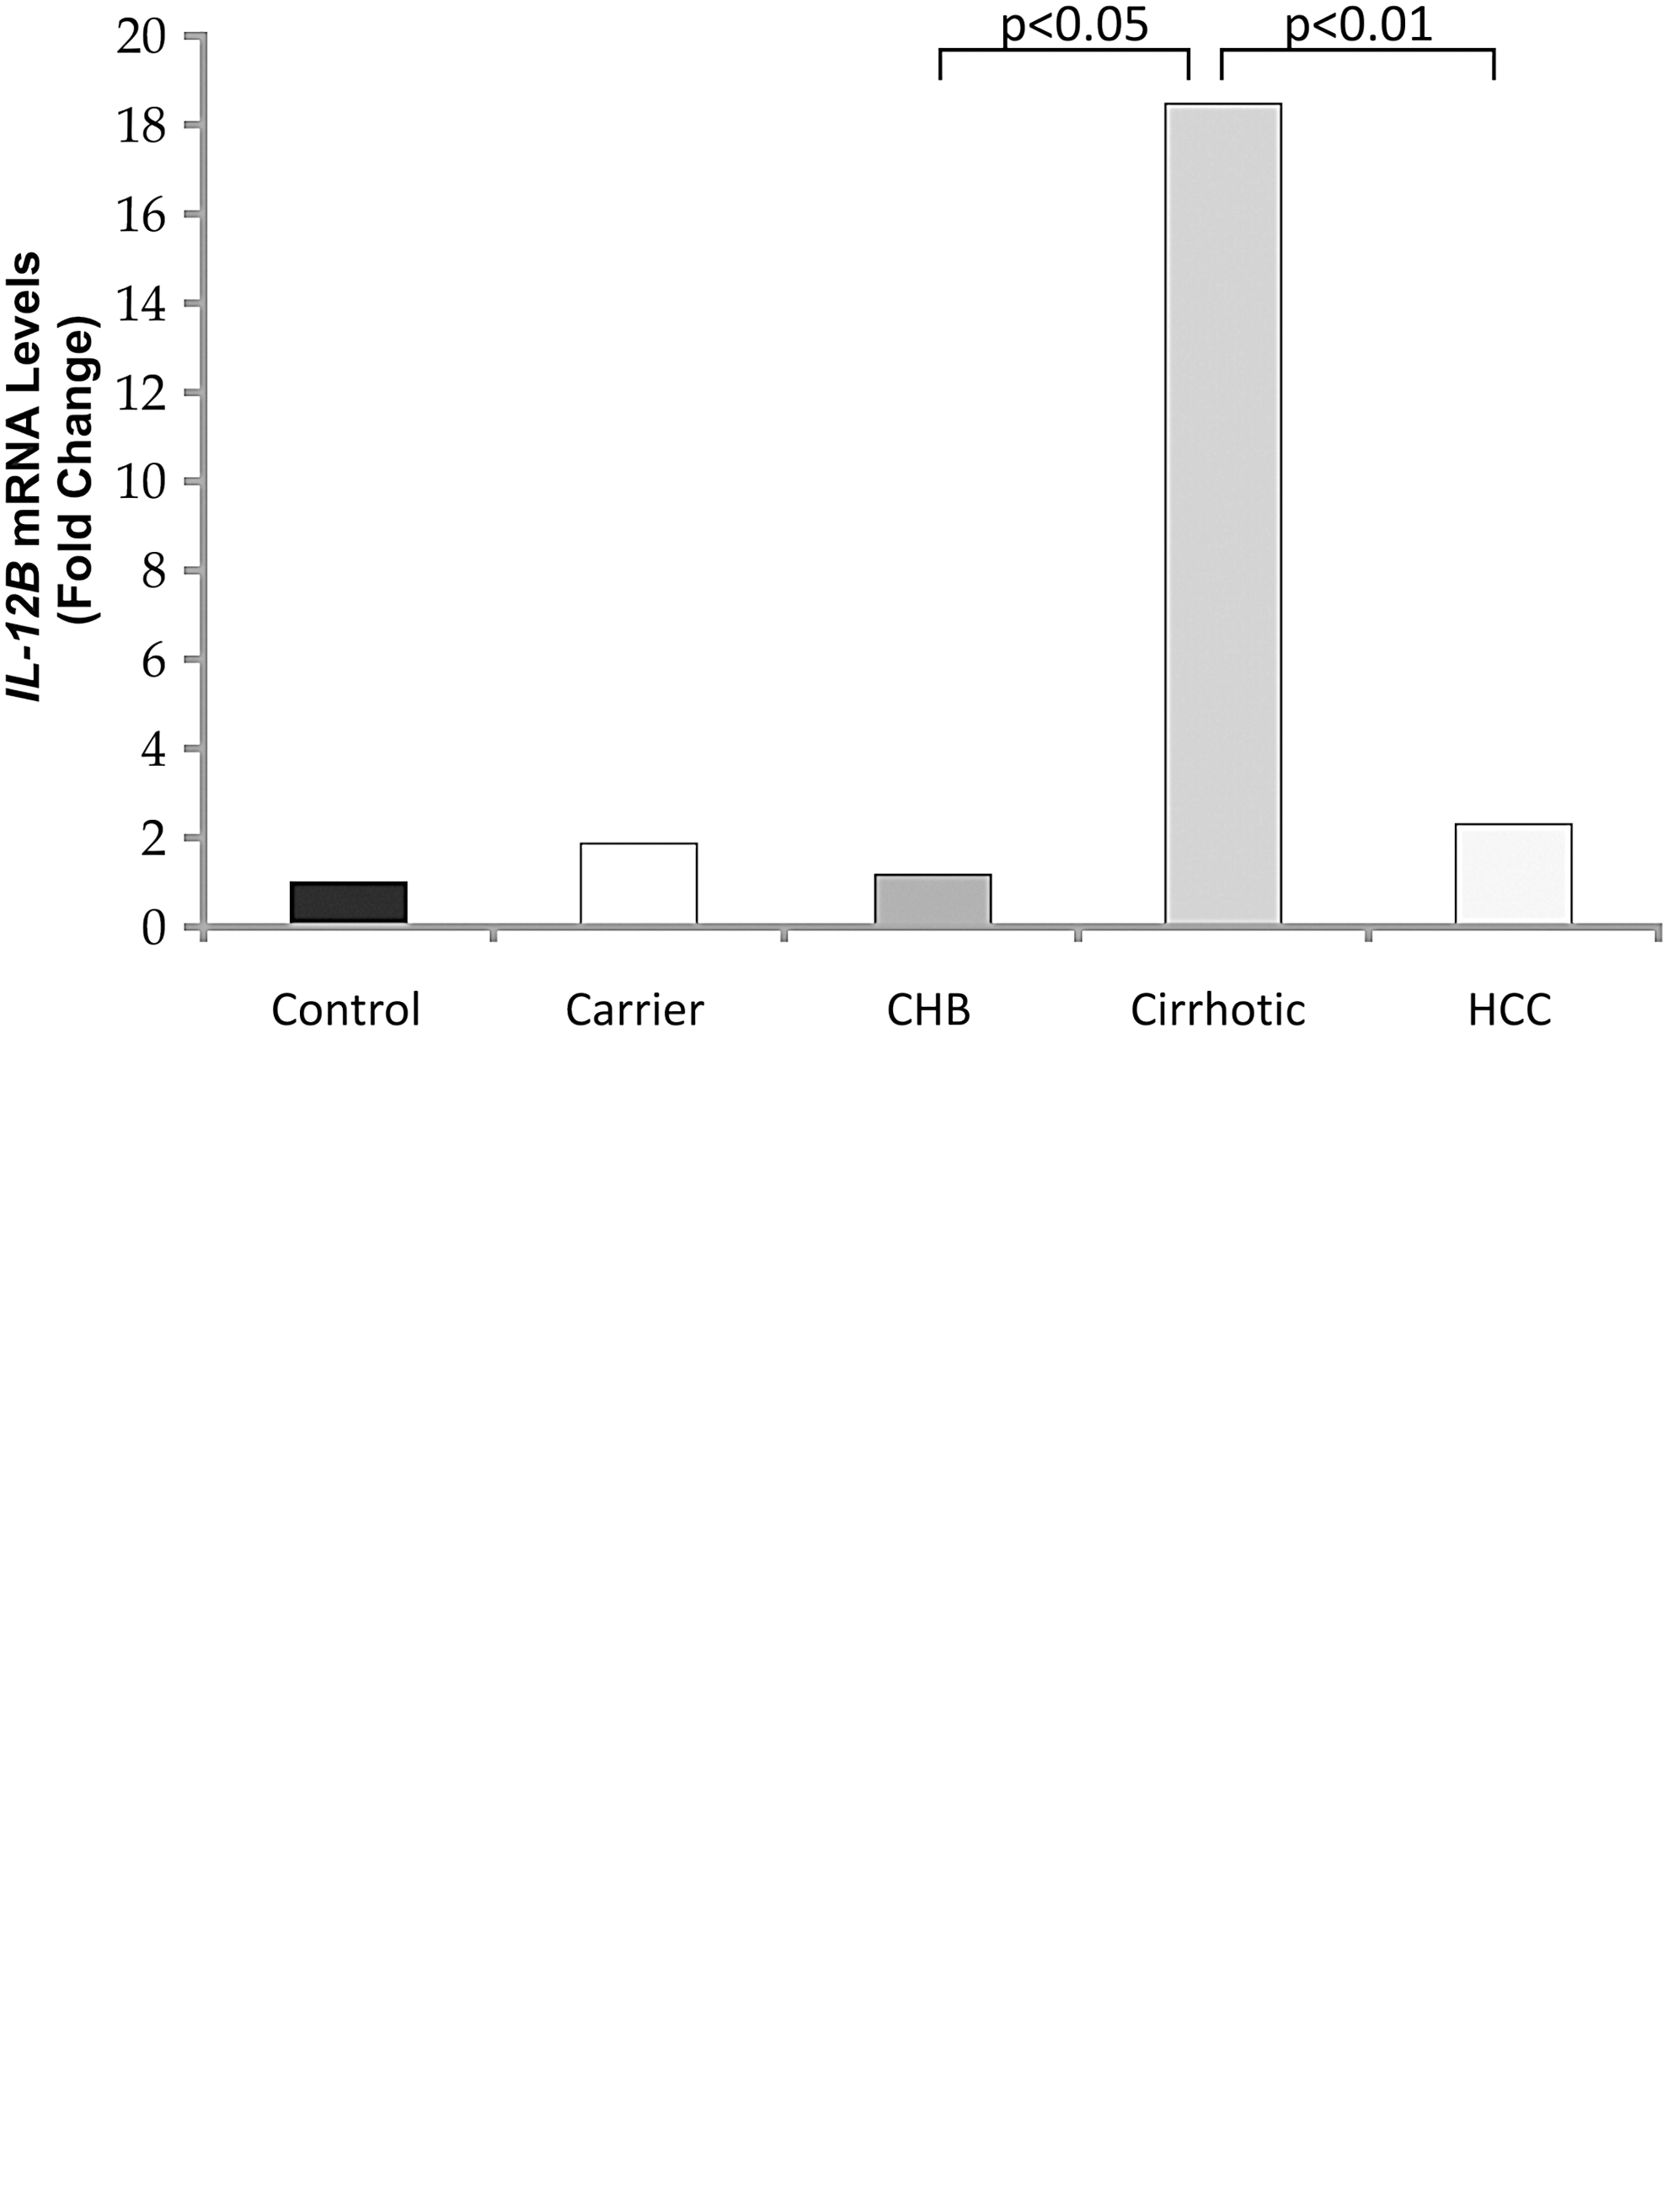
As is evident from Fig. 5a, there was a significant (P<0.05) 15.42-fold increase in the cirrhotic mRNA expression compared with the chronic-active HBV subjects. Further, with the disease progression to HCC, a marked decline in the IL-12B mRNA levels (8.04-fold decrease; P<0.01), was observed, w.r.t. cirrhotics. Similarly, on analyzing the TGF-β1 mRNA expression (Fig. 5b), a significant and steady increase (P<0.001, P<0.05) in the expression was evident, till cirrhosis development. However, as the disease progresses to HCC, a marked decline in TGF-β1 transcript levels was found, as compared to that in hepatitis (2.01-fold; P<0.001) and the cirrhotic (3-fold; P<0.001) groups, respectively. Further, the analysis of IL-2 and IL-4 mRNA expression revealed no significant change in the expression of the 2 cytokines, in any of the categories studied, compared with the control population (data not shown).
Discussion
Chronic HBV infection remains a serious global health problem, affecting nearly 75% Asians. In India, the incidence of HbsAg carriers constitutes nearly 2%–11% of the Indian population (Manilal and others 2010). The hepatocellular injuries caused by HBV infection are predominantly immune-mediated, therefore, cytokines are considered to be the key mediators, regulating a myriad of these inflammatory immune responses.
Among these cytokines, IL-12B, IL-2, TGF-β1, and IL-4, are potential immunomodulatory cytokines, documented to play a vital role in HBV pathogenesis, with absolutely no reports from India. The present case–control study was planned in an attempt to assess the association between genotypes, mRNA, and the protein levels of these cytokines during the progression of hepatitis B infection in the north Indian population. For this purpose, on conducting the polymorphism analysis of IL-12B(+1188A>C 3′UTR), the AC genotype had highest frequency in control subjects (47.97%). Similar case was evident in 2 Chinese studies controls (Tso and others 2004; Chen and others 2009), where the frequencies of AC genotype individuals were 53% and 46%, respectively, and in Mexican and South Korean populations (Alvarado-Navarro and others 2008; Han and others 2008). Also, the genotype distribution data revealed the prevalence of the AC genotype in the HCC categories too, similar to that observed in a Chinese study by Liu and others (2011). However, this observation differed from a study done by Suneetha and others (2006), where AA genotype was the predominant form observed in the control population. But, parallel to our results regarding the distribution of CC genotype in cirrhotics in our study, this study too showed CC genotype to be comparatively more in fibrotics w.r.t. controls. The predominance of the AA genotype in controls, was also observed by Hall and others (2000), where AA genotype frequencies varied from 66% to 70%, respectively in Greek and the United Kingdom controls. In yet another study, the wild allele frequency calculated in Spanish controls (Zafra and others 2007) was comparable to the present study (0.71 and 0.67, respectively). Further, on associating IL-12B (+1188 3′UTR) genotypes with HCC risk, both the AC and CC genotypes were not found to be significantly associated with HCC risk, both among controls and carriers. Similar observations were reported in 2 separate studies done in the Chinese population (Nieters and others 2005; Liu and others 2011), where the CC and AC genotypes of IL-12B were not found to be significantly associated with HBV-induced HCC.
Secretion of biologically active IL-12 is primarily dependent on IL-12B (IL-12p40) levels, which play a critical role in the elimination of virus-infected cells (Suneetha and others 2006). Likewise, the IL-12B level analysis in the present study revealed, a steady decrease (P<0.001) in the diseased categories, from carriers to the HCC state. Moreover, the levels were found to be the highest in controls, significantly more in comparison to the HCC group (P<0.001). A similar trend was also observed in IL-12B serum levels, in yet another study conducted on Japanese HBV patients (Ayada and others 2006), where IL-12p40 levels were found to be positively correlated with the amount of HBeAg load. However, contrasting results were seen in HBV-infected Vietnamese patients, where steadily elevated IL-12B serum levels was evident from carriers to the cirrhotics (Song le and others 2003). Another study by Rossol and others (1997) showed significantly elevated (P<0.01) IL-12B serum levels in chronic hepatitis B subjects w.r.t. controls. Besides, the IL-12B level/genotype analysis showed that controls with AC genotype had significantly lower levels (87.36±17.15 pg/mL; P<0.001) w.r.t. those with AA genotype (197.01±14.5 pg/mL). This was found to be similar to a study done in Bulgarian controls (Stanilova and Miteva 2005), where IL-12B levels were significantly elevated in AA homozygotes, in comparison to AC (P<0.03) hetero- and CC homozygote (P<0.04) controls. Also, in case of diseased category, highest levels were evident in patients with heterozygous genotype (P<0.001), in comparison to the other genotypes. These results indicated that the presence of ‘A’ allele correlated with increased IL-12B production, which was in line with the above mentioned study (Stanilova and Miteva 2005).
The IL-2(−330T>G) genotyping, showed TG genotype to be maximally distributed, both in controls (57.50%) and the diseased groups (52.24%–63%), consistent to that observed in a Turkish population (Yilmaz and others 2007). Parallel to our finding, the TG genotype frequency of 44.6% was also found to be highest among controls in a Chinese study (Gao and others 2009). Contrary to this, TT genotype was found to be predominantly present in control (55.33%) and the tumor patients (45.54%) in a Croatian study (Berkovic and others 2010). However, in Brazilian and United Kingdom Caucasian control populations (Scarel-Caminaga and others 2002), TT genotype (59.1% and 53.2%, respectively), was the most prevalent form observed. In our study, among controls, wild allele (0.59) was comparatively more than the variant allele (0.41), exactly similar to that observed in healthy Macedonians (Trajkov and others 2005). Besides, IL-2(−330T>G) TG and GG genotypes remained largely not associated with HBV chronicity, among controls and carriers. Similarly, the IL-2(−330T>G) polymorphism did not appear to modify HBV-HCC risk in the Chinese and American populations (Nieters and others 2005; Ognjanovic and others 2009). However, contrary to our finding, IL-2−330 TT genotype was found to be associated with an increased risk of mild (OR=3.42, 95% CI=1.45–8.13), moderate/severe (OR=3.29, 95% CI=1.1–9.8) chronic hepatitis, in case of HBV/HCV or HBV-HCV coinfection in a study by Gao and others (2009), with GG genotype as reference.
Besides, the IL-2 level analysis revealed that with both controls and carriers as the reference groups, the levels steadily elevated (P<0.001) as the disease culminates to HCC. Similarly, a study conducted in the Italian population, revealed markedly elevated (P<0.01) plasma IL-2 levels in chronic hepatitis B patients (Falasca and others 2006). Further, the analysis of IL-2(−330T>G) genotypes with its levels, revealed the levels to be maximal (P<0.001) in GG genotype individuals, when compared with the TT and TG genotype subjects, among controls. Similar to our results, a significant correlation (P<0.03) between G allele and IL-2 serum levels was observed in patients with neuroendocrine tumors of the gastrointestinal tract and pancreas, as was reported by Berkovic and others (2010).
The TGF-β1(−509) genotype distribution analysis revealed that the heterozygous genotype (CT) frequency (61.44%) was most prevalent in controls. This finding was found to be consistent to studies done in Indian (50.5%), Iranian (46.4%), Chinese (47.7%), and the Japanese (56%) healthy subjects (Yamada 2001; Wei and others 2007; Tamizifar and others 2008; Vishnoi and others 2008). Moreover, the wild allele (0.59) was predominant in the control population, in the present study. This was similar to a study done in north Indian and Italian controls (Kumar and others 2007; Falleti and others 2008). Moreover, the predominance of CT genotype prevailed, irrespective of the disease severity in the present study. This was similar to that observed in Chinese HBV patients with/without HCC (Qi and others 2009). Moreover, no potential association of TGF-β1(−509) CT and TT genotypes with cirrhosis and subsequent HCC development, among controls was evident, unlike those found to be significant in positive association with cirrhosis in an earlier study done in Italian population (Falleti and others 2008). Further, the TT genotype was found to be significant in negative association with cirrhosis and the subsequent HCC risk, among carriers. Similar to carriers, a study reported significantly lowered HCC risk in hepatitis B patients with TT genotypes, than in those with CC genotypes (Qi and others 2009). Similarly, another study also reported decreased HCC risk in patients with TT or CT genotypes than in those with the CC genotypes (Kim and others 2003).
TGF-β1 is known to have an important stimulating effect on chronic hepatitis B and pathogenesis of fibrosis in patients with cirrhosis. Consistent to this, the TGF-β1 level analysis revealed significantly elevated levels (P<0.001) in hepatitis subjects, compared with controls. Similarly, serum TGF-β1 levels were also found to be potentially elevated (P<0.01) in the hepatitis group in a study by Akpolat and others (2005). These findings further substantiate that, TGF-β1 secretion is the most important starting point of pathogenesis of fibrosis. However, contrasting results were reported by Kirmaz and others (2004), where no potential change was observed in TGF-β1 serum levels between the 2 mentioned categories. We observed significantly elevated TGF-β1 levels (P<0.001) in HCC subjects, compared with other groups. Consistent to this, increased plasma TGF-β1 concentration was also observed in patients with unresectable HCC (Okumoto and others 2004). This finding probably indicated the contribution of dysregulated TGF-β1 in the suppression of anti-tumor immunity in the advanced disease. It also reconfirms the biphasic role of TGF-β1 in carcinogenesis, as it has been documented that TGF-β1 acts as a tumor suppressor during the early phase of cancer development, but acts antagonistically (tumor promoter) in the later stages of carcinogenesis (Wei and others 2007). Evidences have shown that the concentration of active TGF-β1 might be under genetic control, as Grainger and others (1999), have observed that the T allele of −509C/T polymorphism is associated with high production of TGF-β1. However, the present study differed from this finding as there was no significant difference in the levels in any of the TGF-β1(−509C/T) genotypes in accordance with an earlier study done by Qi and others (2009), and also it did not show any significant difference in TGF-β1 plasma concentration, between CC and TT genotypes among diseased or healthy controls. Moreover, on multiple regression analysis also, TGF-β1 levels were found not to be dependent upon TGF-β1 genotype. The reason for the apparent discrepancy on the genetic control of TGF-β1 production level could be the ethnic disparity.
The genotype distribution analysis of IL-4(−590), showed that 57.52% CT and 59% CC genotype frequencies, respectively were observed to be maximal, among control and chronic hepatitis B subjects. This finding varied from studies by Chen and others in Taiwanese and Gao and others in Chinese populations (Chen and others 2007; Gao and others 2009), where the TT genotype was predominant in HBV and HCV patients, respectively, when compared with the control population. The higher prevalence of CC genotype (75.4%) was also evident in Caucasian controls (Donn and others 2001), contrary to our study. Moreover, in controls, the wild allele frequency (0.67) was comparatively more than the variant allele (0.33), in our study. This was consistent to that observed in studies conducted in healthy Macedonians (Trajkov and others 2005), north (Kaur and others 2007) and south Indian controls (Vidyarani and others 2006). But, was strikingly different to a study conducted in Chinese population, where T allele (0.77) was more prevalent than wild allele (0.23) in the control population (Bai and others 2008). The association analysis of IL-4(−590) with HCC risk, showed that CT genotype was found to be a potential protective factor for hepatitis B development, among carriers. On the contrary, in a Chinese cohort study, no significant association was observed between IL-4(−590C>T) genotypes and the HCC risk (Nieters and others 2005). Besides, in another study, IL-4 (−590) CT and CC genotype frequencies were significantly higher in chronic hepatitis B patients with abnormal ALT levels, thereby associating them with liver inflammatory injury (Gao and others 2009).
Besides, an anti-inflammatory role of IL-4 was further substantiated by its level analysis, which showed that in comparison to controls, a significant increase was observed till the cirrhosis development (P<0.01), but further the levels decreased with HCC development (P<0.05). IL-4 levels found in HCC subjects were significantly lower w.r.t. carriers (P<0.01), hepatitis (P<0.001), and the cirrhotics (P<0.001). This reflected the role of IL-4 during the progressive phase of HBV infection. Studies by Akpolat and others (2005) and Falasca and others (2006), similarly reported significantly raised IL-4 levels in HBV-infected patients, compared with controls. Besides, the subjects with IL-4(−590)CT genotype, showed significantly raised IL-4 levels (P<0.001), w.r.t. CC genotype subjects. This was consistent to the earlier studies that demonstrated that the T allele is associated with an enhanced promoter strength and increased binding of the nuclear transcription factors to the promoter, thus upregulating IL-4 expression. In addition to this, the multiple regression analysis showed that both IL-4(−590) genotypes and ALP were found to significantly affect the IL-4 levels. However, contrary to our study, no significant difference was found between IL-4 levels and its genotypes in a study done by Vidyarani and others (2006), in south Indian population.
However, as observed in this study, the mRNA expression of cytokines does not necessarily correspond with their raised protein levels (Assoian and others 1987). The most likely explanation for this could be that, apart from transcriptional, there could be post-transcriptional and translational regulatory events, determining the levels of cytokines. Also, the relationship between mRNA expression and biologically active cytokine secreted by cells is dependent on various other factors including mRNA stability, maturation, transport, and rate of release from cells (Lichtenstein and others 1997). The detected contradictions regarding the levels of cytokines during course of disease, as observed in our study from the available literature data, may be due to the level of liver injury, the activity of the infectious process, in addition to severity and duration of the disease in the observed patients. Earlier, it was suggested that the production of the individual cytokines might be affected by different factors (Ayada and others 2006), like the activity of the disease, the fibrotic changes in the liver, viral load, viral antigen load, and the complication of malignancy. Such factors relating to the changes of individual cytokine levels differ with the disease phases. Also the apparent variation in the cytokine production, believed to be under genetic control, could be most likely attributable to the difference in genetic backgrounds, the underlying molecular mechanisms, and/or environmental factors of the study subjects (Okumoto and others 2004).
So, these preliminary observations suggest a potential role of IL-12, IL-2, TGF-β1, and IL-4 in monitoring the various stages of HBV-mediated disease pathogenesis viz. from the inactive carrier state to malignancy in Indian population. Among these, IL-12B, TGF-β1, and IL-2 seem to be majorly involved in the development of HCC, while anti-inflammatory IL-4 might be responsible for the progression of the HBV disease till cirrhosis development.
However, these initial findings warrant the need for carrying out additional studies in the context of HBV-mediated disease chronicity, in a larger Indian population, for further validation and to be conclusive.
Footnotes
Acknowledgment
The financial assistance by the Indian Council of Medical Research (ICMR) is highly acknowledged.
Author Disclosure Statement
No competing financial interests exist.