




Abstract
Chronic inflammation and insulin resistance form hallmarks of type 2 diabetes mellitus (T2DM). An increased circulating level of the serine protease granzyme B (GzmB) is observed during prolonged inflammation and is implicated in the pathogenesis of several chronic inflammatory diseases. Moreover, insulin receptor cleavage by unknown proteases, yielding elevated levels of insulin receptor α-subunit (IRα), was observed in T2DM and was proposed as a new mechanism of insulin resistance. Therefore, a possible association between GzmB and IRα is suggested. Accordingly, this study was set to explore whether GzmB and IRα levels are altered in T2DM patients with the impact of obesity. Furthermore, we aimed to identify if GzmB contributes towards inflammation and insulin resistance through its suggested extracellular activities. All subjects were assessed for anthropometric and metabolic parameters related to obesity and T2DM. In addition, fasting plasma insulin, GzmB, interleukin-1β (IL-1β), and IRα levels were estimated by enzyme linked immunosorbent assay. Levels of GzmB and IRα were found to be significantly elevated in T2DM patients compared to nondiabetic subjects. In addition, GzmB levels were positively correlated with measures of obesity and insulin resistance, IL-1β, IRα, and other metabolic parameters. While multiple linear regression analysis revealed that both T2DM and central obesity were predicting factors for GzmB, our findings reveal a possible role of GzmB in T2DM.
Introduction
G
Interestingly, GzmB was shown to be involved in CTL-mediated destruction of β cells in type 1 diabetes mellitus (T1DM). Previously, it was shown to be able to kill β cells in vitro (Estella and others 2006). This finding was further supported by the finding that allogeneic CTL killed β cells less efficiently in the absence of GzmB (Sutton and others 2006). However, a recent study reported that GzmB is dispensable for β cell destruction in T1DM, but still required for efficient early activation of CTL (Mollah and others 2012). Accordingly, studies to date would suggest that GzmB contributes to β-cell apoptosis, but it remains to be determined whether there is an extracellular role for this protease in DM. Whether GzmB has a role in T2DM is investigated in the current study.
Insulin resistance plays a key role in the development of T2DM (Mlinar and others 2007). Obesity is a major contributor to insulin resistance and thus, T2DM (Shoelson and others 2006). However, how obesity is linked to insulin resistance is still unclear, but results have highlighted the role of inflammation (Shoelson and others 2006). Recent work by our group has demonstrated how obesity plays a role through inflammation in different insulin resistance related disorders as T2DM with or without cardiovascular disease (El-Mesallamy and others 2011a; El-Mesallamy and others 2012) and chronic hepatitis C (El-Mesallamy and others 2011b). Although, numerous efforts have been made to delineate how insulin resistance occurs, it remains as one of the unresolved issues in T2DM.
The hallmarks for chronic inflammation are clearly displayed in the obese adipose tissue (Weisberg and others 2003; Nishimura and others 2008); such local inflammation ultimately causes systemic insulin resistance (Xu and others 2003). The mechanism behind this insulin resistance is believed to be due to cytokines produced by macrophages accumulated within the adipose tissue (Lumeng and others 2007; Odegaard and others 2007). More recently, the role of adipose resident T cells (ARTs) in obesity-associated inflammation and insulin resistance was pointed out (Nikolajczyk and others 2011). CTLs, a T-cell subset, were shown to be crucially involved in adipose tissue inflammation (Nishimura and others 2009). Furthermore, genetic depletion of CTLs caused a decrease in inflammation with an improvement in insulin resistance (Nishimura and others 2009), suggesting that mediators from CTLs might play a role in inducing insulin resistance.
In particular relevance to our study, DM was previously found to be a significant factor for the elevation of plasma GzmB levels in chronic renal failure patients (Ikemoto and others 2009). However, GzmB levels and its role need to be studied in T2DM with the impact of obesity.
Apart from inflammation, another interesting factor related to insulin resistance is the insulin receptor α-subunit (IRα). Soluble IRα was shown to be elevated in the plasma of T2DM patients (Obata and others 2007). Such an elevation is believed to be due to insulin receptor cleavage by uncontrolled protease activity found in the plasma of T2DM patients, hypothesizing a new mechanism for insulin resistance due to receptor cleavage (DeLano and others 2010). Such a linkage sparked our interest to examine whether insulin receptor cleavage is related to GzmB as a serine protease, or not.
Accordingly, the present study set out to explore whether the level of GzmB is altered in human obesity and T2DM; thus, may be a potential candidate playing a role in obesity-associated-T2DM. It is unknown whether circulating GzmB is related to measures of obesity, insulin sensitivity, and glucose metabolism. Additionally, we aimed to gain further insight into this role through investigating its relation to interleukin-1β (IL-1β), an inflammatory mediator implicated in insulin resistance in T2DM, and insulin receptor cleavage, as well as other metabolic and anthropometric parameters. To our knowledge, this is the first study designed to investigate the role of extracellular GzmB in obesity and T2DM.
Materials and Methods
Study population and anthropometric measurements
A total of 86 subjects (45 men and 41 postmenopausal women) were enrolled in the study as follows; 34 nondiabetic (ND) subjects with normal fasting glucose and 52 patients with T2DM based on criteria issued by the American Diabetes Association in 2003 in a report by its committee on the diagnostic criteria of DM (Expert Committee on the Diagnosis and Classification of Diabetes Mellitus 2003). ND subjects were defined by a fasting plasma glucose (FPG)≤110 mg/dL, while patients with T2DM were defined by a FPG≥126 mg/dL. The ND group comprised 18 lean [body mass index (BMI)<25 kg/m2] and 16 obese subjects (BMI≥30 kg/m2); and T2DM group comprised 22 lean and 30 obese patients. Overweight subjects and patients (BMI 25–29.99 kg/m2) were excluded from the study. The 52 patients with T2DM were recruited from the Outpatient Clinic of the National Institute of Diabetes and Endocrinology. Detailed information on family medical history and drug treatment(s) were collected for all subjects. The characteristics of the studied subjects are summarized in Table 1. Anthropometric parameters measured included BMI and waist-to-hip ratio (WHR). BMI was calculated as an index of the weight in kilograms divided by the square of the height in meters. Subjects of BMI<25 kg/m2 were considered lean, while subjects with BMI≥30 kg/m2 were considered obese according to the cut-off points as defined by the World Health Organization (WHO, 2013). Waist and hip circumferences were measured to the nearest 0.1 cm following standard procedures. ND subjects were not suffering from any health problems and were not receiving any medications or dietary supplements. The following exclusion criteria were used for all subjects; age less than 30 or more than 70 years, T1DM, renal or hepatic diseases, acute or chronic inflammatory diseases, cancer, thyroid dysfunction, ischemic cardiovascular disease, acute or chronic infection, any hematologic disorders, alcohol or drug abuse, female subjects taking hormonal replacement therapy were excluded as well. Moreover, diabetic subjects were selected not to have long duration, to help avoid the presence of diabetic complications; namely retinopathy, neuropathy, and nephropathy. Moreover, diabetic patients treated with insulin, fenofibrates or statins were also excluded.
Data were analyzed by student's t-test and are expressed as means±SEM.
P<0.001 for patients with T2DM versus ND subjects.
P<0.01 for patients with T2DM versus ND subjects.
Calculated by general linear model with adjustment of age, sex and BMI.
ND, nondiabetic; T2DM, type 2 diabetes mellitus; BMI, body mass index; WHR, waist-to-hip ratio; BUN, blood urea nitrogen; ALT, alanine aminotransferase; AST, aspartate aminotransferase; FPG, fasting plasma glucose; HbA1c%, assay of glycosylated hemoglobin; HOMA-IR, homeostasis model assessment of IR; QUICKI, Quantitative insulin sensitivity check index; HDL-C, high density lipoprotein cholesterol; LDL-C, low density lipoprotein cholesterol; IL-1β, interleukin-1β; GzmB, granzyme B; IRα, insulin receptor α-subunit; OHA, oral hypoglycemic agent; SU, sulfonylurea; MET, metformin; SEM, standard error of the mean.
This study was approved by the ethical committees of the National Institute of Diabetes and Endocrinology and Faculty of Pharmacy, Ain Shams University. A written informed consent was obtained from each subject before participating in the study. The study was carried out in accordance with the regulations and recommendations of the Declaration of Helsinki.
Blood sampling
Blood samples (8–10 mL) were collected from all subjects after an overnight fasting. Samples were divided into 4 aliquots; the first aliquot of blood was collected on vacutainer tubes containing sodium fluoride for plasma preparation used for the immediate assay of FPG. The second aliquot was collected on vacutainer tubes containing Na2-ethylenediaminetetraaceticacid (EDTA) for the assay of glycosylated hemoglobin (HbA1c%). The third aliquot was collected on plain vacutainer tubes for serum preparation used for the assay of lipids profile and routine parameters [creatinine, blood urea nitrogen (BUN), alanine aminotransferase (ALT), aspartate aminotransferase (AST)]. The fourth aliquot was collected on vacutainer tubes containing Na2-EDTA for plasma preparation used for the assay of fasting plasma insulin (FPI), GzmB, IL-1β, and IRα. Hence, plasma samples were divided into several aliquots and kept at −80°C for subsequent enzyme linked immunosorbent assay (ELISA).
Laboratory analyses
FPG and serum biochemical parameters, including: triglycerides, total cholesterol, high density lipoprotein cholesterol (HDL-C), low density lipoprotein cholesterol (LDL-C), creatinine, BUN, ALT, and AST were measured using dimension RxL analyzer (Dade Behring) automated biochemistry analyzer. HbA1c% was measured in whole blood with ion-exchange high-performance liquid chromatography using the Bio-Rad D-10 system (Bio-Rad Laboratories).
FPI was quantified by ELISA technique using commercially available kit (Monobind, Inc.). The homeostasis model assessment of IR (HOMA-IR) was calculated from FPI and FPG by the following equation: HOMA-IR=fasting insulin (μU/mL)×FPG (mg/dL)/405 (Matthews and others 1985). The Quantitative insulin sensitivity check index (QUICKI) was calculated from FPI and FPG by the following equation: QUICKI=1/[log(fasting insulin)+log(FPG)] (Katz and others 2000).
Plasma GzmB, IL-1β, and IRα levels were determined by ELISA using commercially available kits: human GzmB ELISA kit (IBL International), AviBion human IL-1β ELISA kit (Orgenium Laboratories), and human IRα-subunit ELISA kit (Medical and Biological Laboratories Co., Ltd. All ELISA procedures were done by Hyprep ELISA system (Hyperion, Inc.) according to the manufacturer's instructions.
Statistical analysis
The IBM statistical package for social sciences (SPSS) statistics (V.19.0; IBM Corp.) was used for data analysis. Data were expressed as mean±standard error of the mean. Comparison between 2 independent mean groups was done using Student's t-test. More than 2 groups were compared by one-way analysis of variance using Bonferroni as post hoc test to compare individual groups. The general linear modeling was used to control for potential confounders (e.g., age, sex and BMI). Then, Pearson's correlation coefficient was used to assess the association between different variables. Finally, multiple stepwise linear regression analysis was performed to examine factors significantly associated with GzmB or IRα as a dependant variable. The probability of error at 0.05 was considered significant, while at 0.01 and 0.001 as highly significant.
Results
Group comparisons of the studied population
Anthropometric and laboratory characteristics of the studied subjects are shown in Table 1. Concerning FPI level, HOMA-IR index, and IL-1β there was a significant elevation in T2DM group compared to ND group (P<0.001). However, there was a significant decrease in QUICKI in T2DM group compared to ND group (P<0.001). As for plasma GzmB, as well as IRα levels, as depicted in Fig. 1 and Table 1, they were found to be significantly increased in T2DM patients as compared to ND subjects at P<0.001. Furthermore, as shown in Table 1, even after adjustment for the effects of covariates, such as age, sex or BMI, plasma GzmB, as well as IRα levels remained to be significantly different.
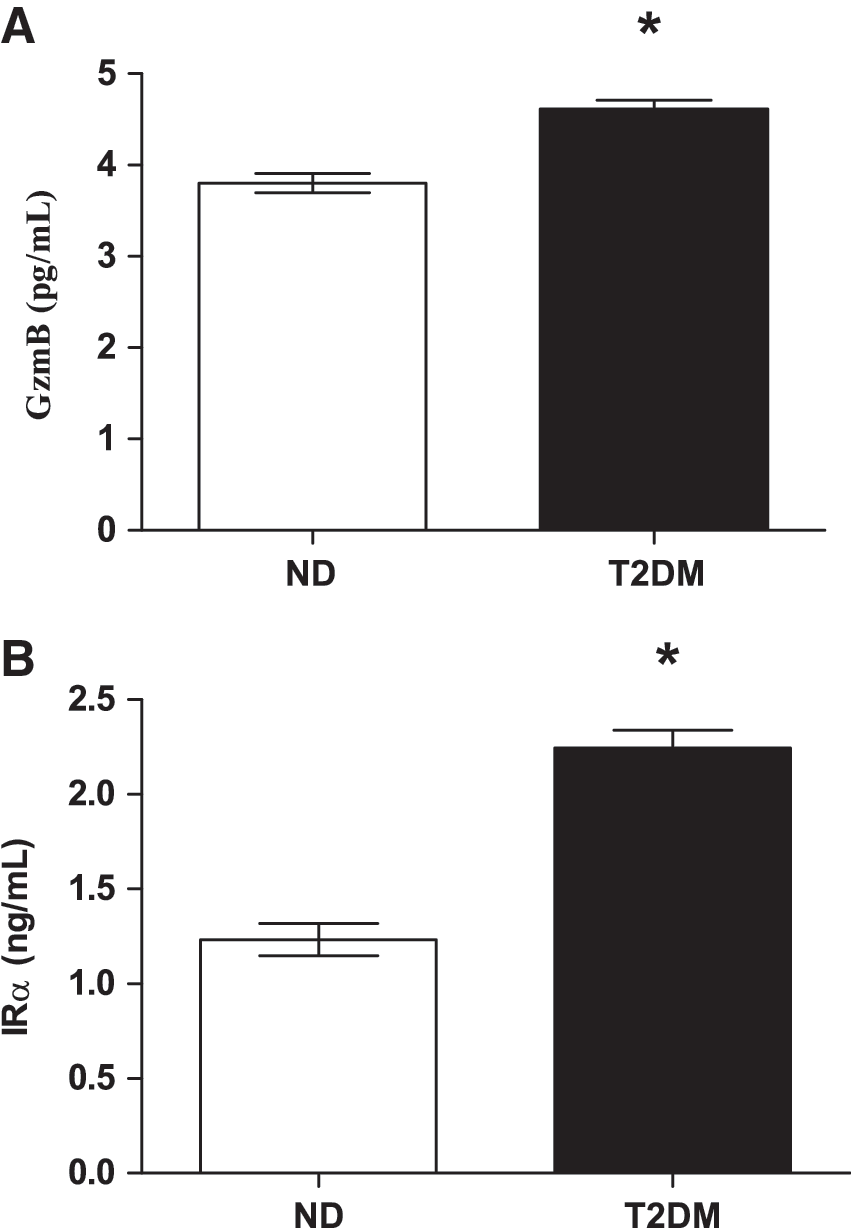
We further performed a subgroup analysis of plasma GzmB and IRα levels. Each of the ND and the T2DM groups were stratified for obesity according to their BMI into obese (BMI≥30 kg/m2) and lean (BMI<25 kg/m2) subgroups. As revealed in Table 2, plasma GzmB levels adjusted for the effects of covariates, such as age, sex, or BMI, showed a significant elevation in both T2DM subgroups as compared to lean ND group, as well as in the obese T2DM group as compared to the obese ND group (P<0.01). Additionally, obese T2DM showed a significantly elevated GzmB as compared to lean T2DM group. However, there was no significant difference either between the obese and lean ND groups or between the lean T2DM and the obese ND groups. Concerning IRα levels adjusted for the effects of covariates, such as age, sex or BMI, there was a significant elevation in IRα levels in both T2DM subgroups as compared to both ND subgroups (P<0.001). However, there was also no significant difference either between the obese and lean ND groups or between the obese and lean T2DM groups as depicted in Table 2. Moreover, it is worth noting that only the lean T2DM and obese T2DM groups showed a significant increase in WHR as compared to the lean ND subjects. WHR is a marker of central adiposity and insulin resistance as well. Such a significant increase in WHR was paralleled with a significant increase in GzmB and IRα; thus, may support an association of GzmB and IRα with WHR rather than with BMI that does not account for the wide variation in body fat distribution and waist circumference that best predicts total adiposity (Ross and others 1992).
Data were analyzed by one-way ANOVA using Bonferroni as post hoc test and are expressed as mean±SEM.
P<0.001 for obese ND group versus lean ND group.
P<0.001 for lean T2DM patients versus obese ND group.
P<0.001 for obese T2DM patients versus lean ND group.
P<0.001 for obese T2DM patients versus lean T2DM patients.
P<0.001 for lean T2DM patients versus lean ND group.
P<0.001 for obese T2DM patients versus obese ND group.
P<0.01 for obese T2DM patients versus obese ND group.
Calculated by general linear model with adjustment of age, sex, and BMI.
ANOVA, analysis of variance.
Association between anthropometric and metabolic parameters and GzmB/IRα
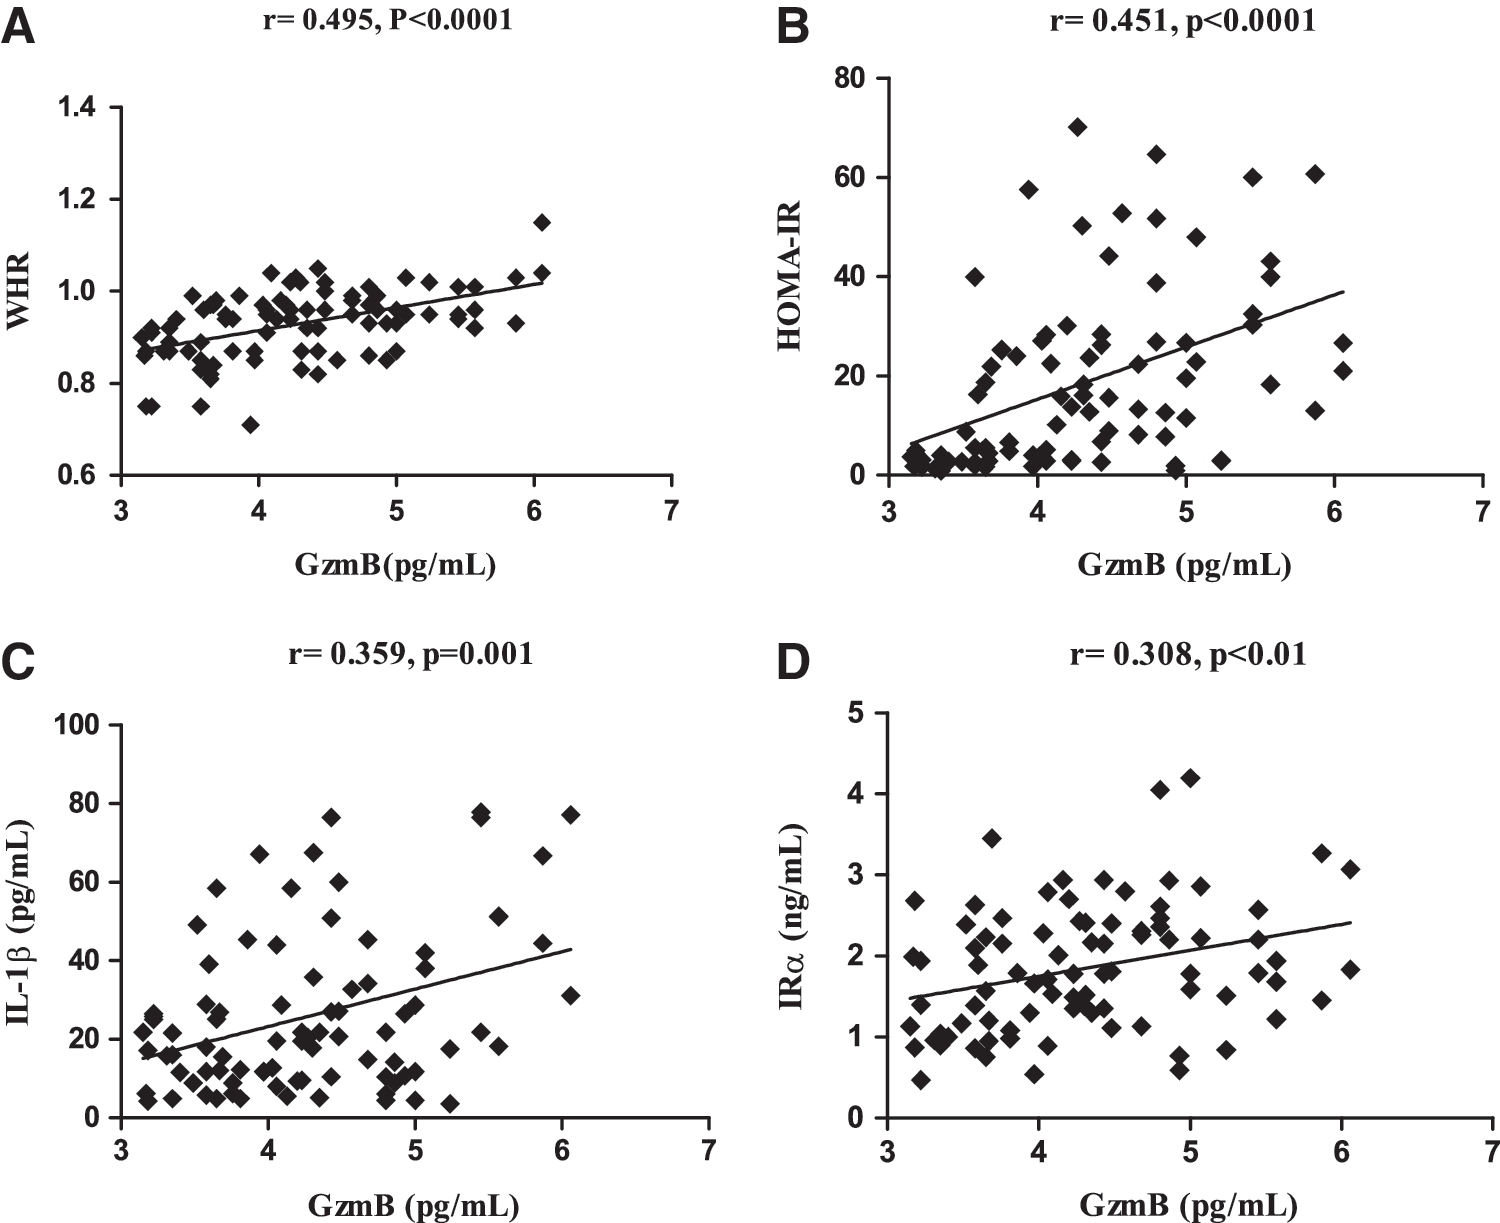
We further investigated the association between anthropometric and metabolic parameters and GzmB/IRα levels in the whole studied population. GzmB levels were significantly positively correlated with BMI, waist circumference, WHR, FPG, HbA1c%, FPI, HOMA-IR, triglycerides, total cholesterol, LDL-C, and negatively correlated with QUICKI (Table 3; Fig 2A, B). Additionally, IRα levels were significantly positively correlated with WHR, FPG, HbA1c%, FPI, HOMA-IR, triglycerides, LDL-C/HDL-C ratio, and negatively correlated with QUICKI (Table 3).
Correlation between GzmB and various parameters.
Significant at P<0.05 level.
Significant at P<0.01 level.
Significant at P<0.001 level.
NS, nonsignificant.
Correlation of GzmB with IL-1β and IRα
As illustrated in Fig. 2, GzmB was shown to be significantly positively correlated with both IL-1β (r=0.359, P=0.001) and IRα (r=0.308, P<0.01).
Multiple stepwise linear regression analysis for plasma GzmB and IRα levels in the whole studied population
Multiple stepwise linear regression analysis was performed to identify factors significantly associated with GzmB or IRα as a dependant variable. This analysis revealed that plasma GzmB is independently associated with T2DM (P<0.001) and WHR (P<0.01) (Table 4). Moreover, HbA1c% (P<0.001) and QUICKI (P<0.05) were predictors of IRα levels (Table 4).
Significant at P<0.001 level.
Significant at P<0.01 level.
Significant at P<0.05 level.
Discussion
It is now widely accepted that inflammation and insulin resistance are important hallmarks of T2DM (Donath and Shoelson 2011). Accordingly, finding out new pathways contributing to inflammation and insulin resistance would provide a better understanding of the disease and would open the door for new strategies for treatment.
Although GzmB was primarily studied as a potent proapoptotic molecule in CTL/NK-cell mediated killing, several lines of evidence now imply an alternative, extracellular role for this protease in multiple chronic inflammatory diseases (Boivin and others 2009; Hendel and others 2010). The interest of the scientific community in extracellular GzmB has been rapidly increasing during the last years with an accrual of evidence highlighting its diverse extracellular activities. Up to one-third of GzmB is released nonspecifically into the extracellular spaces from activated CTLs during target cell engagement/degranulation (Isaaz and others 1995). In addition, GzmB can be released constitutively by CLs in absence of target cell engagement (Prakash and others 2008). Indeed, extracellular levels of GzmB were observed to be elevated in body fluids in chronic inflammatory diseases, such as atherosclerosis, chronic obstructive pulmonary disease and rheumatoid arthritis (Tak and others 1999; Bratke and others 2004; Skjelland and others 2007; Boivin and others 2009; Kondo and others 2009). Moreover, a recent body of evidence has shown a causation of extracellular GzmB in chronic disease pathogenesis through extracellular matrix (ECM) cleavage (Chamberlain and others 2010; Ang and others 2011; Hiebert and others 2011). In the current study, plasma GzmB was evaluated for the first time in T2DM patients. Our data demonstrate that central obesity and T2DM significantly affected the level of GzmB in the investigated population.
With regards to T2DM, our study showed a significant elevation of plasma GzmB levels in patients with T2DM as compared to ND subjects. Our results came in accordance with the work of Ikemoto and others (2009) who disclosed that DM is a significant factor contributing to plasma GzmB levels in chronic renal failure patients. A possible explanation for this finding is that T2DM patients are under the condition of increased cellular protein kinase C (PKC) activity, while a PKC mediated mechanism was shown to be partially involved in GzmB expression (Tsuru and others 2008). Taken together, this supports the elevation of GzmB in T2DM patients. The evidenced increase of plasma GzmB levels in T2DM patients was further supported by the correlation with glucose/insulin metabolism alterations. Additionally, multivariate linear regression analysis further demonstrated that T2DM as independent factor influencing GzmB levels. A previous report has also shown that hyperglycemia causes the activation of CTLs (Stentz and Kitabchi 2003). Therefore, hyperglycemia can increase GzmB release as a result of its activation to CTLs.
Moreover, this study is the first to demonstrate that central obesity is associated with an increase in expressed GzmB plasma levels. Such increased levels might reflect a GzmB role in the induction of adipocyte apoptosis that is typically observed in advanced obesity and is associated with insulin resistance (Strissel and others 2007). Here we speculated that it might act as an effector molecule of CTLs in adipose tissue, while inducing insulin resistance. GzmB was found to be significantly correlated with obesity measures, namely BMI, waist circumference, and WHR. Interestingly, such correlation was better with waist circumference and WHR than with BMI, which indicates that GzmB relates more to central obesity that is strongly associated with insulin resistance and T2DM. Moreover, WHR remained to be significantly associated with GzmB on carrying out multivariate regression analysis that further adds more strength to the aforementioned correlation.
It is now recognized that GzmB can be expressed by other inflammatory cells (e.g., macrophages, mast cells, dendritic cells, basophils), as well as nonimmune cells [e.g., chondrocytes, smooth muscle cells, keratinocytes (reviewed by Hendel and others 2010)]. In obesity, we speculated that GzmB released from ARTs or activated macrophages might accumulate in the ECM in the obese adipose tissue causing ECM remodeling that contributes to the metabolic and inflammatory complication of obesity as T2DM (Strissel and others 2007). Previously, extracellular GzmB was suggested to play role in T2DM based on the current evidence of its role in inducing inflammation (Thomas and others 2010). Hence, in the current study, GzmB level was positively correlated with hyperglycemia, insulin resistance and inflammation. However, on performing multivariate regression analysis, GzmB level failed to be independently associated with IL-1β. Such finding came in agreement with Metkar and others (2008) who have shown that GzmA, another member of the Gzms family, rather than GzmB that releases IL-1β, they have not observed a consistently robust induction of proinflammatory cytokines by cells exposed to GzmB. It is also worth mentioning that although the plasma GzmB comes most likely from CLs, it is unlikely to represent the total extracellular pool of GzmB, because the highly cationic nature of the protease would promote binding to anionic components of the ECM on release by tissue CLs (Bird and others 2005). This would serve to localize GzmB to the vicinity of the CLs, and oppose the release of a soluble form into the circulation (Prakash and others 2008). Accordingly, we suggest that GzmB accumulated in the ECM during obesity might indirectly affect IL-1β through causing ECM cleavage, which results in active fragments that could induce macrophages to release inflammatory mediators and promotion of inflammation (Afonina and others 2010). Moreover, GzmB may still influence inflammation through affecting other cytokines as the activation of IL-1α and IL-18. Both are proinflammatory cytokines important to promote inflammation and GzmB increases their potency through their cleavage into their active fragments (Omoto and others 2010; Afonina and others 2011).
In the light of another evidenced extracellular role of GzmB in cleavage of surface molecules as receptors (Loeb and others 2006; Ganor and others 2007), our study was further substantiated to assess the level of IRα. Based on a new hypothesis of insulin resistance (DeLano and others 2010) which suggests insulin receptor cleavage by elevated protease activity both serine proteases and matrix metalloproteinases (MMPs), IRα levels were assessed in our studied population. In the current study, IRα plasma levels were significantly elevated in patients with T2DM as compared to ND subjects. This finding came in agreement with a study conducted by Obata and others (2007). Furthermore, IRα plasma levels were significantly positively correlated with glycemic parameters and insulin resistance markers: FPG, HbA1c%, insulin, HOMA-IR and negatively correlated with QUICKI. This gains further support by the same cited study that confirmed that hyperglycemia induces IRα release in STZ-induced-diabetic mice transgenically expressing human insulin receptor. In analogy with MMP, shown to be involved in the shedding of IRα (DeLano and others 2010), we suggest the involvement of GzmB in cleavage of insulin receptor ectodomain releasing IRα. According to our results, GzmB is significantly positively correlated with IRα. On performing multivariate regression analysis, both HbA1c% and QUICKI were found to be independently associated with the elevation of IRα. This confirms the strong relationship between blood glucose and IRα as previously highlighted by Obata and others (2007) and supports the hypothesis of decreased insulin sensitivity with the cleavage of insulin receptor.
Furthermore, it is worth mentioning that we found a correlation between IRα and WHR in our studied population. This finding is compatible with the previous finding of DeLano and others (2010) who declared that calorie overconsumption in rats caused insulin receptor cleavage. However, our finding remains the first declaring this relationship in T2DM patients. Intriguingly, on performing subgroup analysis according to BMI of IRα, no significant difference was found either between lean and obese ND subgroups or between lean and obese T2DM subgroups. This might suggest a relation between IRα to central adiposity rather than BMI which is a marker for general adiposity.
In conclusion, the novel finding in our study is that both obesity and T2DM contribute to the observed increased plasma GzmB levels. GzmB was also found to be correlated with insulin resistance, inflammation, and insulin receptor cleavage. Thus, GzmB could be a candidate molecule playing role in T2DM pathogenesis.
Footnotes
Acknowledgments
We want to express our deep appreciation to Medical and Biological Laboratories Co., Ltd., (Nagoya, Japan) for kindly offering reagents for the assay of human insulin receptor α-subunit.
Author Disclosure Statement
The authors declare that there is no conflict of interest that could be perceived as prejudicing the impartiality of the research reported.