
Abstract
Hepatitis C virus (HCV) is a global health problem, with an estimated prevalence of >185 million infections worldwide. About 399,000 people die every year because of HCV-associated liver complications such as liver cancer, liver cirrhosis, and hepatocellular carcinoma. Pakistan has the second-highest prevalence of HCV. The treatment of this life-threatening disease has always been a challenge, but the recent development of direct acting antivirals (DAAs) has offered hope to so many patients with this infection. Although DAAs have dramatically improved virologic clearance, their cost is prohibitive in low economic settings, which is why interferon (IFN) is still used in Pakistan and other developing countries. Many genes—specifically, interferon stimulating genes—alter treatment response. This study recruited 93 participants and used quantitative real-time polymerase chain reaction for the quantification of SOCS1 gene messenger RNA (mRNA) in the peripheral blood mononuclear cells of 5 different groups: IFN treated, IFN resistant, IFN nonresponders treated with DAAs, untreated, and healthy controls. A moderate positive correlation (rs = 0.492) was observed between viral load and SOCS1 mRNA expression level. Our results suggest the over-expression of SOCS1 in PBMCs of IFN non-responders as compared to responders and DAA treated IFN non-responders.
Introduction
H
Until recently, the recommended standard of care therapy for HCV patients was limited to subcutaneous pegylated interferon (IFN) and ribavirin, although this had poor efficacy and tolerability in the majority of patients, with survival rates <75% for HCV genotypes 2 or 3 and 40% for HCV genotypes 1 and 4 (Kemmer and Neff 2007; Palumbo 2011). Highly efficacious HCV treatment has been eagerly awaited for a long time due to the high relapse rate associated with IFN therapy, but the recent development of direct acting antivirals (DAAs) has revolutionized HCV therapeutics (Manns and others 2006; Zeuzem and others 2009). Furthermore, treatment outcomes vary in many patients due to a range of factors such as baseline viral load, HCV genotype, hepatic steatosis, host gene polymorphisms, and the expression of different genes (Navaneethan and others 2009; Zhu and Chen 2013).
This study investigated the expression of the SOCS1 gene in IFN-treated patients and IFN-ineligible sofosbuvir-treated patients. Suppressor of cytokine signaling (SOCS) genes plays an eminent role in the inhibition of cytokine signaling pathways and the regulation of both adaptive and innate immunity. These molecules are involved in dendritic cell activation, positive and negative regulation of macrophages, T-cell development, and differentiation. There is some evidence to suggest the involvement of SOCS proteins in immunodeficiency and autoimmune disorders. Cytokines play an important role in the functioning, differentiation, and development of lymphoid and myeloid cells. Cytokines, including hematopoietic growth factors, IFNs, and interleukins (ILs), act as an activator of the JAK/STAT signaling pathway because of their ability to activate the Janus kinase signal transducer. Cytokines trigger a large number of SOCS genes and inhibit cytokine signal transduction by a classic negative-feedback loop. Other stimuli that trigger SOCS proteins are cyclic adenosine monophosphate, isoproterenol, statins, and lipopolysaccharide (LPS). SOCS proteins are integral to many biological processes. For example, in the absence of cytokine signaling, SOCS1 expression is developmentally regulated in immature thymocytes.
The SOCS1 gene is member of the SOCS family that negatively regulates Toll-like receptor (TLR)-mediated signaling and cytokine receptor signaling. Several cytokines, specifically IFN-γ and IL-4, and TLR ligands such as CpG-DNA and LPS induce SOCS1 expression. The relationship between the SOCS1 expression level in peripheral blood mononuclear cells (PBMCs) and treatment outcome in HCV patients has not been fully studied. However, one study showed the upregulation of SOCS1 expression in IFN responder patients compared to IFN nonresponder patients. Therefore, this is the first study to investigate further the correlation of SOCS1 expression and HCV viral load in the PBMCs of IFN-treated, IFN-resistant, and IFN-resistant DAA-treated patients.
Materials and Methods
JAK/STAT signaling gene SOCS1 expression was analyzed in the PBMCs of HCV patients who were either treated with IFN or who were resistant to it. Real-time PCR (RT-PCR) was used to quantify the SOCS1 transcript level. The study further demonstrated the correlation between the SOCS1 transcript level with viral load, as well as the patients' response to HCV treatment. This work was carried out at the Division of Molecular Virology, Centre for Applied Molecular Biology, University of the Punjab, Lahore, Pakistan, in collaboration with Genome Centre for Molecular Based Diagnostics and Research, Lahore, Pakistan.
Collection of blood samples
A hundred patients with chronic hepatitis were treated at the Akhtar Mubarak Referral Centre, a welfare initiative by Association of Fatima Jinnah Old Graduates. The inclusion criterion was any HCV patient who had received IFN therapy. From October 2016 to April 2017, detailed patient interviews were conducted followed by clinical evaluation and laboratory tests to analyze different parameters. Twenty clinically healthy individuals (control group) and 11 patients who were infected with HCV but who had not received any treatment (untreated group) were also recruited to the study. Qualitative and quantitative analyses of HCV RNA as well as HCV genotyping were performed according to protocols previously described by Idrees (2008).
HCV-infected patients had received a fixed dose (180 μg/week) of pegylated IFN-α with ribavirin (1,000–1,200 mg/day) for 48 weeks. Some patients achieved a sustained virologic response (SVR); other patients did not show a response to treatment because their viral load did not clear, even after receiving 6 months of treatment. Response to IFN therapy was monitored by detecting the viral load during and after treatment. Patients were classified into 5 groups: healthy individuals, untreated patients, IFN responders, IFN nonresponders, and nonresponders who were being treated with DAAs (Table 1). Consent was obtained from all recruited patients. About 5 mL of blood collected in EDTA tubes was transported to the Division of Molecular Biology where fresh samples were processed for the isolation of PBMCs within 3–4 h of collection.
Isolation of PBMCs from blood
First, 5 mL of human venous blood was collected in heparinized vials that were gently inverted for thorough mixing. About 10 mL of Histopaque (Sigma–Aldrich) was added to a 50 mL centrifuge tube followed by a fine layer of blood on top of the Histopaque using a 1 mL micropipette. The layering was done very slowly to ensure the layers of blood and Histopaque were kept separate. The tubes were immediately centrifuged for 30 min at 2,000 rpm at 20°C in a swing-out rotor. A buffy coat (PBMCs) formed between the Histopaque and medium, which was aspirated and transferred to another tube. It is necessary to aspirate the cells quickly because the layer of PBMCs begins to settle if there is any delay. The cells were washed twice for 10 min at 3,000 rpm using 10 mL of phosphate-buffered saline. The approximate yield of cells from 5 mL of blood varied between 107 and 108.
RNA isolation
First, PBMCs were thawed by incubating them at room temperature for 10–20 min. About 1,000 μL of TRIzol™ Reagent (Invitrogen) was added to 300–500 μL of PBMCs followed by homogenization and incubation for 15 min at room temperature to enable the complete dissociation of nucleoprotein complexes.
Samples were than centrifuged at 13,000 rpm for 15 min, and cell debris was then removed. The supernatant was added to a new Eppendorf tube. Approximately, 500 μL of chloroform was added to the supernatant, and the sample was then centrifuged at 12,000 rpm for 15 min at 4°C, which separated the mixture into 3 layers. The upper aqueous phase was carefully transferred to a new Eppendorf tube because RNA is present in the aqueous layer. This RNA was first washed with 500 μL of isopropyl alcohol and then with 500 μL of 70% ethanol, with subsequent removal of the supernatant by centrifugation at 12,000 rpm for 10 min at 4°C and 7,500 rpm at 4°C for 5 min, respectively. Leftover ethanol was removed, and a RNA pellet that formed on the bottom of the Eppendorf tube was air-dried for 10 min. About 20 μL of diethyl pyrocarbonate-treated water was added to the RNA for complementary DNA (cDNA) synthesis.
cDNA synthesis
After extracting RNA from the PBMCs, cDNA was synthesized in the total reaction volume of 20 μL. Total cDNA was synthesized using primers listed in Table 1. System components of the cDNA kit (Fermentas; Thermo Fisher Scientific) were thawed and put on ice.
The RNA sample, primer, and deoxyribonucleotide triphosphate were mixed in sterile RNase-free microfuge tubes. The RNA was denatured at 70°C for 5 min followed by a short spin, and the samples were put promptly on ice because snap cooling gives an increased yield of cDNA for GC-rich RNA regions and long messenger RNAs (mRNAs). Then, 12 μL of reaction mixture containing 5× First-Strand buffer, ditheothreitol, Moloney murine leukemia virus reverse transcriptase, RNase inhibitor, and RNase free water was added to it followed by incubation at 42°C for 1 h and at 85°C for 5 min. Total 20 μL of cDNA was stored at −20°C (Table 2).
cDNA, complementary DNA; DEPC, diethyl pyrocarbonate; dNTP, deoxyribonucleotide triphosphate; DTT, dithiothreitol; MMLV (RT), Moloney murine leukemia virus reverse transcriptase; PCR, polymerase chain reaction.
The nested cDNA product was spectrophotometrically quantified using NanoDrop™ (Thermo Fisher Scientific). The HCV PCR product and 100-bp long DNA ladder were run on 1.5% agarose gel using ethidium bromide as the DNA stain, and the bands were then visualized using an ultraviolet transilluminator.
RT-PCR for analysis
The expression of the SOCS1 gene as well as a housekeeping gene (GAPDH), used as an internal control, was analyzed using RT-PCR (Rotor-Gene Q; Qiagen) based on the use of SYBR Green (Fermentas; Thermo Fisher Scientific) following the protocol described in Table 3. The expression was analyzed by calculating the threshold cycle (ΔCt) of GAPDH (reference gene) and SOCS1 (target gene).
The reaction mixture was first denatured at 94°C for 3 min. Then 35 cycles of PCR were performed using the following protocol: 94°C for 30 s, 56.7°C for 30 s, 72°C for 30 s, followed by final extension at 72°C for 10 min.
All cDNA samples were diluted to make a total concentration of 500 ng/μL.
The relative mRNA expression level was obtained through normalization of the mRNA level of each selected gene of interest with GAPDH as the reference gene. The expression of the target genes in each sample was tested in triplicate. Amplification efficiencies and CT values for the housekeeping gene (GAPDH) and the target gene (SOCS1) were compared to determine their equivalence. The calculated ΔCt value (target gene CT – housekeeping gene CT) shows the mRNA expression level. The relative quantification of SOCS1 transcription between the different study groups was calculated using the comparative method 2−ΔΔCt (Livak and Schmittgen 2001; Schmittgen and Livak 2008).
Statistical analysis
Results of clinical parameters and demographic characteristics are presented as the mean and standard deviation. Association between categorical variables was studied using the chi-square test. Spearman's test was used to determine the correlation between viral load and ΔCt. P values <0.05 were considered statistically significant. Data analysis was performed with IBM SPSS v21.
Results
In total, 82 patients were recruited, and 8 healthy controls were also included. Ten patients were untreated because they were infected with HCV but had not received any treatment. Forty-three patients were responders to IFN therapy, whereas 25 patients experienced HCV relapse, even after attaining SVR. Four of those then underwent treatment with a DAA regimen (sofosbuvir + ribavirin). All patients were infected with HCV genotype 3a, whereas only 3 nonresponders were cirrhotic. The main demographic characteristics, clinical parameters, and major findings are listed in Table 4.
ΔCt, calculating threshold cycle; Al, albumin; ALP, alkaline phosphatase; ALT, alanine aminotransferase; AST, aspartate aminotransferase; Bl, bilirubin; BMI, body mass index; DAA, direct acting antiviral; Hb, hemoglobin; IFN, interferon; Pt, platelets; WBC, white blood cell.
Of the 82 patients included in this study, the prevalence of HCV was found to be significantly higher in females (61; 67.77%) than in males (29; 32.22%). However, this difference was not significant between the different study groups. The HCV clearance rate was also higher in females than in males based on the fact that >74% of IFN responders were female. The majority of patients were <40 years old, with the lowest prevalence observed in elderly patients. Moreover, a higher percentage of nonresponder patients were older (i.e., >60 years), thereby confirming that age is another predictor of failed response to treatment.
The findings show that Spearman's correlation coefficient (rs ) is 0.492, which is statistically significant (P = 0.012). This indicates a moderate positive correlation between viral load and expression level of the SOCS1 gene; R 2 linear = 0.221 and rs = 0.492 show that SOCS1 expression increased with the increase in viral load. This finding indicates that a high viral load is a predictor of treatment failure because the expression of SOCS1 was found to be highest in nonresponder patients who experienced HCV relapse, even after completion of IFN therapy (Fig. 1).
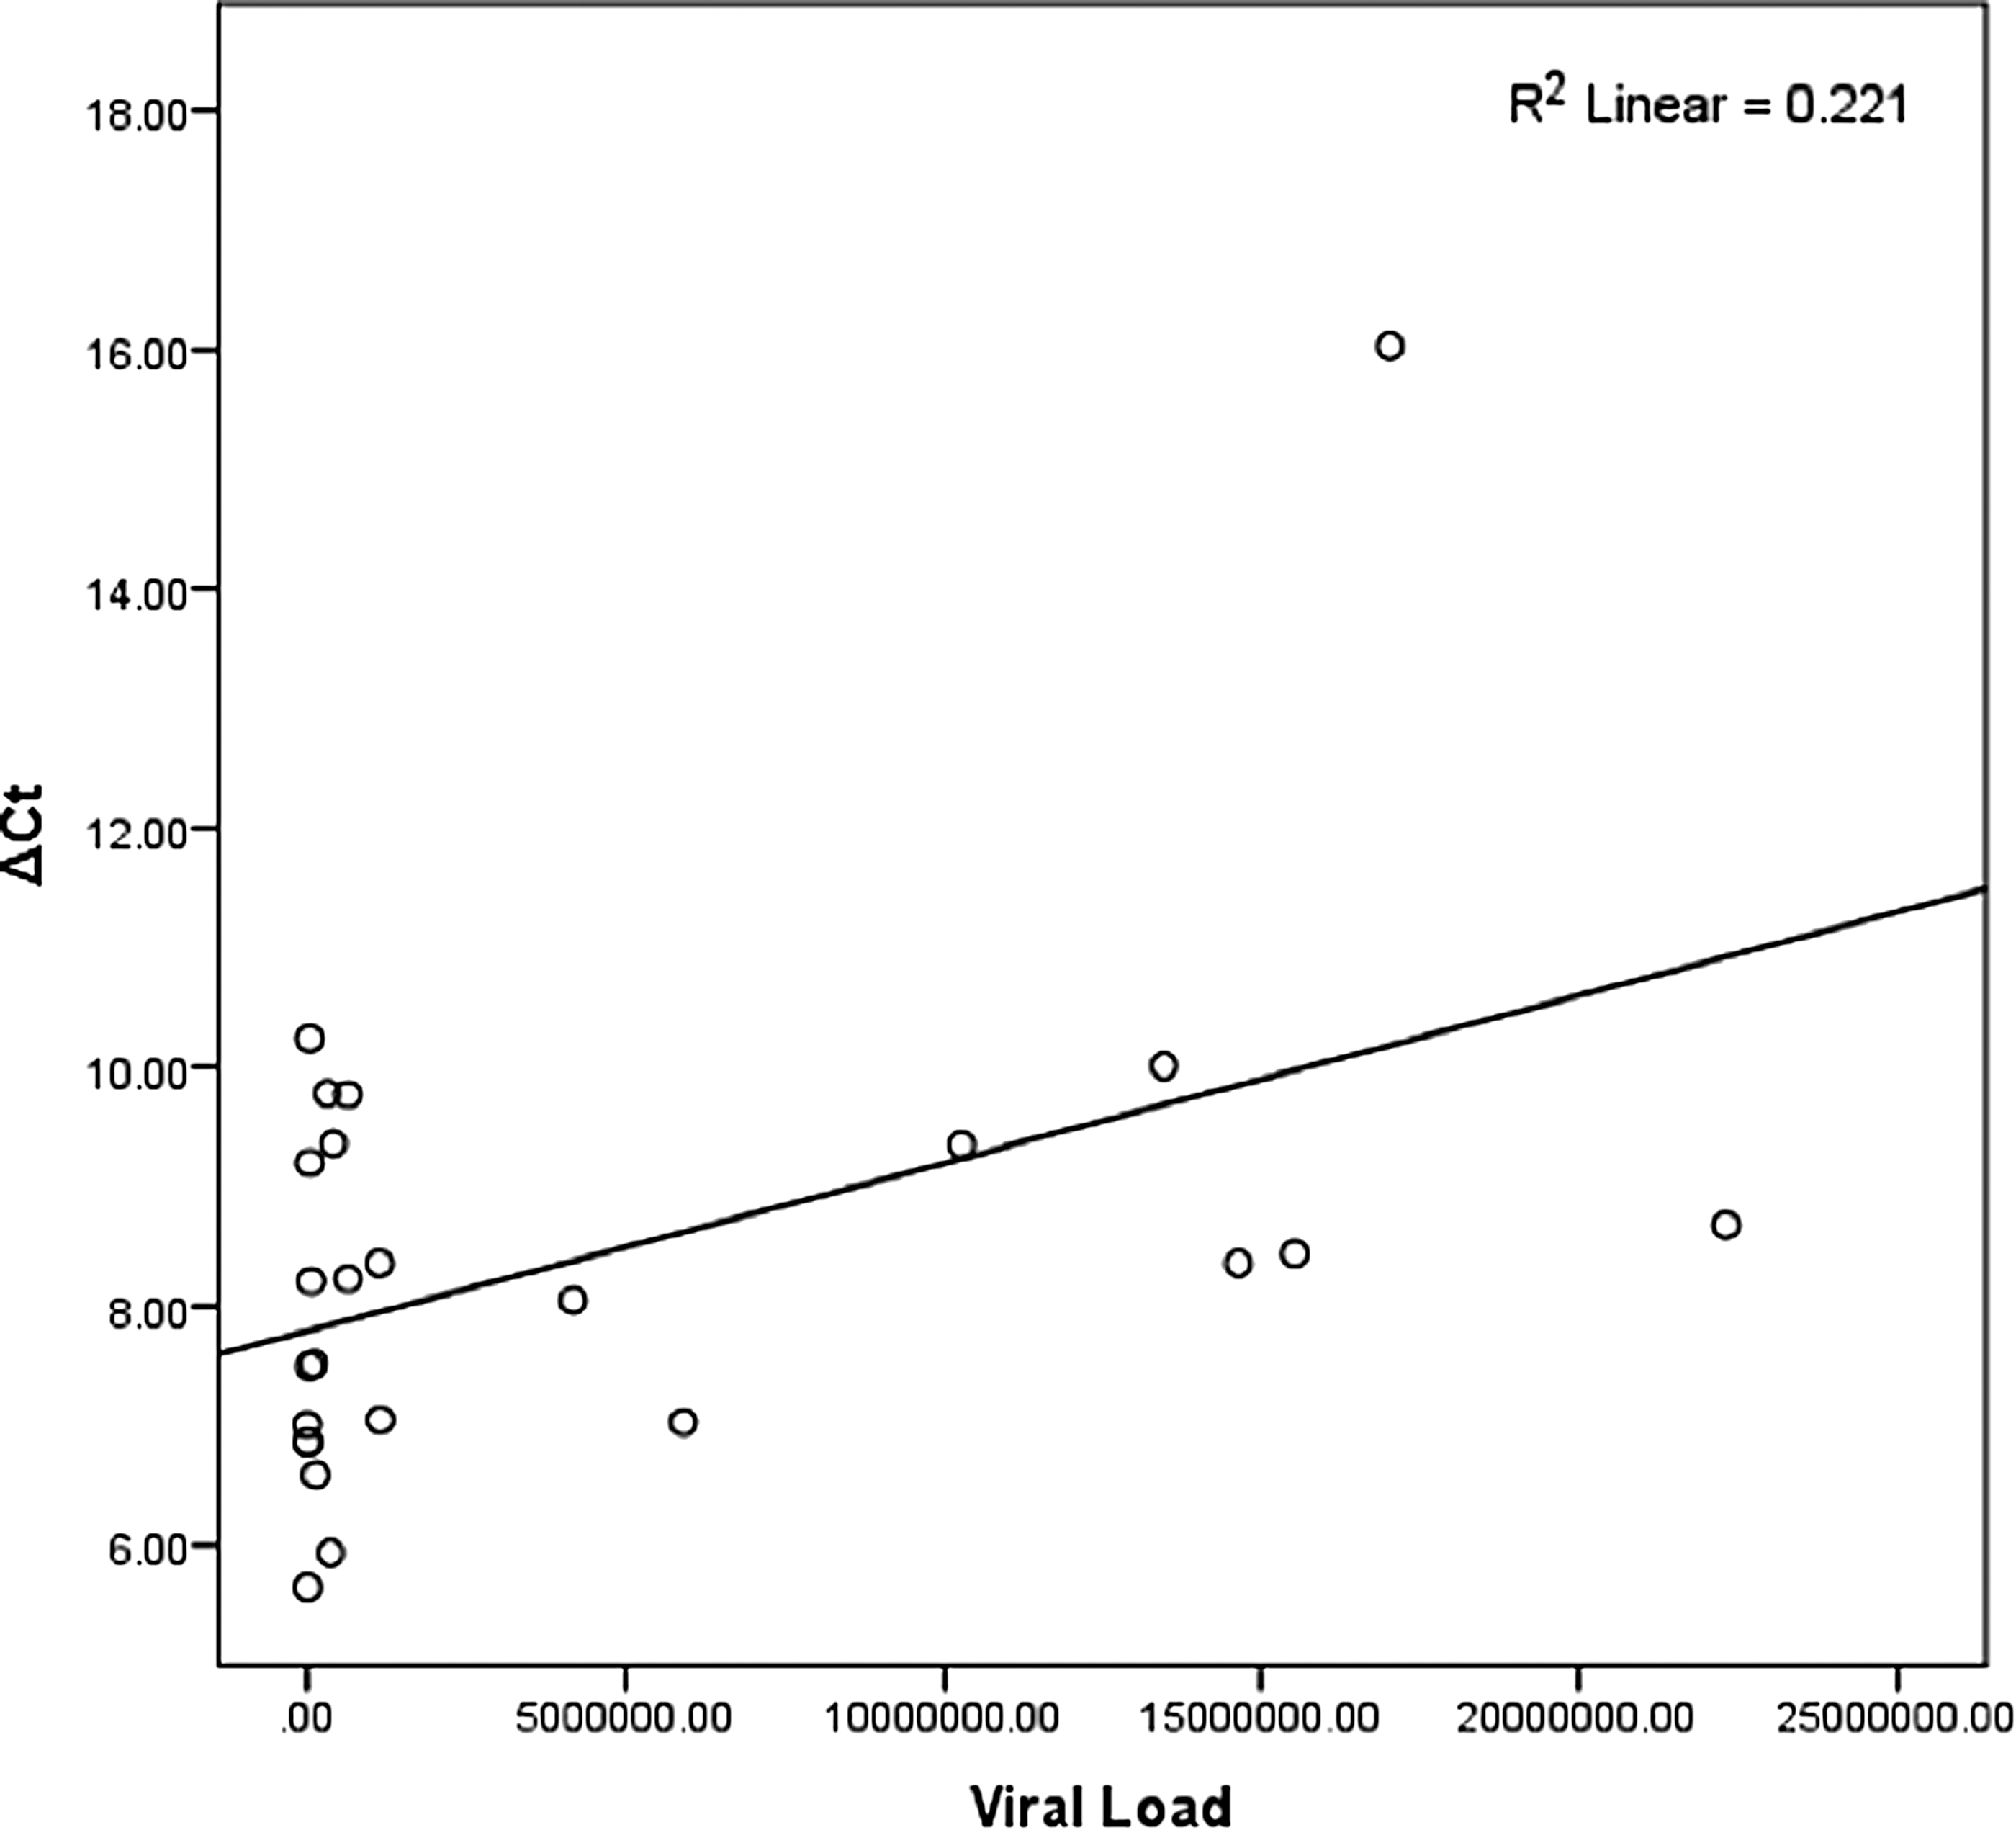
Spearman's correlation coefficient graph showing an association between gene expression and viral load.
Discussion
A major goal of research in HCV therapeutics has been to determine the predictors of treatment response. Until recently, the standard of care for treating HCV was IFN. However, the high rate of HCV relapse in IFN-treated patients and other side effects necessitated the development of an effective treatment, and the recent development of IFN-free regimens or DAA has revolutionized HCV therapeutics. However, due to high cost associated with DAA, IFN treatment is still being used in developing and underdeveloped countries such as Pakistan. IFN induces the expression of a large number of genes that exerts an antiviral state through activators of transcription (STAT) signaling and Jak kinase (JAK)/signal transducers (Stark and others 1998). This is the first study to evaluate the expression of the SOCS1 gene in the PBMCs of IFN responders as well as IFN nonresponders now receiving DAA. No significant difference was found between the clinical parameters and liver profile of IFN-treated, untreated, and DAA-treated patients. SOCS1 expression in IFN-treated patients was nearly equal to that in healthy controls, whereas SOCS1 expression was upregulated in IFN nonresponders and in IFN nonresponders treated with DAA. Furthermore, this study is the first to provide evidence of a direct correlation of viral load with gene expression.
It was observed that SOCS1 expression level in PBMCs was negatively associated with treatment outcomes. In contrast to the findings previously reported by Lee and others (2016), this study showed upregulation of the SOCS1 gene in the treatment of nonresponders after treatment with IFN. Furthermore, the study also revealed the positive correlation between SOCS1 expression level and viral load. These findings contradict those previously reported by Sedeño-Monge and others (2010) and Lee and others (2016). Significantly high upregulation of SOCS1 expression was observed in nonresponders compared to responders, but the other 2 studies showed a nonsignificant difference in SOCS1 expression between responders and nonresponders. The study by Sedeño-Monge and others (2010) also showed that expression of SOCS1 differs according to HCV genotype.
The results of the present study corroborate the previously reported findings of Liu and others (2015) who reported higher SOCS1 expression in the PBMCs of nonresponders than in those of responders. Liu and others found that there are significant differences in SOCS1 expression patterns in Huh-7.5.1 cells following stimulation with IFN-α and IFN-λ. The study further confirmed that SOCS1 overexpression abrogated the anti-HCV effect of both IFN-α and IFN-λ. It has been demonstrated that mRNAs for genes such as SOCS1 and SOCS3 that suppress antiviral activity are highly expressed immediately after the administration of IFN in an unfavorable IL28B genotype (Iijima and others 2015). Another study revealed the induction of the expression of several different interferon stimulating genes (ISGs) higher in SVR than in non-virologic response (Asahina and others 2008). Viral infections induce the expression of negative regulators of IFN signaling, that is, SOCS genes lead to the inhibition of the phosphorylation of both STAT and IFN proteins (Frey and others 2009) and the downregulation of the transcription of ISGs through inactivation of Jak kinase (Wormald and Hilton 2004). Conversely, transfection of SOCS1 HCV core protein in the mouse liver has been found to silence the transcription of SOCS1 and results in permanent activation of the Jak/Stat signaling pathway (Brand and others 2005; Miyoshi and others 2005). In the same way, silencing of SOCS1 gene transcription has been found in the liver of HCC and chronic hepatitis C patients (Yoshikawa and others 2001).
Host factors or demographic characteristics of patients such as age, sex, ethnicity, body mass index (BMI), life-style, genetic diversity, histological parameters, and liver function enzymes are associated with a variable treatment response (Navaneethan and others 2009; Thomas 2012).
In accordance with the findings of Bakr and others (2006), the clearance rate was found to be higher in females than in males. Similar to several other studies (Tracy and others 2014; Clifford and others 2017), a significantly higher prevalence of females was also observed in this study. However, some studies showed that sex has no influence on achieving SVR (Fried 2002; Manns and others 2006).
A higher prevalence of HCV was found in people <40 years, but it was observed that the majority of nonresponders were >60 years old, which supports the findings of a large number of studies conducted in different regions of Pakistan as well as worldwide (Tariq and others 1999; Anwar and others 2013; Rasheed and others 2014). Age is a predictor of treatment response, with the majority of elderly patients (>60 years) falling into the nonresponder group in the present study. This finding is in line with the previous studies that also showed the SVR rate to be higher in younger patients (<40 years old; Manns and others 2001; Fried and others 2002). Immunologic suppression, other medications, and diseases impair the response to IFN therapy (Hadziyannis and others 2004). The BMI of healthy controls was significantly higher than that in the HCV-infected groups. Ortiz and others (2002) reported liver fibrosis in obese people with a BMI ≥25 kg/m2. An abnormally high BMI is associated with treatment failure and liver complications (Hickman and others 2003). However, in contrast to the present finding, a recent large-scale study demonstrated that there was no association between BMI and treatment response (Jacobson and others 2007; Cavalcante and Lyra 2015). Finally, the present study showed a correlation between SOCS1 expression and viral load. None of the various analyses found statistically significant different clinical parameters in different study groups.
Conclusion
SOCS proteins negatively regulate inflammatory signaling pathways by facilitating proteosomal degradation and ubiquitination of pathway machinery. HCV triggers robust host SOCS protein expression after infection, essentially hijacking SOCS function to promote virus survival. The present results showed SOCS1 overexpression in the PBMCs of IFN nonresponders compared to responders and DAA-treated IFN nonresponders. The study also revealed the positive correlation between gene expression and viral load.
Footnotes
Acknowledgments
The authors thank the Genome Centre for Molecular Based Diagnostics and Research, Lahore, Pakistan. They also thank Mr. Murad Khan and Mr. Sajjad Khan for their collaboration.
Author Disclosure Statement
No competing financial interests exist.