




Abstract
Cytokines have an important role in mounting effective host immune response against mycobacteria. Latent tuberculosis infection (LTBI) is an indication of containment of mycobacteria by the host immune response, whereas active TB is an indication of a failure of the immune response to contain Mycobacterium tuberculosis. The dynamics of this host-immune response during in vitro infection experiment is believed to be indicative of behavior in the LTBI and active-TB cases. This relationship is, however, not fully elucidated. We investigated the cytokines expression at mRNA and protein level across 2 different protocols, that is, an in vitro protocol comparing human monocyte-derived macrophages (hMDMs; n = 12) infected with different species of mycobacteria, and a clinical protocol comparing TB-Antigen-Nil specimens from LTBI (n = 12) and active-TB (n = 12) cases. We found that in vitro infection of hMDMs with Mycobacterium bovis Bacillus Calmette–Guérin (BCG) and M. tuberculosis R179 showed increased colony-forming units at all time points postinfection. M. bovis BCG-infected hMDMs demonstrated higher levels of 5 cytokines [interferon (IFN)-γ, interleukin (IL)-6, IL-1β, IL-12p40, and IL-12p70] at different intervals compared to M. tuberculosis R179. Compared to LTBI, active-TB cases had higher mRNA expression of IFN-α, IL-6, and IL-8, and lower expression of IFN-γ, IL-1α, IL-1β, IL-4, and tumor necrosis factor-α. Overall, we observed differential host responses at mRNA and protein levels during experimentally controlled in vitro infection, but no prominent differences were observed in the clinical protocol. Therefore, the result of the in vitro experiment model of cytokine response against mycobacteria should be interpreted cautiously when relating to LTBI and active-TB.
Introduction
Tuberculosis (TB) is caused by Mycobacterium tuberculosis and continues to be number one infectious diseases claiming millions of lives each year. It is estimated that about one-quarter of the global population is infected with M. tuberculosis without showing symptoms (latent infection), and only 10% of these infected cases develop active diseases during their lifetime (World Health Organization 2019). The majority of (∼90%) infected cases never develop active disease, indicating that the human immune system can mount an effective defence against M. tuberculosis.
Macrophages mount the first line of defence against mycobacteria, and expression of major cytokines such as GM-CSF, IL-3, and interferon (IFN)-γ implicates the vital host-immune response (Arango Duque and Descoteaux 2014). These cytokines are responsible for recruitment and induction of immune cells by increasing macrophage activity with the help of cytokines secreted from helper T cells (such as, IFN γ as the most prominent macrophage activators). (Kany and others 2019).
It is evident that over different time points, expression of cytokines elicits an effective immune response to counter the nonpathogenic species of mycobacteria but the immune response of these cytokines minimize for pathogenic species. Although many studies have measured the in vitro cytokine expression against infection of mycobacterial species, there remain several knowledge gaps that need to be addressed.
The in vitro infection experiments using human monocyte-derived macrophages (hMDMs) infected with mycobacteria is one of the models to study the host immune response. However, the immune response measured in plasma of TB and latent TB infection (LTBI) cases ought to differ compared to in vitro experiments due to the milieu of numerous immunological factors. The manifestation of infection in the in vitro experiments (which is designed to mimic the in vivo infections) is known to be under controlled laboratory environments such as temperature, culture media, multiplicity of infection (MOI) etc.
The various changes in the cytokine levels (up/down regulation) during in vitro infection experiments of macrophages with different mycobacterial species compared to plasma levels of cases with active-TB and LTBI is still unclear. Also, the time dependant in vitro cytokines expression and correlation between steady state mRNA expression and protein translation is understudied.
We, therefore investigated the secretion and mRNA expression of a panel of cytokines using (1) an in vitro protocol, that is, cell culture of hMDMs infected with different species of mycobacteria (M. smegmatis, M. bovis Bacillus Calmette–Guérin (BCG), and M. tuberculosis R179) and (2) a clinical protocol using specimens from active-TB and LTBI cases. For both protocols, we used multiplex enzyme-linked immunosorbent assay (ELISA) using Luminex platform and quantitative real time polymerase chain reaction (qRT-PCR).
Methods
Enrolment of study participants
For the in vitro protocol, healthy participants were screened for any symptoms of TB. Participants with cavities on chest X-ray, night sweats, recent unexplained weight loss, persistent cough, and fever were excluded. Additional exclusion criteria included the use of any strong medication (including antibiotics), major surgery in the recent past (6 months–1 year), pregnancy, anemia, and insomnia. In addition, we aimed to select equal representation of gender and ethnicity. We screened 26 individuals, out of which 14 were excluded (Fig. 1). Twelve healthy participants with no history of active TB were enrolled.
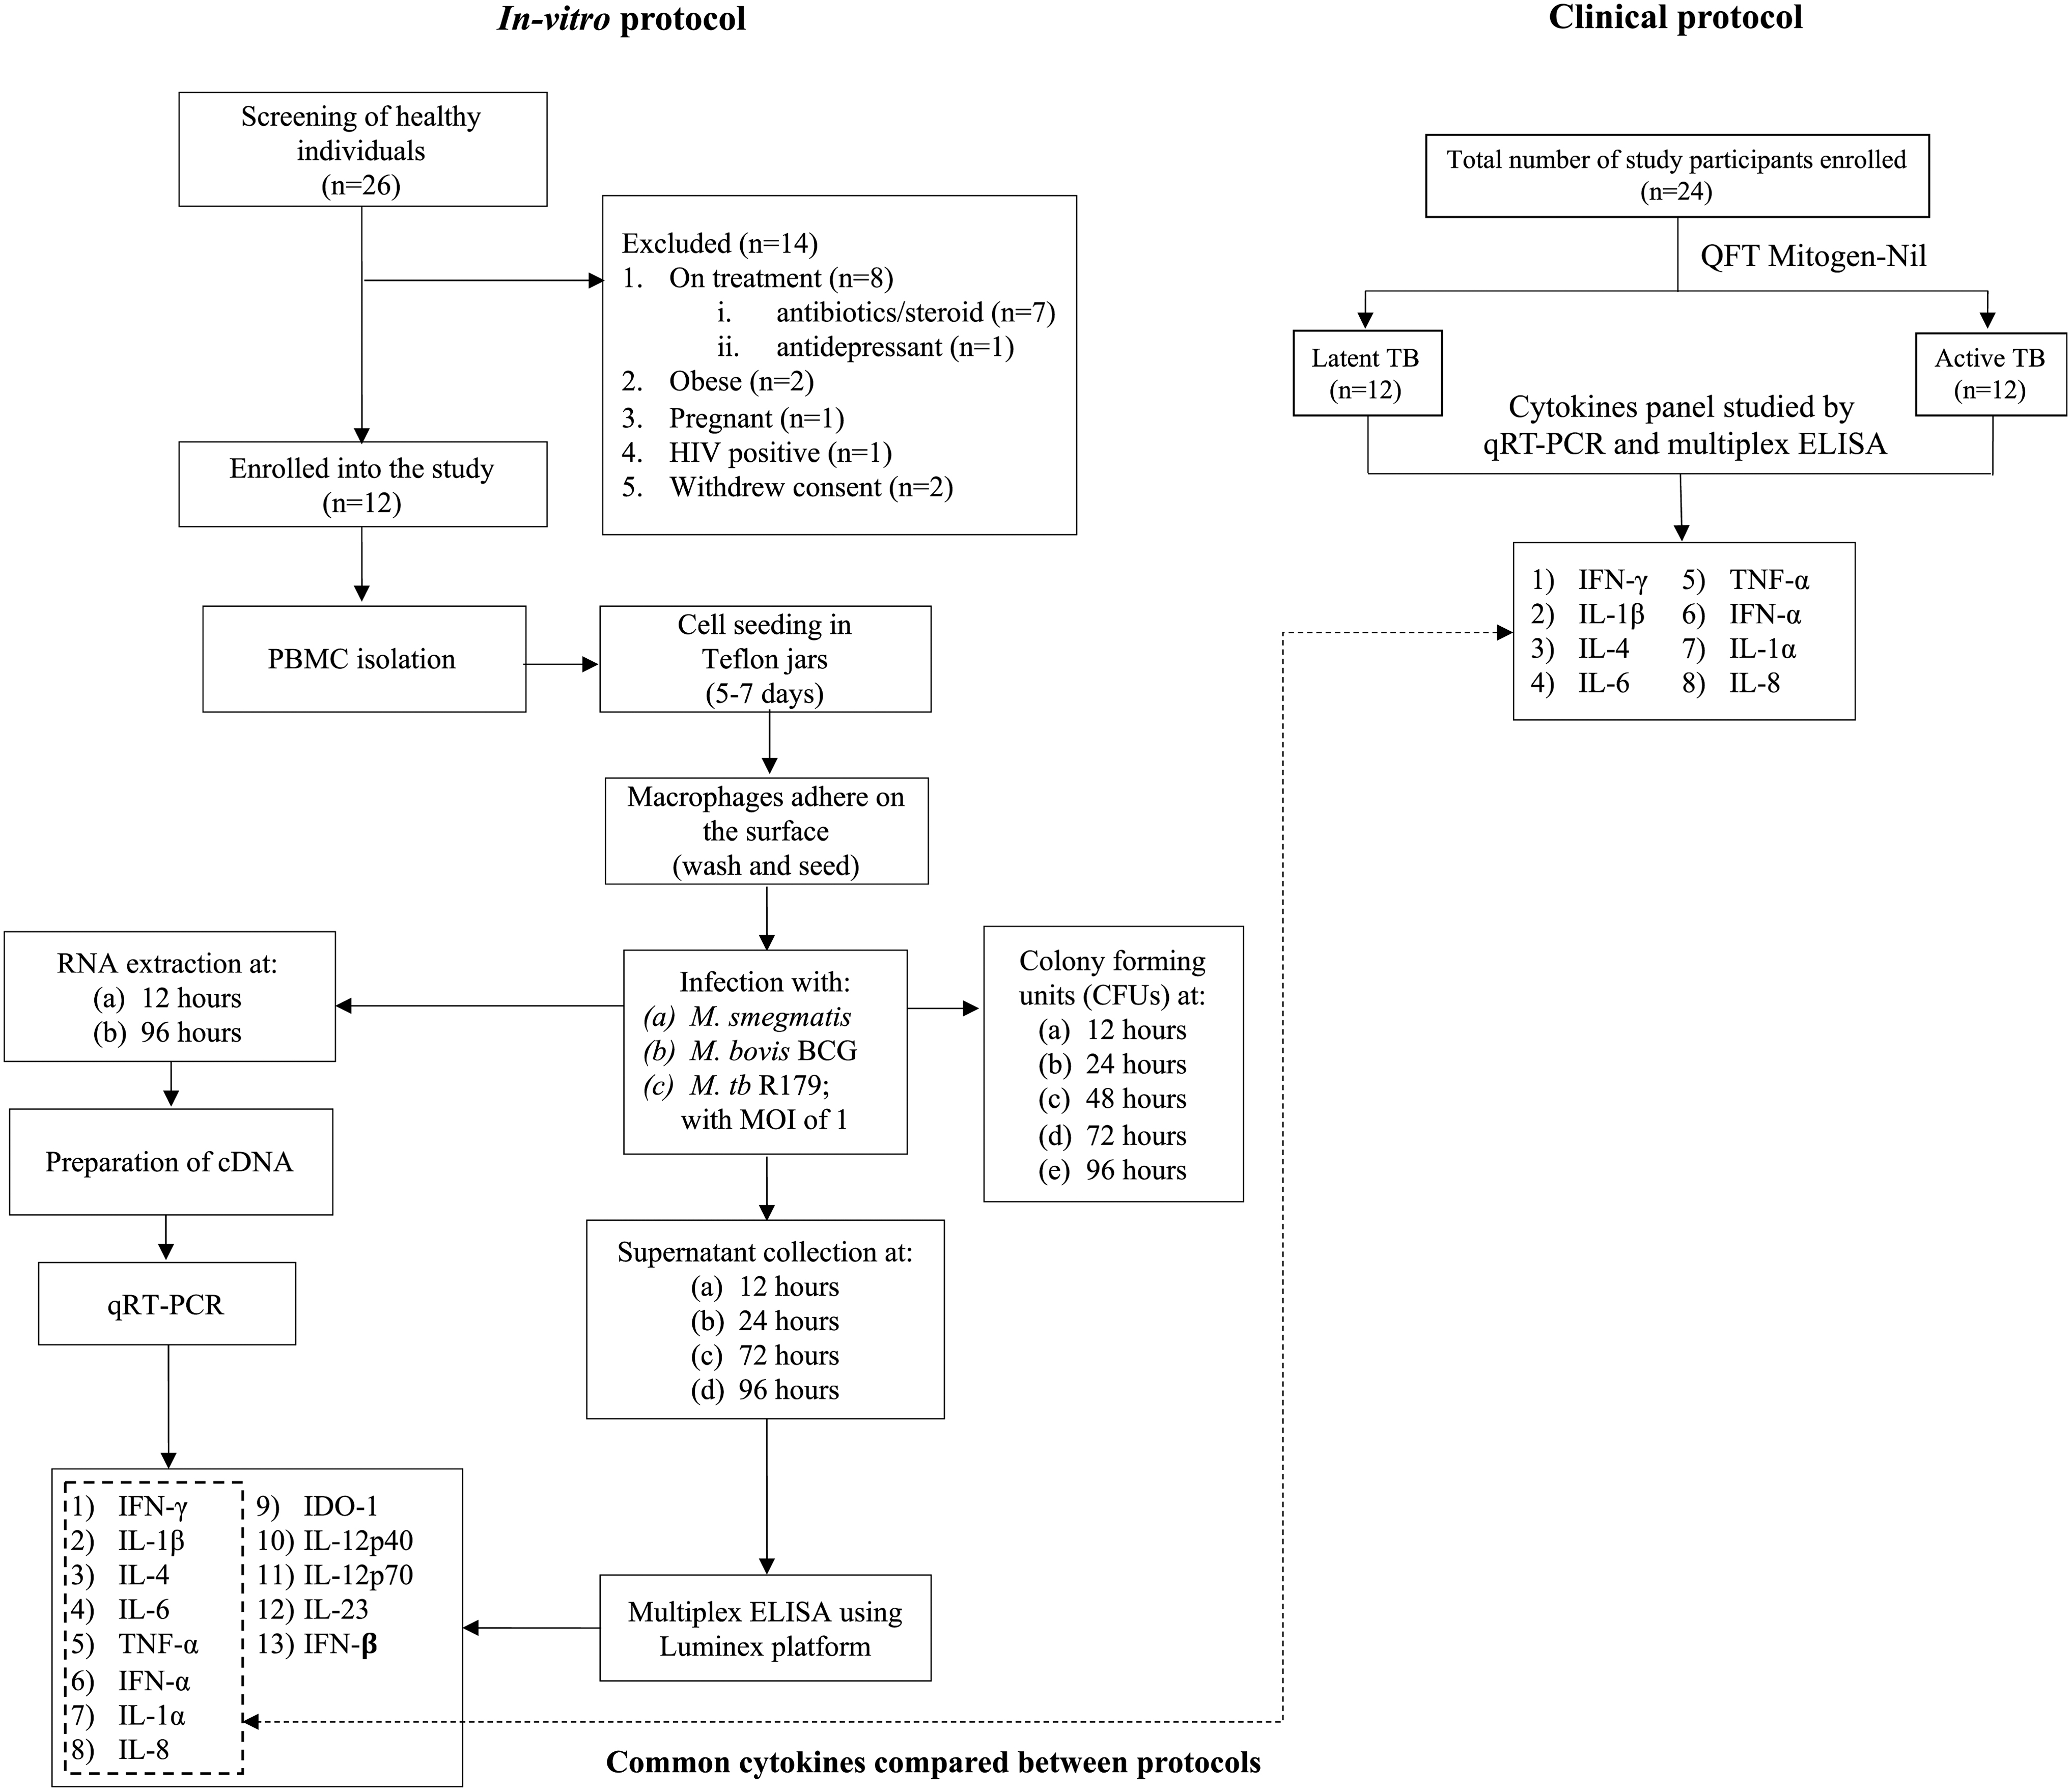
Flowchart depicting methodology adopted for in vitro and clinical protocol. BCG, Bacillus Calmette-Guérin; CFUs, colony-forming units; ELISA, enzyme-linked immunosorbent assay; HIV, human immunodeficiency virus; IDO, indoleamine 2,3-dioxygenase; IFN, interferon; IL, interleukin; MOI, multiplicity of infection; PBMC, peripheral blood mononuclear cells; RNA, ribose nucleic acid; TNF, tumor necrosis factor.
For the clinical protocol, archived cDNA samples (at −20°C) for TB (n = 12, active TB cases with no TB treatment in the previous 90 days) and LTBI (n = 12) cases were a subsample of previously published multiplex ELISA data (Manngo and others 2019). qRT-PCR was performed for a panel of 8 different mRNAs [IL-1α, IL-β, IL-4, IL-6, IL-8, IFN-α, IFN-γ, and tumor necrosis factor (TNF-α)] from the archived cDNA samples (Supplementary Fig. S6).
Ethics permission
Ethical approval for the study was obtained from the Health Research Ethics Committee (HREC), Stellenbosch University, Tygerberg campus, Cape Town (in vitro infection protocol: HREC reference #S17/10/211, clinical protocol: HREC reference: N16/05/070).
Cell isolation and culture medium
For the in vitro infection protocol, venous blood (80 mL) was collected into heparin Vacutainers (Lasec, South Africa). Using Ficoll separation method, the buffy coat was obtained by centrifugation (at 400 g for 30 min without brake). Macrophage-like cells were isolated under culture conditions that allow differentiation of monocytes into macrophages, that is, by culturing in Teflon-coated culture flasks (De Bruyn Spectroscopic solutions, Cat. No. 100-0120-01-Savillex) using RPMI-1640 (Gibco Life Technologies, MA) medium supplemented with 20% heparinized plasma and incubated at 37°C under 5% CO2 for 5 days.
After 5 days of the culture differentiation (ie, when monocytes derived into macrophages), the cells in Teflon suspension culture were washed with RPMI-HEPES (with L-glutamine and 25 mM HEPES) buffer (Sigma Aldrich, Darmstadt, Germany) and incubated in 12-well culture plates for 2 h at 37°C under 5% CO2 for adherence of hMDMs (otherwise lymphocytes will be difficult to remove) (Restrepo and others 2014). For infection experiments, human macrophage cells were seeded in 12-well plates with 0.7 × 10⁶ cells per well.
Infection with mycobacteria
Pathogenic (M. tuberculosis R179) and nonpathogenic (M. smegmatis and M. bovis BCG) species of mycobacteria were used for in vitro infection. Mycobacteria were cultured in 7H9 media (Sigma Aldrich) supplemented with 10% oleic albumin dextrose catalase (Sigma Aldrich) and 0.5% glycerol. All 3 mycobacterial species were cultured in detergent-free media for infection, since Tween-80 is known to affect the rate at which macrophages ingest M. tuberculosis and form phagosomes as well as the subsequent immune response to M. tuberculosis (Leisching and others 2016).
A syringe-settle-filtrate (SSF) method was performed to disaggregate the mycobacteria grown in detergent-free media. Stock cultures of mycobacteria stored at −80°C were thawed and disaggregated by pipetting 10 times with a 1 mL tip. Subsequently, the solution was passed through a 25-gauge needle 20 times (Stokes and others 2004) and any remaining aggregate was allowed to settle for up to 1 min (Cywes and others 1997).
The settling time was different for each species (M. smegmatis, 30 s; M. bovis BCG, 1 min; M. tuberculosis R179, 1 min). The top 750 μL of the settled solution was collected and added to 4.25 mL of RPMI-glutamine media. This 5 mL bacterial suspension was then immediately filtered through 5.0 μm pore size filter (Merck Millipore, Germany) to which 10% human plasma (DD Biolab, Barcelona, Espana) was added as a final concentration. This method was performed in our laboratory earlier to determine the effect of culturing the mycobacteria in the absence of a detergent compared to its presence (Leisching and others 2016).
hMDMs were infected separately with each mycobacterial strain at MOI of 1. After 4 h of infection, cells were washed 3 times with PBS to remove any extracellular mycobacteria. Cells were then incubated for another 8 h under 5% CO2 at 37°C. Uninfected hMDMs served as a control. Mycobacterial infected cells were then plated for colony-forming units (CFUs) and processed for RNA extraction. Culture supernatants were collected for measurement of cytokine levels using the Luminex platform (Biocom, Cat. No. PPX-12) (Fig. 1).
Determination of bacterial uptake
CFUs were determined in hMDMs infected with M. smegmatis, M. bovis BCG, and M. tuberculosis R179 mycobacterial species. Infected cells were lysed using 0.1% Triton X-100 (Sigma Aldrich, Cat No. T8787). Bacterial uptake was determined by serial dilution (10−1–10−4) and plating out of mycobacteria onto 7H11 agar plates. Mycobacterial uptake was measured at 4 h (Supplementary Fig. S5) and the mycobacteria survival within the infected cells was monitored at 12 and 24 h postinfection (Fig. 2).
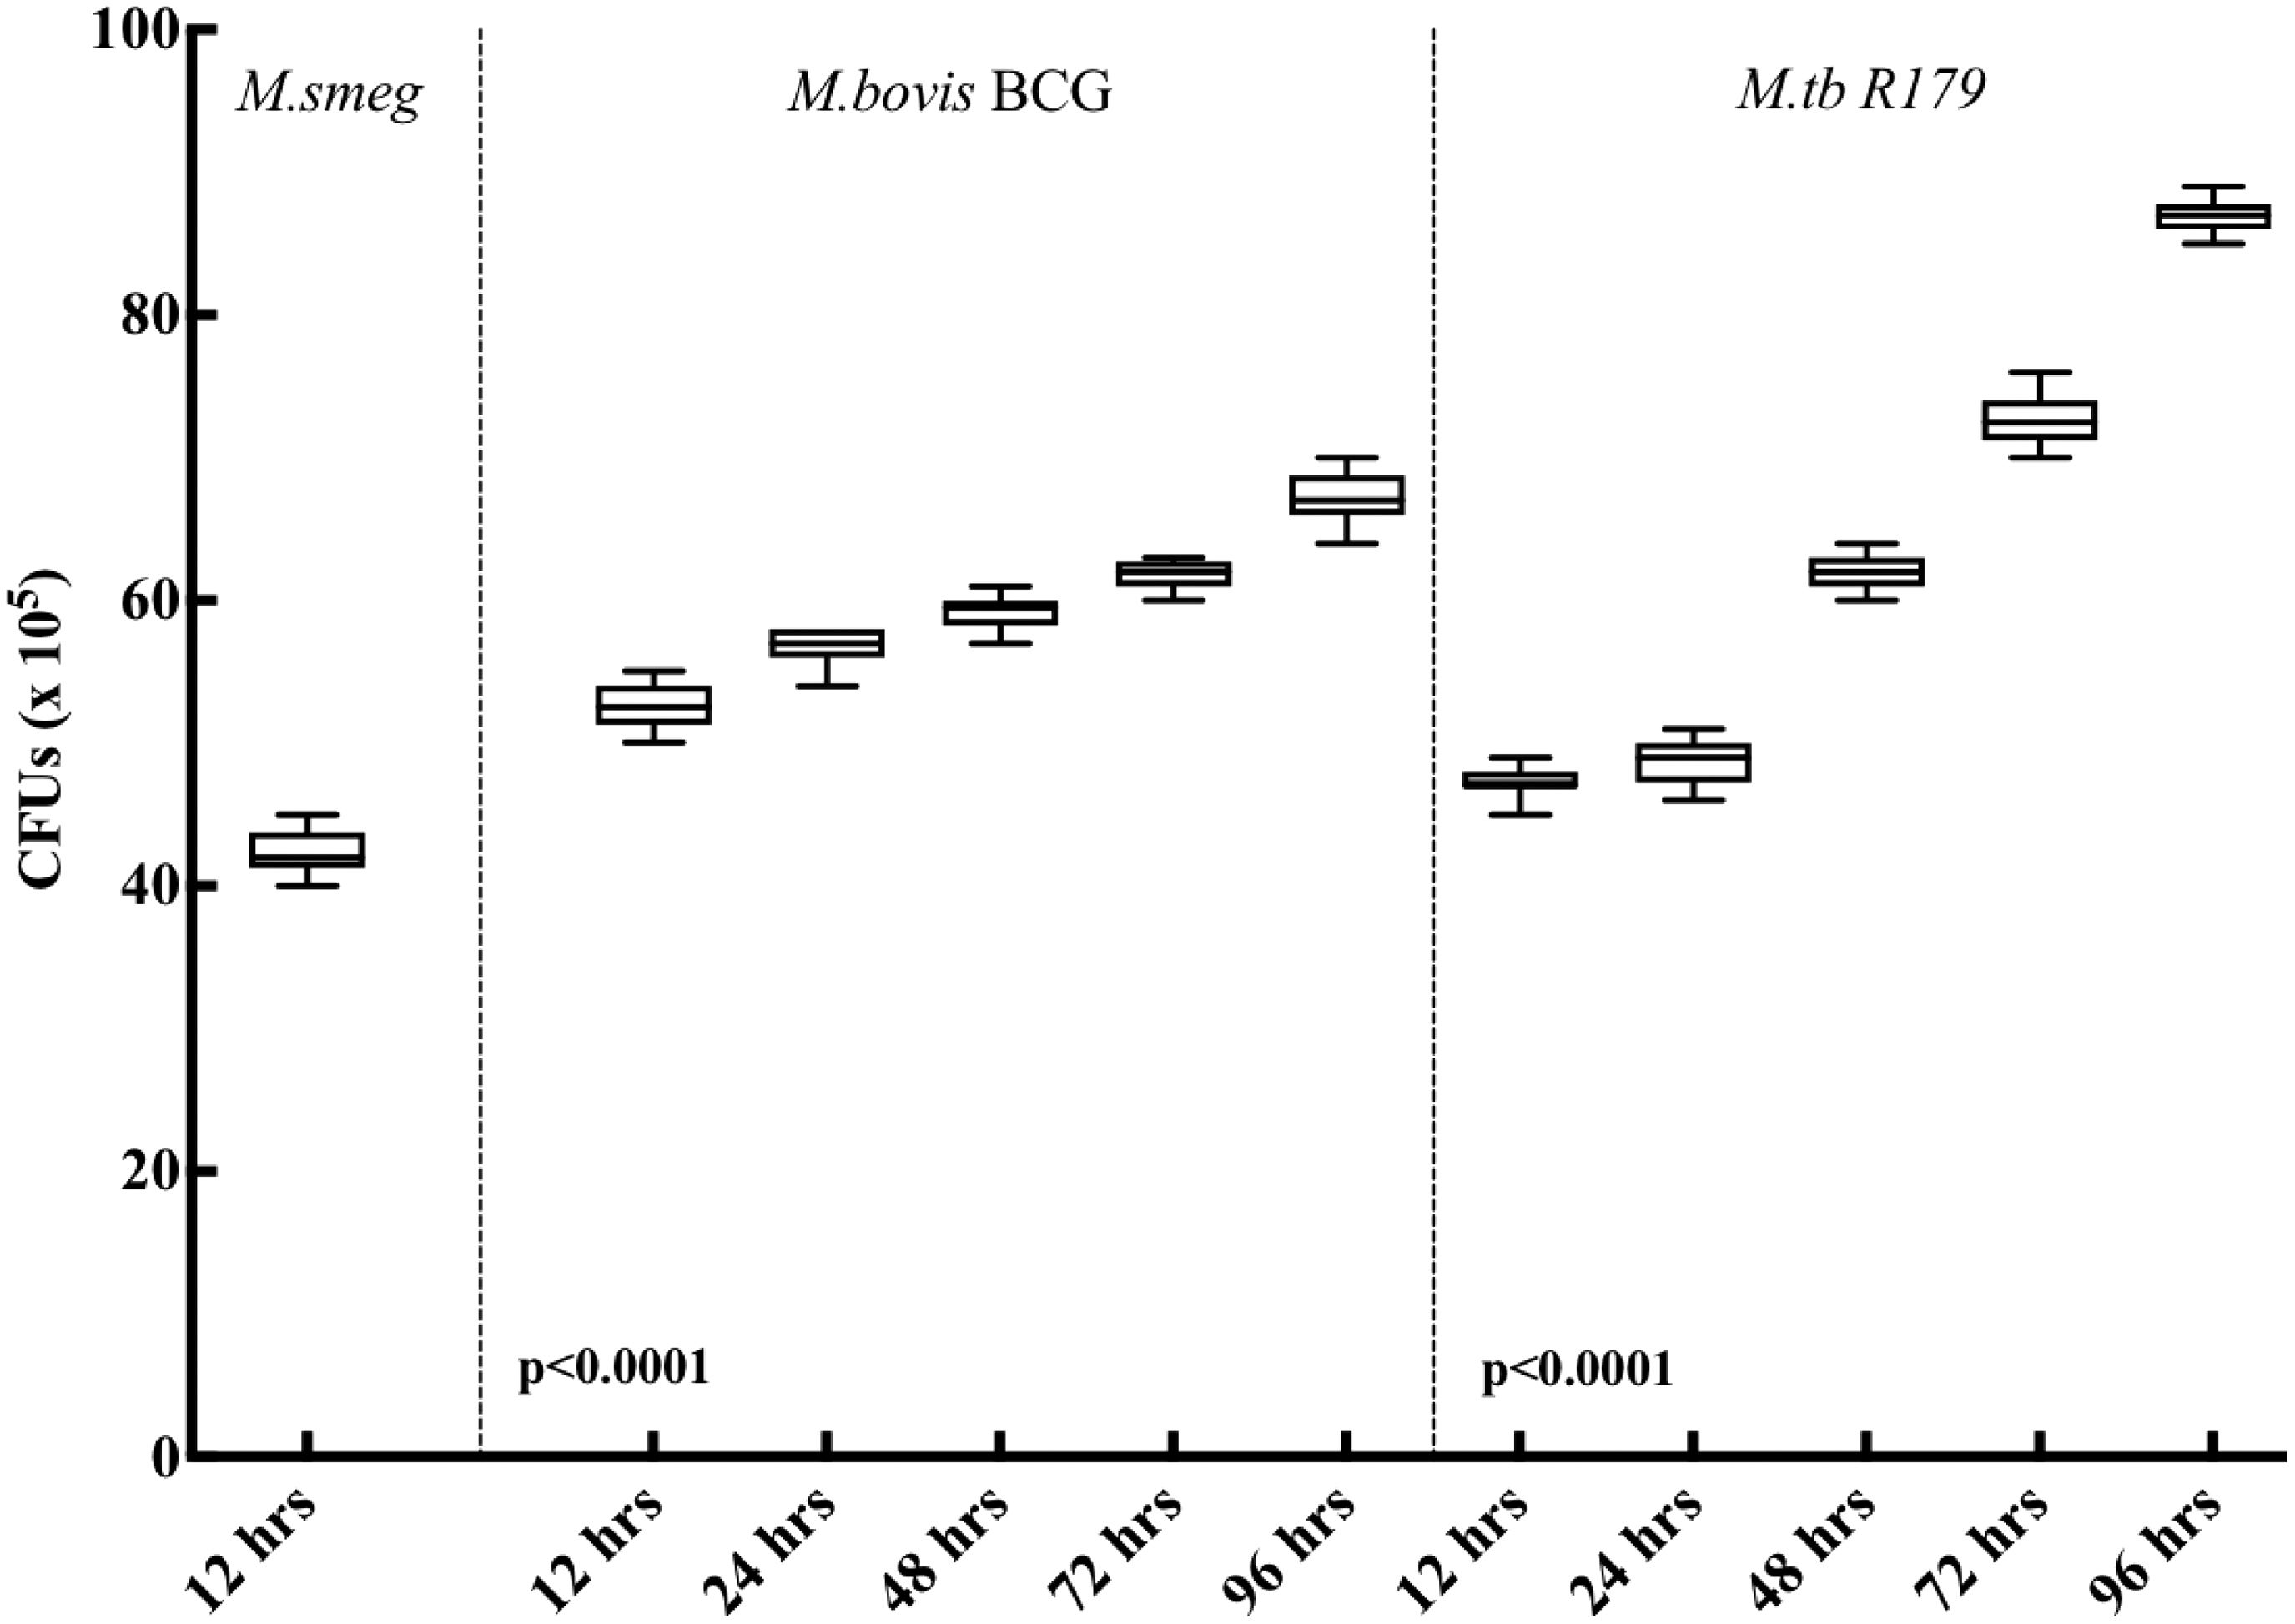
Comparison of CFUs at different time points under in vitro protocol postinfection to Mycobacterium smegmatis, Mycobacterium bovis BCG, and Mycobacterium tuberculosis R179. We observed steady increase in CFUs at all time points for M. bovis BCG and M. tuberculosis R179.
Cytotoxicity analysis
Cell cytotoxicity was tested with Roche WST-1 Cell Cytotoxicity Reagent (Roche, Germany) in 1:10 dilution of WST-1 reagent to RPMI complete media. Since the hMDMs do not proliferate in a 4 days culture, cells at different time points (12 and 24 h postinfection) were processed here. Cells were incubated for 1 h at 37°C in a 5% CO2 incubator. Absorbance was measured at 2 different wavelengths for correction (450 and 630 nm).
RNA extraction
Total RNA from human macrophages was extracted using a kit (RNeasy Plus Mini Kit) per the manufacturer's instructions. The extraction was performed immediately following the 12 h infection period. Genomic DNA was removed by column filtration “gDNA eliminator” column included in the kit. For each experiment, RNA quantity and quality were assessed using an Agilent 2100 Bioanalyzer. Only RNA samples with an RNA integrity Number (RIN) ≥9 were used for amplicon-based RNA sequencing and qRT-PCR experiments. Total RNA was extracted and frozen immediately at −80°C until needed.
RNA for LTBI and TB cases (clinical protocol)
Archived cDNA samples of TB (n = 12) and LTBI (n = 12) cases were used for qRT-PCR for panel of cytokines (IL-1α, IL-β, IL-4, IL-6, IL-8, IFN-α, IFN-γ, and TNF-α). Archived cDNA for this 8-cytokine panel (which had their premeasured cytokine profile through Multiplex ELISA) was obtained as a subsample from the previously published study (Manngo and others 2019). The level of cytokines in plasma specimen of LTBI and TB cases were compared with late host-immune response (at 96 h) from hMDMs postinfection to M. bovis BCG and M. tuberculosis R179 in the in vitro protocol. Plasma specimen from LTBI and the active TB cases were stored at −80°C, and a minimum freeze and thaw was taken care of during the experiments.
qRT-PCR
For both in vitro and clinical protocol, good quality RNA (RIN >9, 0.8 μg) was converted to cDNA using QuantiTect® Reverse Transcription Kit (Venlo, Netherlands). To ensure the removal of genomic DNA, “gDNA wipe-out buffer” from the cDNA kit was used. qRT-PCR amplification was run on a LightCycler® 96 system (Roche). LightCycler 480 SYBR Green I Master (Mannheim, Germany) and QuantiTect primer assays were used.
Hs-GAPDH and Hs-UBC were selected as reference genes conferring to stable expression levels from amplicon-based RNA sequencing data and validated through qRT-PCR. The amplification process involved 45 cycles of 95°C for 10 s followed by 60°C for 10 s and finally 72°C for 10 s. Gene expression fold-changes was computed for pathogenic-infected and nonpathogenic-infected macrophages using calibrated, normalized relative quantities using the equation N = N 0 × 2Cp. All qRT-PCRs were performed on RNA extracted from 3 separate experiments. All biological replicates, a positive control, and a nonreverse transcription control were run in triplicate (along with calibrator) as per the MIQE Guidelines (Taylor and others 2010) (MIQE checklist in Supplementary Table S2).
Multiplex ELISA
A panel of 13 cytokines was used to study the in vitro protocol. This panel included IDO-1, TNF-α, 8 interleukins (IL-1α, IL-β, IL-4, IL-6, IL-8, IL-12p40, IL-12p70, and IL-23), and 3 interferons (IFN-α. IFN-β, and IFN-γ), which were designed for studying their host response upon infection with mycobacteria at different time points using the Luminex platform. Out of these, panel of 8 cytokines (IL-1α, IL-β, IL-4, IL-6, IL-8, IFN-α, IFN-γ, and TNF-α) were selected for studying the clinical protocol.
Cytokine concentrations were evaluated using on the BioPlex platform (Bio-Rad Laboratories, Hercules, CA) using Procarta Luminex kits—ThermoFisher (CA) according to the manufacturer's protocol. The coefficient of variation for duplicate runs was <20% for all samples (range, 5.2%–19.6%) and the concentrations of all analytes in the quality control reagents were within their expected ranges. The standard curve for all samples ranged from 3.6 to 10,000 pg/mL. BioPlex Manager Software version 1 (Bio-Rad) was used for analysis of median fluorescent intensities.
Statistical analysis
The qRT-PCR data were analyzed using Light Cycler 96 SW 1.1 Software (Netherland, BV) and GraphPad Prism Version 7 (GraphPad Software, San Diego, CA). Relative expression which measures target transcript in a treatment group to that of untreated group was measured through the software in response to the calibrator and nontranscription control. The expression was related to the control group where the calibrator was normalized to one. The significance of the effect of strain was determined by 1-way analysis of variance (ANOVA) and Tukey's honest significant difference test to correct for multiple testing.
Cytotoxicity graphs and CFUs were plotted with an average of the technical triplicates leading to the mean of all the biological replicates. The percentage of every expressing cell was generated, and P-value was calculated using 2-way ANOVA with Tukey's correction. Luminex data were analyzed by 2-way ANOVA with Tukey's correction.
Results and Discussion
Demographics
Six females and six males participated in the in vitro protocol (n = 12), with median [interquartile range (IQR)] age of 27 (26–28.5) years. The clinical protocol (n = 24), was divided into active TB (n = 12) and LTBI (n = 12) group. Under active TB group, there were 4 females and 8 males, with median age of 49.5 (IQR, 31.5–57) years. There were 9 females and 3 males in LTBI group with median age of 37.2 (IQR, 30.8–56.7) years (Table 1). We found higher proportion of male with active TB compared to females. Also, active TB cases have significantly reduced BMI compared to LTBI. In a previous study, participants with higher BMI were shown to be independently associated with QFT positivity (Zhang and others 2017).
Demographic Characteristics of Study Participants
Data presented as n/N (%), median (IQR), and mean ± SD. We found higher proportion of male with active TB compared to females. Also, active TB cases have significantly reduced BMI compared to LTBI.
BMI, body mass index; IQR, interquartile range; LTBI, latent tuberculosis infection; SD, standard deviation; TB, tuberculosis.
CFUs (in vitro protocol)
In the present study, we compared the intracellular mycobacterial killing at different time points postinfection. Due to rapid growth and short life span, the CFU counts of M. smegmatis were determined only at the 12 h timepoint. Upon M. smegmatis infection, the intracellular bacterial colony counts is known to decrease drastically at 24 h postinfection, and cannot survive beyond 48 h of infection (Kuehnel and others 2001; Anes and others 2003). CFUs of M. bovis BCG and M. tuberculosis R179 found to have significantly increased (P < 0.0001) at each time points from 12 to 96 h postinfection of hMDMs. A previous study from our group showed similar findings, with a continuous increase in intracellular CFUs when hMDMs were infected with M. bovis BCG and M. tuberculosis R179 for 12 to 96 h (Madhvi and others 2020).
Multiplex ELISA using Luminex platform
A panel of 13 cytokines was designed for in vitro protocol, while panel of 8 cytokines (with some cytokines in common with the in vitro panel) was designed for the clinical protocol (Fig. 1). Due to different time points postinfection, we assessed early and late response of hMDMs infected with various species of mycobacteria (Supplementary Table S1).
In vitro protocol
Level of cytokines obtained from in vitro infection experiments and their dynamics at different time points (12, 24, 72, and 96 h) showed consistently higher level of 5 cytokines that is, IL-1β, IL-6, IL-12p40, IL-12p70, and IFN-γ in BCG-infected hMDMs compared to M. tuberculosis R179 (Fig. 3). However, the time-dependant dynamics of other 8 cytokines, that is, IDO-1, IL-1α, IL-4, IL-8, IL-23, IFN-α, IFN-β, and TNF-α between BCG- and M. tuberculosis R179-infected hMDMs were found to be similar (Supplementary Fig. S1).
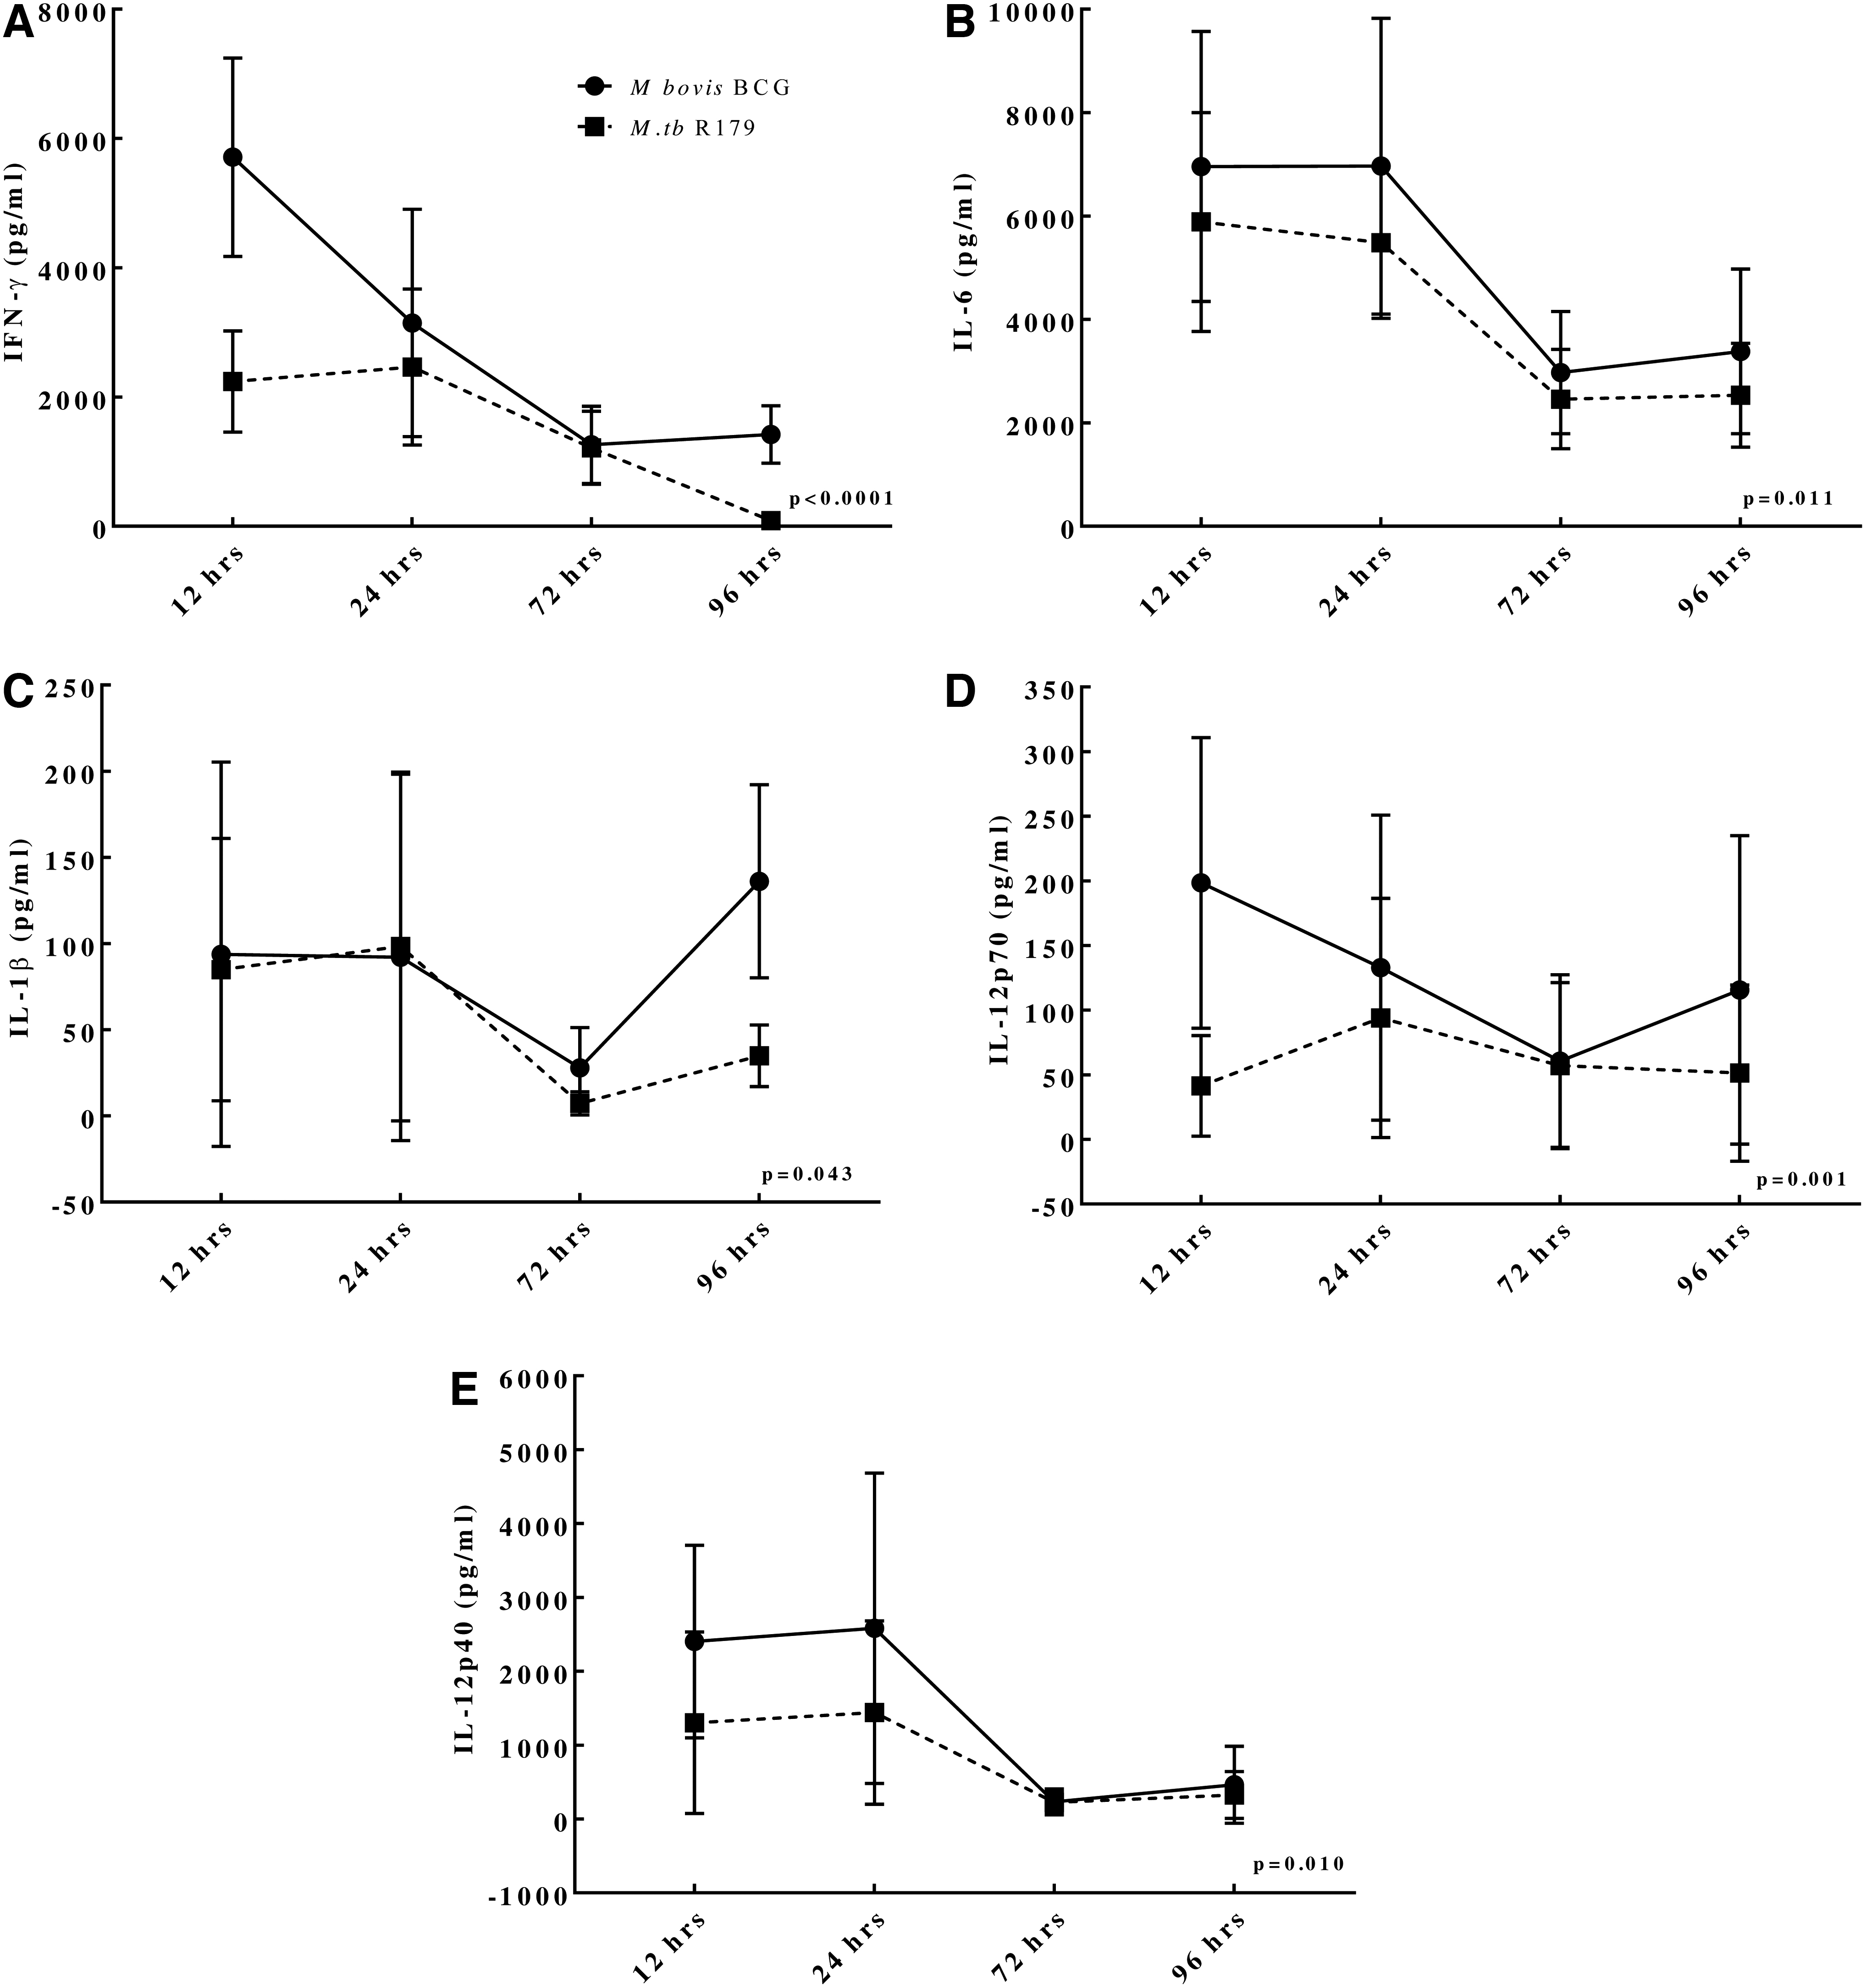
Dynamics of cytokine levels at different time points from hMDMs infected with M. bovis BCG compared to M. tuberculosis R179. We found higher levels of
Also, the overall initial host immune response (12 h postinfection) was found to be higher in M. smegmatis-infected hMDMs compared to other 2 species. This could be attributed either to the short lifespan of M. smegmatis or the higher protective host immune response against it. The latter seems more profound due to the higher levels of cytokine expression in M. smegmatis-infected hMDMs compared to other 2 species (Supplementary Table S1).
The innate host immune response is known to play a vital role against mycobacteria targeting different immunological factors (Supplementary Table S3) (Schluger and Rom 1998). The levels of IFN-γ, IL-1β, and IL-6 found to be significantly higher in BCG are considered to be the key proinflammatory cytokines against mycobacteria (Domingo-Gonzalez and others 2016).
IFN-γ has been shown to improve functions of macrophage against drug-resistant M. tuberculosis and plays an obligatory role in protective immunity against pathogenic mycobacteria (Reljic 2007; Khan and others 2016). While IL-6 is required for protective immune responses in mice infected with M. tuberculosis (Martinez and others 2013), IL-6 is also crucial for resistance against high doses of intravenously M. tuberculosis, however, it is not essential for the control of low-dose aerosol-delivered M. tuberculosis infection (Ladel and others 1997; Saunders and others 2000; Nagabhushanam and others 2003).
Clinical protocol
In the clinical protocol of the study, 8 cytokine levels (ie, IL-1α, IL-1β, IL-4, IL-6, IL-8, IFN-α, IFN-γ, and TNF-α) were compared across LTBI and active-TB cases. Interestingly, all cytokine levels found to be similar between the 2 groups (Table 2). Previous data on cytokine levels comparing TB-Antigen-Nil plasma in LTBI and active-TB cases is ambiguous. A previous study indicated similar levels of IFN-γ, TNF-α, and IL-1Ra between active and latent TB cases (Wang and others 2018).
Comparison of Cytokine Expression Among In Vitro and Clinical Protocol
The bold p-values indicate ≤ 0.05.
We found higher expression of IL-α, IL-4, IL-6, and IFN-γ from hMDMs (in vitro protocol) compared to serum from LTBI and active TB cases (clinical protocol). Data presented as mean ± SD.
Mycobacterium smegmatis was measured only at 12 h owing to its small life span.
Versus uninfected, †versus M. bovis BCG, ‡versus M. tuberculosis R179, δversus latent TB. Data represented as mean ± SD.
BCG, Bacillus Calmette-Guérin; hMDMs, human monocyte-derived macrophages; IFN, interferon; IL, interleukin; TNF, tumor necrosis factor.
On the contrary, another study observed differences in levels of IL-2, IL-6, TNF-α, and IFN-γ between LTBI and active-TB cases (Jeong and others 2015). Since, we did not have the healthy control data in the present study, we used uninfected mature (96-h) peripheral blood mononuclear cells (PBMCs) for comparison. The level of the key cytokine, such as IL-6 and IFN-γ, was found to be higher in mature PBMCs compared to LTBI and active-TB cases.
Comparison of cytokine levels across in vitro and clinical protocol
We tried comparing the in vitro (96 h postinfection) and clinical protocols to observe any uniqueness or differences. Levels of IL-1α, IL-4, IL-6, and IFN-γ detected in plasma specimen from LTBI cases were found to be lower compared to BCG-infected hMDMs at 96 h postinfection. The hMDMs infected with M. tuberculosis R179 had lower levels of IL-1α and IL-6 compared to LTBI, while cytokines IL-1β, IFN-α, and IFN-γ were found to be higher in LTBI cases compared to M. tuberculosis R179 (Table 2).
Similarly, in active TB cases, levels of IL-1α, IL-4, and IL-6 were found to be significantly lower compared to BCG and M. tuberculosis R179-infected hMDMs. Interestingly, levels of IFN-γ in active TB patients were found to be lower than BCG-infected hMDMs, but higher than M. tuberculosis R179-infected hMDMs. Also, levels of IL-1β and IFN-α in active TB cases were found to be significantly higher compared to M. tuberculosis R179-infected hMDMs (Table 2).
In a previous study, the key cytokines released by macrophages associated with proinflammatory state in TB are IL-1, IL-6, IL-8, IL-12, and TNF-α (Arango Duque and Descoteaux 2014). IFN-γ is found to be similar in both active TB as well as LTBI cases (Walzl and others 2011). The variations in cytokine levels in both protocols are partially attributed to the higher exposure (1:1 MOI) of infection in the in vitro protocol compared to unstimulated (TB-Antigen-Nil) plasma specimens from LTBI and active TB cases.
The M. tuberculosis is transmitted by aerosol dissemination and is known to enter the lungs of host causing 3 possible outcomes: (1) the host immune system clears the infection, (2) the infection progresses to primary infection, and (3) the primary infection progresses directly to active TB or to dormancy/latency. M. tuberculosis is known to be degraded and killed upon phagosome-lysosomal fusion. Macrophages as primary antigen-presenting cells present the lipid antigens and M. tuberculosis peptides, eventually leading to a strong adaptive immune response (Keiser and Purdy 2017).
Having an ability to establish a niche in macrophages, M. tuberculosis can evade human immune response, which can potentially change host cytokines profile. It is therefore essential to compare different cytokine levels at both in vitro and the clinical specimens.
Correlation of mRNA and cytokine levels
We found positive correlation (pooled for 12 and 96 h) postinfection for IL-1β, IL-6, IL-8, IFN-α, IFN-γ, and TNF-α mRNA transcripts and corresponding protein levels across M. bovis BCG- and M. tuberculosis R179-infected hMDMs (Fig. 4A, B). On the contrary, no such correlation was observed between mRNA transcripts and proteins for IDO-1, IL-4, and IL-23 (Supplementary Fig. S2a, b). Interestingly, we found that IL-12p40 mRNA transcripts were strongly correlated with its protein in M. bovis BCG-infected hMDMs, but no such correlation was observed for M. tuberculosis R179-infected hMDMs. Correlation was also observed for LTBI and active TB cases (Supplementary Figs. S3 and S4).


Similarly, we found strong correlation for IL-1α mRNA transcripts in M. tuberculosis R179-infected hMDMs, but not for M. bovis BCG-infected hMDMs. A previous study performed ciprofloxacin treatment on human pathogen Leptospira interorgan, and observed that even a minimal reduction of various other proteins compensates a huge increase of few (Malmström and others 2009). Another study also depicted a similar observation at the hypoxia-induced dormancy and exponential growth in the proteome of M. tuberculosis (Schubert and others 2015).
It is noteworthy that the correlation between mRNA and protein level may vary as the transcript level is not enough to envisage protein levels in many circumstances (Liu and others 2016).
mRNA expression
We found higher expression of IFN-γ, IL-1α, IL-1β, IL-4, and TNF-α in LTBI cases compared to active-TB cases (Fig. 5). IFN-γ is known to be an important marker for TB infection. This result is similar to that of a previous study where IFN-γ along with IL-1β and IL-1α was found to be higher in LTBI cases compared to active TB cases (Rom and others 1995). We found levels of IFN-α, IL-6, and IL-8 to be higher in active-TB cases compared to LTBI cases (Fig. 5 and Supplementary Fig. S5). In a previous study, IL-1, IL-6, IL-8, IL-12, and TNF were found to be released in active TB cases (Arango Duque and Descoteaux 2014).
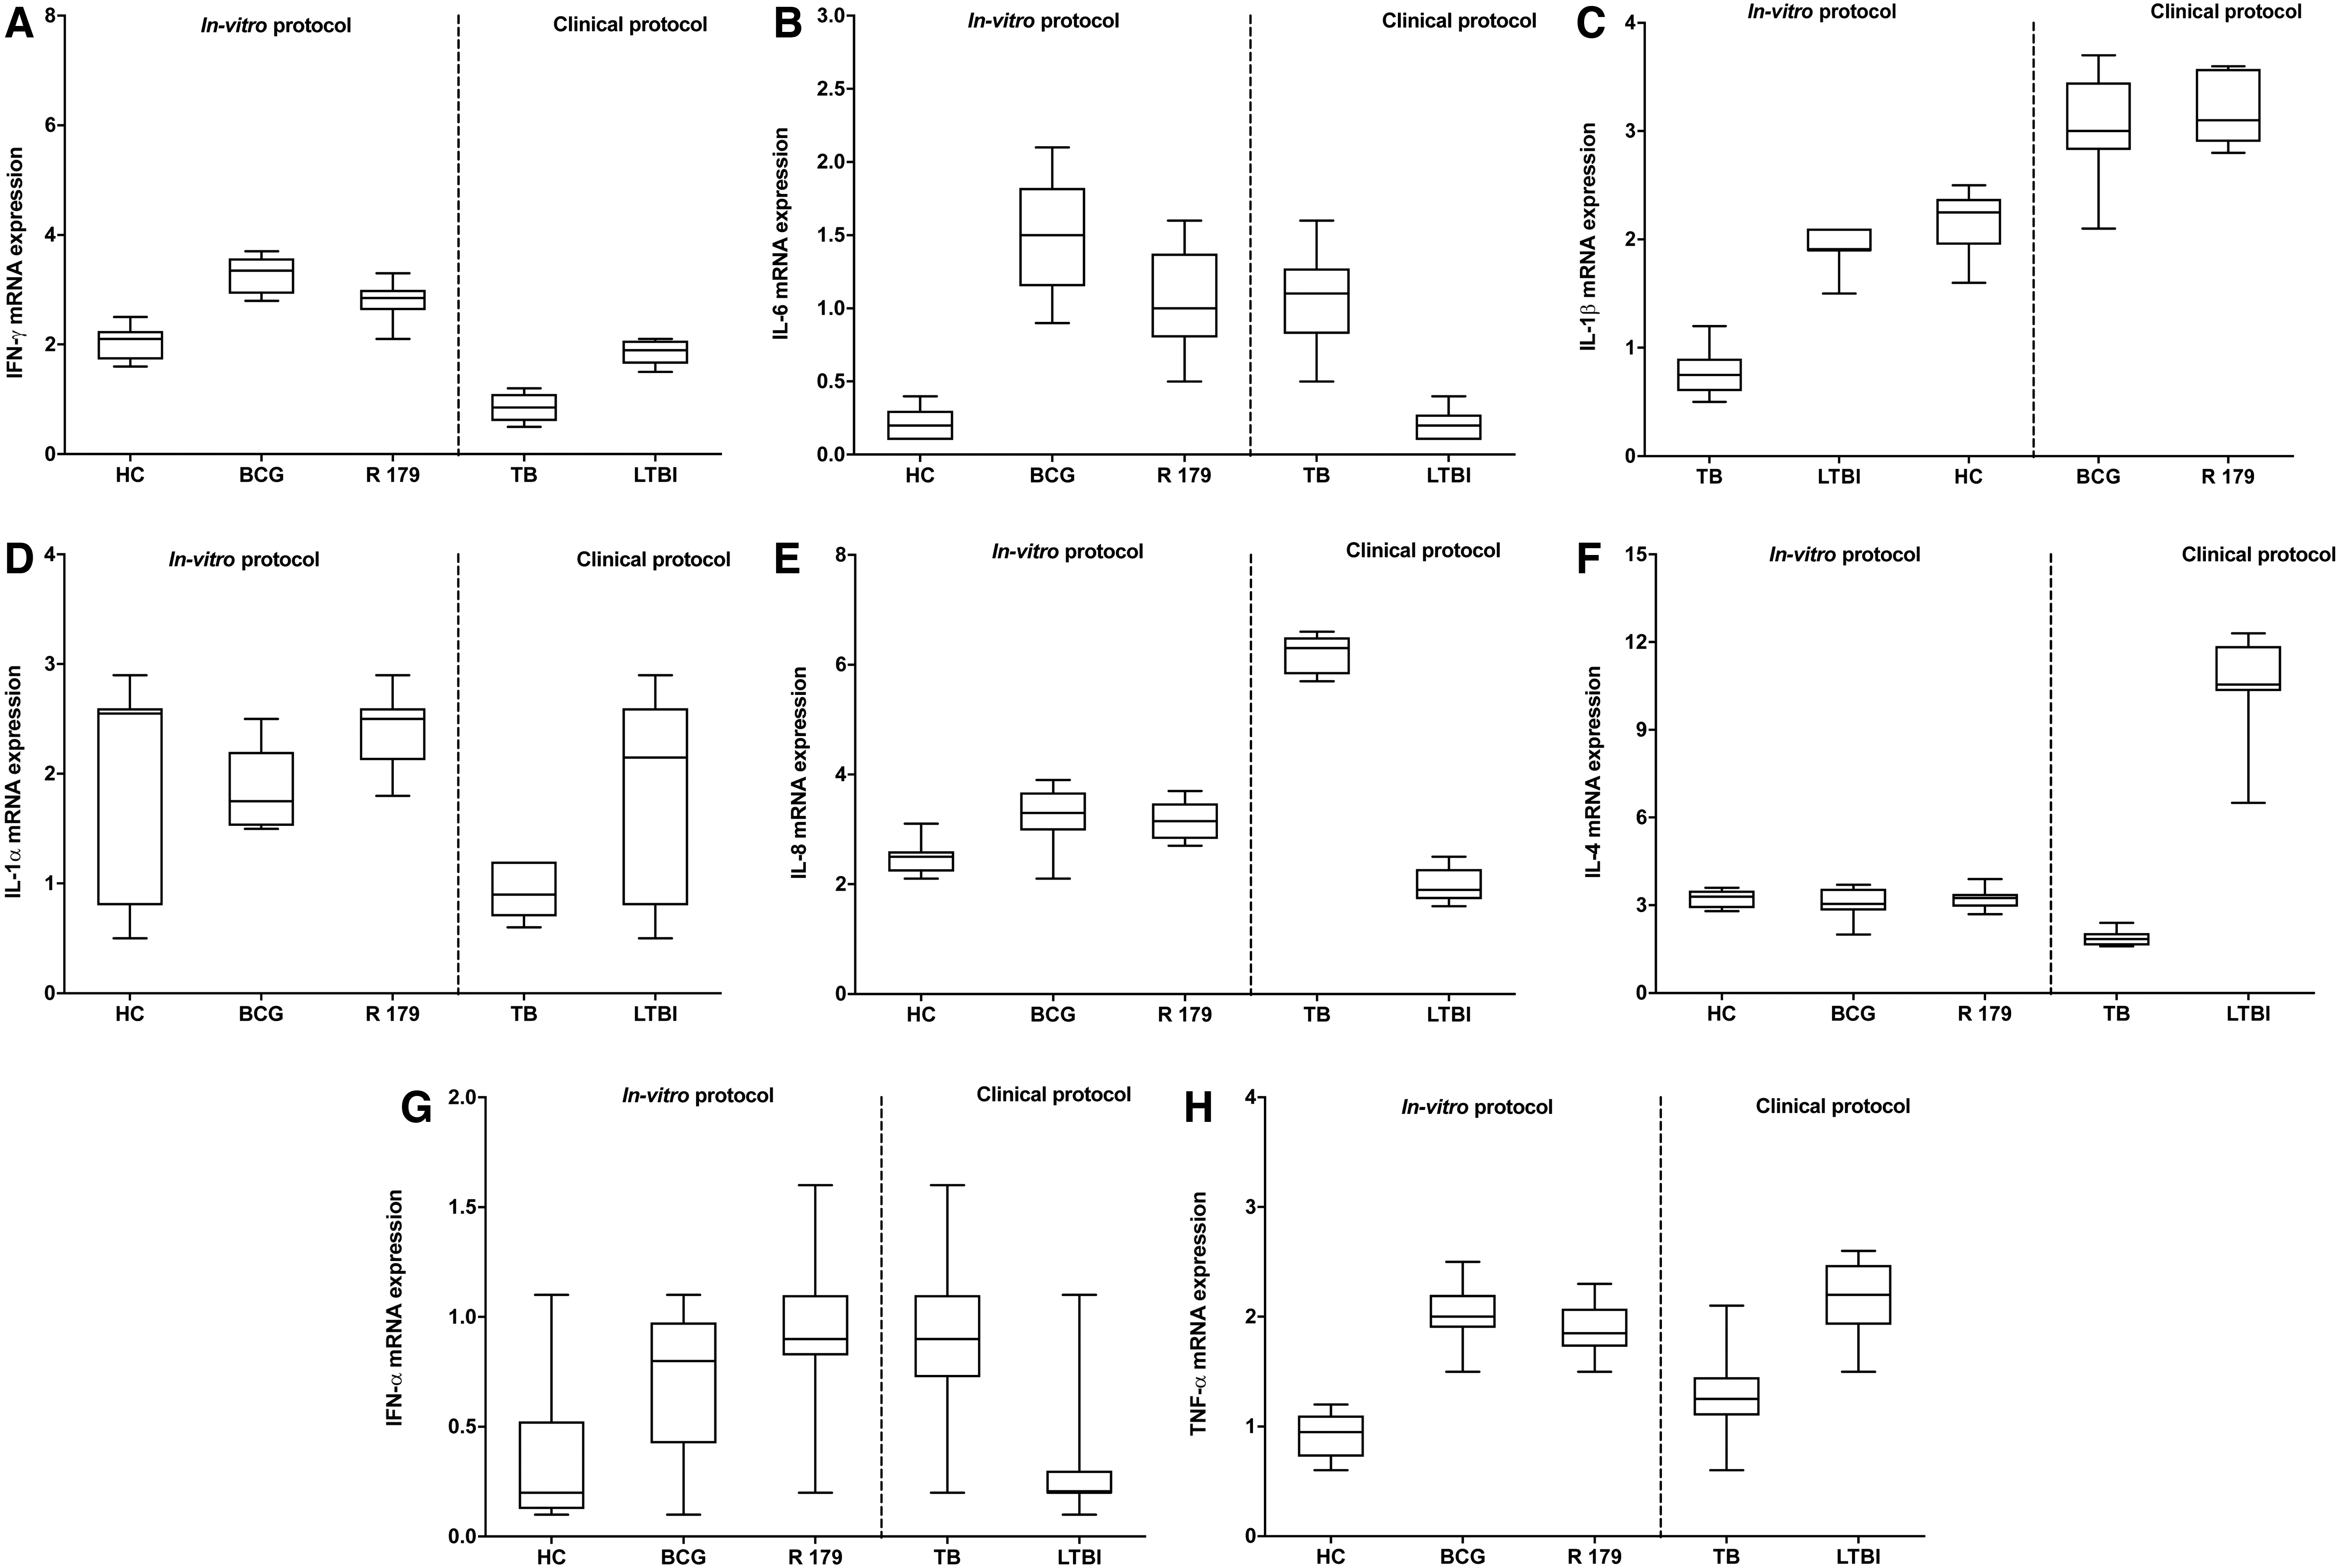
For in vitro protocol, mRNA expression at 96 h of IFN-γ and IL-6 was found to be higher in BCG-infected hMDMs compared to M. tuberculosis R179, while the mRNA expression of IL-1α, IL-1β, IL-4, IL-8, IFN-α, and TNF-α was found to be similar between BCG and M. tuberculosis R179-infected hMDMs. On the contrary, at 12 h postinfection, except TNF-α mRNA, expression of M. smegmatis-infected hMDMs found higher IL-1α, IL-1β, IL-4, IL-6, IL-8, IFN-α, and IFN-γ expression compared to BCG and M. tuberculosis R179-infected hMDMs (Supplementary Fig. S5). Previous study showed an increase host immune response upon M. smegmatis infection compared to M. bovis BCG and M. tuberculosis R179 at 12 h postmycobacterial infection (Madhvi and others 2020).
At 12 h postinfection mRNA expression of IFN-γ, IL-4, IL-6, and IL-8 were higher in BCG-infected hMDMs, while IL-1α, IL-1β, IFN-α, and TNF-α were found to be similar to M. tuberculosis R179 (Fig. 5 and Supplementary Fig. S5). It is noteworthy that we observed a minimal gene expression in hMDMs infected with M. tuberculosis R179 compared to other 2 strains. This may be attributed to the fact that there is a reduction in host immune response upon drug-resistant M. tuberculosis R179 infection compared to nonpathogenic M. smegmatis and M. bovis BCG.
Conclusion
Expression of cytokine at mRNA and protein was found to be different across in vitro protocol compared to LTBI and active TB cases. Owing to the controlled experimental conditions (1:1 MOI), the cytokine expression was found to be differed in the in vitro protocol between hMDMs infected with different species of mycobacteria. We found that the host immune response mounted a more vigorous response toward nonpathogenic (M. smegmatis and M. bovis BCG) compared to the pathogenic strain (R179) of M. tuberculosis. In contrast, we did not observe a major difference in cytokine expression between LTBI and active TB cases, either at the mRNA or at the protein level. Interestingly, there was a steady-state correlation between mRNA and protein level for only a few cytokines in the in vitro protocol, and no such correlation in the LTBI and active TB cases.
Footnotes
Authors' Contributions
A.M. and B.B. designed the experiments. A.M., H.M., and M.N.M. performed the experiments. A.M., H.M., and G.T. analyzed the data. All authors wrote and edited the article.
Author Disclosure Statement
No competing financial interests exist.
Funding Information
This work was supported by DSI-NRF Centre of Excellence for Biomedical Tuberculosis Research; South African Medical Research Council Centre for Tuberculosis Research; Division of Molecular Biology and Human Genetics, Faculty of Medicine and Health Sciences, Stellenbosch University, Cape Town.
Supplementary Material
Supplementary Table S1
Supplementary Table S2
Supplementary Table S3
Supplementary Figure S1
Supplementary Figure S2
Supplementary Figure S3
Supplementary Figure S4
Supplementary Figure S5
Supplementary Figure S6