




Abstract
Type I interferons (IFN-Is) play central roles in regulating immune responses. The role of IFNAR2 in IFN-I signaling is an open question since a previous report showed that IFNβ was still functional in the absence of IFNAR2 in mice. In this study, we report that IFN-I signaling in human monocyte-derived THP1 cells absolutely depends on IFNAR2, as determined by using a knockout mutant made by CRISPR/Cas9. Additionally, we demonstrated that a 7-bp deletion mutant (Δ7) of IFNAR2 remains responsive to IFNβ stimulation and upregulates a subset of interferon-stimulated genes (s-ISGs). The s-ISGs largely overlap with tonic ISGs, which depend on the basal expression level of IFN-I. We also showed that IFN signaling in Δ7 still depends on IFNAR2. Then, we found that the 7-bp deletion in the genome results in the loss of the entire third exon (42 bp) from the mRNA and in the expression of a functionally impaired IFNAR2. These findings clarified the requirement of IFNAR2 for human IFN-I signaling and highlighted that caution should be used with CRISPR/Cas9 technology to prevent misleading interpretations caused by residual protein expression due to exon skipping or other mechanisms.
Introduction
Type I interferons (IFN-Is) were first discovered in 1957 by Isaacs and Lindenmann (Isaacs and Lindenmann 1957; Isaacs and others 1957). Human IFN-Is are composed of 5 different subtypes: IFN-α, IFN-β, IFN-ɛ, IFN-κ, and IFN-ω (Platanias 2005; Pestka 2007). IFN-Is play sophisticated roles in antiviral, antiproliferation, and immune regulation processes (Pitha and Kunzi 2007). All IFN-Is bind to a heterodimeric receptor composed of IFNAR1 and IFNAR2 (Pestka and others 2004; Uzé and others 2007). IFNAR is ubiquitously expressed in all tissues with variation among cell types (de Weerd and Nguyen 2012).
The binding of IFN-I leads to the conjunction of the intracellular domain of IFNAR1 and IFNAR2 (Platanias 2005; Pitha and Kunzi 2007; MacMicking 2012), which leads to phosphorylation of receptors and JAKs (JAK1 and YTK2) (Fu 1995). JAK phosphorylates STAT1/STAT2 and then enables the assembly and nuclear translocation of interferon-stimulated gene factor 3 (ISGF3), which consists of STAT1, STAT2, and IRF9, finally leading to the upregulation of multiple interferon-stimulated genes (ISGs) (Levy and others 1988; Darnell and others 1994; Platanias 2005).
The ISG profile is highly conserved, but ISGs are heterogeneous in terms of response kinetics and sensitivity (Mostafavi and others 2016). In sensing low-affinity IFN-Is, ISGs were reported to cluster as robust and tunable subsets (Levin and others 2014). In sensing tonic (constitutive or physiological or basal level) IFN-I, the ISG response in mice was dichotomous (Mostafavi and others 2016). The basal level expression of IFN-I is responsible for the expression of a specific subset of tonic ISGs both in vivo and in vitro (Gough and others 2012; Mostafavi and others 2016; Schaupp and others 2020; Stefan and others 2020).
Mouse IFNβ was reported to induce a specific ISG profile in an IFNAR2-independent manner (de Weerd and others 2013). However, this IFNAR2-independent signaling was not observed in human cervical carcinoma-derived HeLa cells (Urin and others 2019). In the current report, we showed that IFN-I signaling depends entirely on IFNAR2 in the human monocyte-derived cell line THP1. Additionally, we showed that CRISPR/Cas9-based human IFNAR2 editing led to a functionally impaired protein by exon skipping. The ISG profile changed in the IFNAR2 editing mutant (Δ7) with only 21 ISGs induced by IFNβ. Finally, we found that the 21 ISGs coincided largely with the tonic ISGs we defined in IFN-I receptor knockout (KO) THP1 and systemic lupus erythematosus (SLE) candidate markers (Yao and others 2009).
Materials and Methods
Cell lines and CRISPR/Cas9 KO
THP1, 293T, and HeLa cells were from the ATCC and tested free of Mycoplasma. lentiCRISPR v2 was a gift from Feng Zhang (Addgene plasmid no. 52961; RRID:Addgene_52961) (Sanjana and others 2014; Shalem and others 2014), and sgRNA (Supplementary Fig. S1) targeting IFNAR1, IFNAR2, and scramble control was selected as previously reported (Sanjana and others 2014; Shalem and others 2014). Cells that expressed lower IFNAR1 or IFNAR2 were sorted by BD FACS Aria III. Sorted cells were subcloned in a 96-well plate for 2 rounds. The mutations in both genomic DNA and mRNA were analyzed by sequencing, and the primers are listed in Supplementary Table S4. For the scramble control THP1, a green fluorescent protein (GFP)-containing CRISPR plasmid was used, and GFP-positive cells were sorted by BD FACS Aria III.
Reconstitution of IFNAR2 mutants
A lentiviral vector expressing wild-type (WT) or third-exon-deleted IFNAR2 was overexpressed in IFNAR2-KO THP1 cells. To visualize the plasma membrane localization, the EGFP coding sequence was fused to the C-terminus of WT or mutant IFNAR2 (IFNAR2-GFP). For the third-exon-deleted IFNAR2 reconstructed stable cell line, IFNAR2 was fused with the mCherry sequence.
IFNβ stimulation and antibody blockade
WT or mutant THP1 cells (2–5 × 10⁵/mL) were stimulated with IFN-β (1 ng/mL) for 3 h, and ISG expression was analyzed by reverse-transcription PCR (RT-PCR) or RNA-seq. For 5 days of long-term treatment, 1 ng/mL of IFNβ was added to 5 × 10⁵ cells at day 0. Half of the cells were collected for RT-PCR each day, and the remaining cells were replenished with complete RPMI-1640 medium to the previous volume. For dose gradient treatment, 2 × 10⁵ cells were treated with 0, 4, 16, 64, 256, or 1,024 pg/mL IFNβ for 6 h.
IFNAR1 antibody (clone 9D4) was synthesized as previously reported (Peng and others 2015), and IFNAR2 antibody was prepared and produced in the laboratory. Antibodies were incubated with cells for 1 h before the addition of IFNβ.
Immunofluorescence
HeLa cells were plated on 35 mm confocal dishes (Nest) and transfected with IFNAR2-linker-GFP plasmid in Lipo2000. At 48 h post-transfection, the cells were fixed with 2% paraformaldehyde at room temperature for 15–20 min, permeabilized with 0.1% Triton X, and then stained with DAPI for 5 min at room temperature. Finally, 1 mL of phosphate buffered saline was added to the cells. Cells were visualized by a Zeiss-LSM700 confocal microscope with a 60 × oil objective.
Flow cytometry
The same antibodies used for the functional blockade of IFNAR1 and IFNAR2 were also used for fluorescence-activated cell sorting (FACS) analysis of their surface expression. Cells were stained with anti-IFNAR1, anti-IFNAR2, or isotype control antibodies (1 μg/mL). All flow cytometry were performed using an LSRFortessa Cell Analyzer (BD Biosciences), and the data were analyzed with the FlowJo™ Software (BD Biosciences).
Quantitative PCR
A total of 2 × 10⁵–1 × 10⁶ cells were collected and resuspended in TRIzol buffer. RNA was precipitated with chloroform and isopropanol. DNA contamination was digested by DNaseI (M6101; Promega) at 37°C for 30 min, and then, DNaseI was inactivated at 65°C for 10 min. cDNA was reverse transcribed from RNA by M-MLV with oligo dT (M1708; Promega). The target gene was amplified in the presence of SYBR GREEN dye (#A25778; Applied Biosystems). Fluorescence was detected by ABI QuantStudio7 or Corbett Roter-Gene6200 during amplification.
RNA-seq
To detect RNA expression in IFNAR2 mutant cells, 1 × 10⁶ WT THP1 cells and 42 bp IFNAR2 mutant THP1 cells were untreated or treated with 1 ng/mL IFNβ for 3 h. RNA was prepared from TRIzol lysate. Each treatment contained 2 repeats. cDNA was estimated by an Illumina HiSeq4000 PE100. RNA-seq reads were aligned to the human transcriptome database (Gencode v19) by kallisto (0.42.6) (Bray and others 2016). Differential gene expression was analyzed in the R environment (3.3.0) (Team 2021) by DEseq2 packages (Love and others 2014). Volcano plots were plotted by the ggplot2 package in R. The heat map was plotted by the pheatmap package in R (Team 2021). A Venn diagram was plotted by the VennDiagram package in R (Team 2021). The data of Δ7 mutant discussed in this publication have been deposited in the NCBI's Gene Expression Omnibus (Edgar and others 2002; Barrett and others 2013) and are accessible through GEO Series accession number GSE211502.
For scrambles and other KO THP1 cells, 5 × 10⁵ IFNAR1-KO THP1 cells, IFNAR2-KO THP1 cells, WT THP1 cells, and 3 scramble clones were untreated or treated with 1 ng/mL IFNβ for 3 h. Two repeats of each treatment were performed, and RNA was prepared from TRIzol lysate. The cDNA library was sequenced by BGISEQ PE100. The adaptor sequences in reads were excluded by cutadapt 1.18 (Kechin and others 2017), and at least 50 bases were maintained. Reads were aligned to hg38 by HISAT2 2.1.0 (Zhang and others 2021). Then, counts were calculated by featureCounts 2.0.1 (Liao and others 2014), allowing multiple alignment. Differential gene expression was calculated in R by the DEseq2 package. The Ashr shrinkage method was used to minimize effects from duplicate samples (Stephens 2017). Visualization was also implemented in R 4.0.2 (Team 2021), the VennDiagram, ggplot2, and pheatmap packages.
The IFN responsiveness in scrambles was calculated by the upregulated log2-fold change of each gene after IFNβ stimuli in 3 scramble THP1 clones. “Tonic effect in receptor KO” was defined by the log-fold changes at baseline of IFNAR1 or IFNAR2 KO clones relative to the baseline expression of the 3 scramble controls.
In this experiment, ISG was defined by an upregulated log2-fold change >1 after stimulation with 1 ng/mL IFNβ for 3 h. ISGs were defined as the common upregulated ISGs in the 3 scramble clones and WT THP1 cells. Subset of interferon-stimulated genes (s-ISGs) were defined by ISG upregulation in the Δ7 IFNAR2 mutant THP1.
Tonic ISGs were ISGs with basal downregulation with a log2-fold change < −1 in KO cells relative to 3 Scr clones and were identified in IFN-I receptor KO cells.
IFNAR2 exon coverage
The read coverage of IFNAR2 was plotted in R (Team 2021). The length of each segment was proportional to the exon length (number of base pairs in the corresponding IFNAR2 exon). The height, which starts from 0, represents the read coverage (total number of matched reads in the exon region divided by the exon length) in the RNA-seq data.
Results
IFNAR1 and IFNAR2 are necessary for IFN-I signaling in THP1 cells
To investigate the need for IFNAR1 and IFNAR2 for IFN-I signaling in human immune cells, we constructed IFNAR1-KO or IFNAR2-KO THP1 cells with CRISPR/Cas9 technology. We used sgRNA that targets upstream of genes: exon 2 of IFNAR1 or exon 3 of IFNAR2. The IFNAR1 KO cell line had a 4-bp deletion (GRCh38.p7 chromosome 21: 33,335,610–33,335,613) in one allele and a 1-bp insertion (GRCh38.p7 chromosome 21: 33,335,611–33,335,612) in the other allele (Supplementary Fig. S1A, B). The membrane expression of IFNAR1 in IFNAR1 KO cells decreased to the level of isotype antibody staining (Fig. 1A).

Both IFNAR1 and IFNAR2 are necessary for IFN-I signaling.
IFNAR2-KO THP1 had a 1-bp deletion (GRCh38.p7 chromosome 21: 33,243,688 or 33,243,689) in both IFNAR2 alleles (Supplementary Fig. S1C, D). The membrane expression of IFNAR2 in IFNAR2 KO cells also decreased to the level of isotype antibody staining (Fig. 1B). In both IFNAR1 KO and IFNAR2 KO cell lines, the upregulation of MX1 or CXCL10 upon IFNβ stimulation diminished despite the varied dosages of IFNβ (0–1,024 pg/mL) or different time points after stimulation (0–5 days) (Fig. 1C, D and Supplementary Fig. S2).
The ISG profiles induced in different cells reflected their responsiveness to IFN-I. To eliminate clone-specific effects, we compared the upregulated genes in WT THP1 and 3 scramble sgRNA-modified clones (Scr). We found that the expression of 798 genes was upregulated more than 2 times by IFNβ in WT or Scr clones (Fig. 1E and Supplementary Fig. S3A–E). A panel of 412 genes shared among WT and all 3 Scr clones were defined as ISGs in THP1 cells in this study (Fig. 1F and Supplementary Fig. S3D and Supplementary Table S1). No genes were induced by IFNβ in IFNAR1 KO or IFNAR2 KO cells (Fig. 1E, F). In summary, human IFNβ signaling unambiguously depends on both IFNAR1 and IFNAR2 in THP1 cells, in contrast to mouse IFNβ, which could function in an IFNAR2-independent manner (de Weerd and others 2013). Our result is consistent with a study showing that IFN-I signaling in human cervical carcinoma-derived HeLa cells requires both IFNAR1 and IFNAR2 (Urin and others 2019).
The 7-bp deletion IFNAR2 mutant remains responsive to IFNβ
We also examined another THP1 cell clone with a 7-bp deletion in both IFNAR2 alleles (Δ7) (Fig. 2A). The expression of IFNAR2 on the plasma membrane of Δ7 was close to the level of the isotype antibody-stained control (Fig. 2B). Counterintuitively, the expression of MX1 and OAS2 was induced in Δ7 by IFNβ, although the magnitude of their upregulation was much lower than that in WT THP1 cells (Fig. 2C, D).

Δ7 bp IFNAR2 mutant THP1 is capable of inducing s-ISG.
Having demonstrated that Δ7 is responsive to IFNβ stimulation, we next compared their ISG profile with those of WT cells. We found that hundreds of ISGs were upregulated in WT THP1 cells (Fig. 2E), whereas only 21 ISGs were induced in Δ7 cells under the same stimulation conditions (Fig. 2F, G). Notably, the fold changes of ISGs were significantly lower in Δ7 than in WT THP1 (Fig. 2E, F; Supplementary Tables S2 and S3). Only 5 ISGs (OAS2, MX1, IRF9, SAMD9L, and OAS1) were upregulated more than 4-fold in Δ7, which was far less than the 264 genes in the WT (Supplementary Tables S2 and S3). The maximum induced fold in Δ7 was 22.7-fold for OAS2, compared with 26.6-fold for IFIT2 in WT THP1 (Supplementary Tables S2 and S3). Also, the STAT1 phosphorylation (Y701) was much lower in IFNβ-stimulated Δ7 than in WT THP1 (Supplementary Fig. S4). Thus, Δ7 remains responsive to IFNβ stimulation but expresses a shrinking s-ISGs with decreased induction rates.
Δ7 mutant expresses functional IFNAR2
We have clarified that the IFNβ signal in THP1 is dependent on both IFNAR1 and IFNAR2 (Fig. 1). Although the membrane expression of Δ7 IFNAR2 was comparable to that of the unstained control, we cannot exclude the possibility of residual IFNAR2 expression in Δ7. Thus, we analyzed the effect of IFNAR blocking antibodies on the induction of ISG by IFNβ. The ISG15 expression was lower in Δ7 than in WT THP1 (Fig. 3). Both IFNAR2 and IFNAR1 blocking antibodies inhibited the induction of ISG15 in WT THP1 cells (Fig. 3). Surprisingly, both antibodies also blocked ISG15 induction in Δ7 (Fig. 3). These data suggested that residual IFNAR2 is expressed on the plasma membrane of Δ7 cells and that the induction of ISG is IFNAR2 dependent.

ISG induction in Δ7 bp IFNAR2 mutant THP1 depends on both IFNAR1 and IFNAR2. IFNβ (40 pg/mL) was added to stimulate wild-type or Δ7 IFNAR2 mutant THP1 cells, and doses of αIFNAR1, αIFNAR2, or isotype control antibody were added for blocking. ISG15 mRNA induction was detected.
A 7-bp deletion in the genome of the third exon of IFNAR2 leads to exon skipping in mRNA
We analyzed the RNA sequencing data of Δ7; surprisingly, we found a lack of reads for exon 3 of IFNAR2 (Fig. 4A). We amplified IFNAR2 cDNA by RT-PCR and confirmed a 42-bp deletion of exon 3 in Δ7 (Fig. 4B).
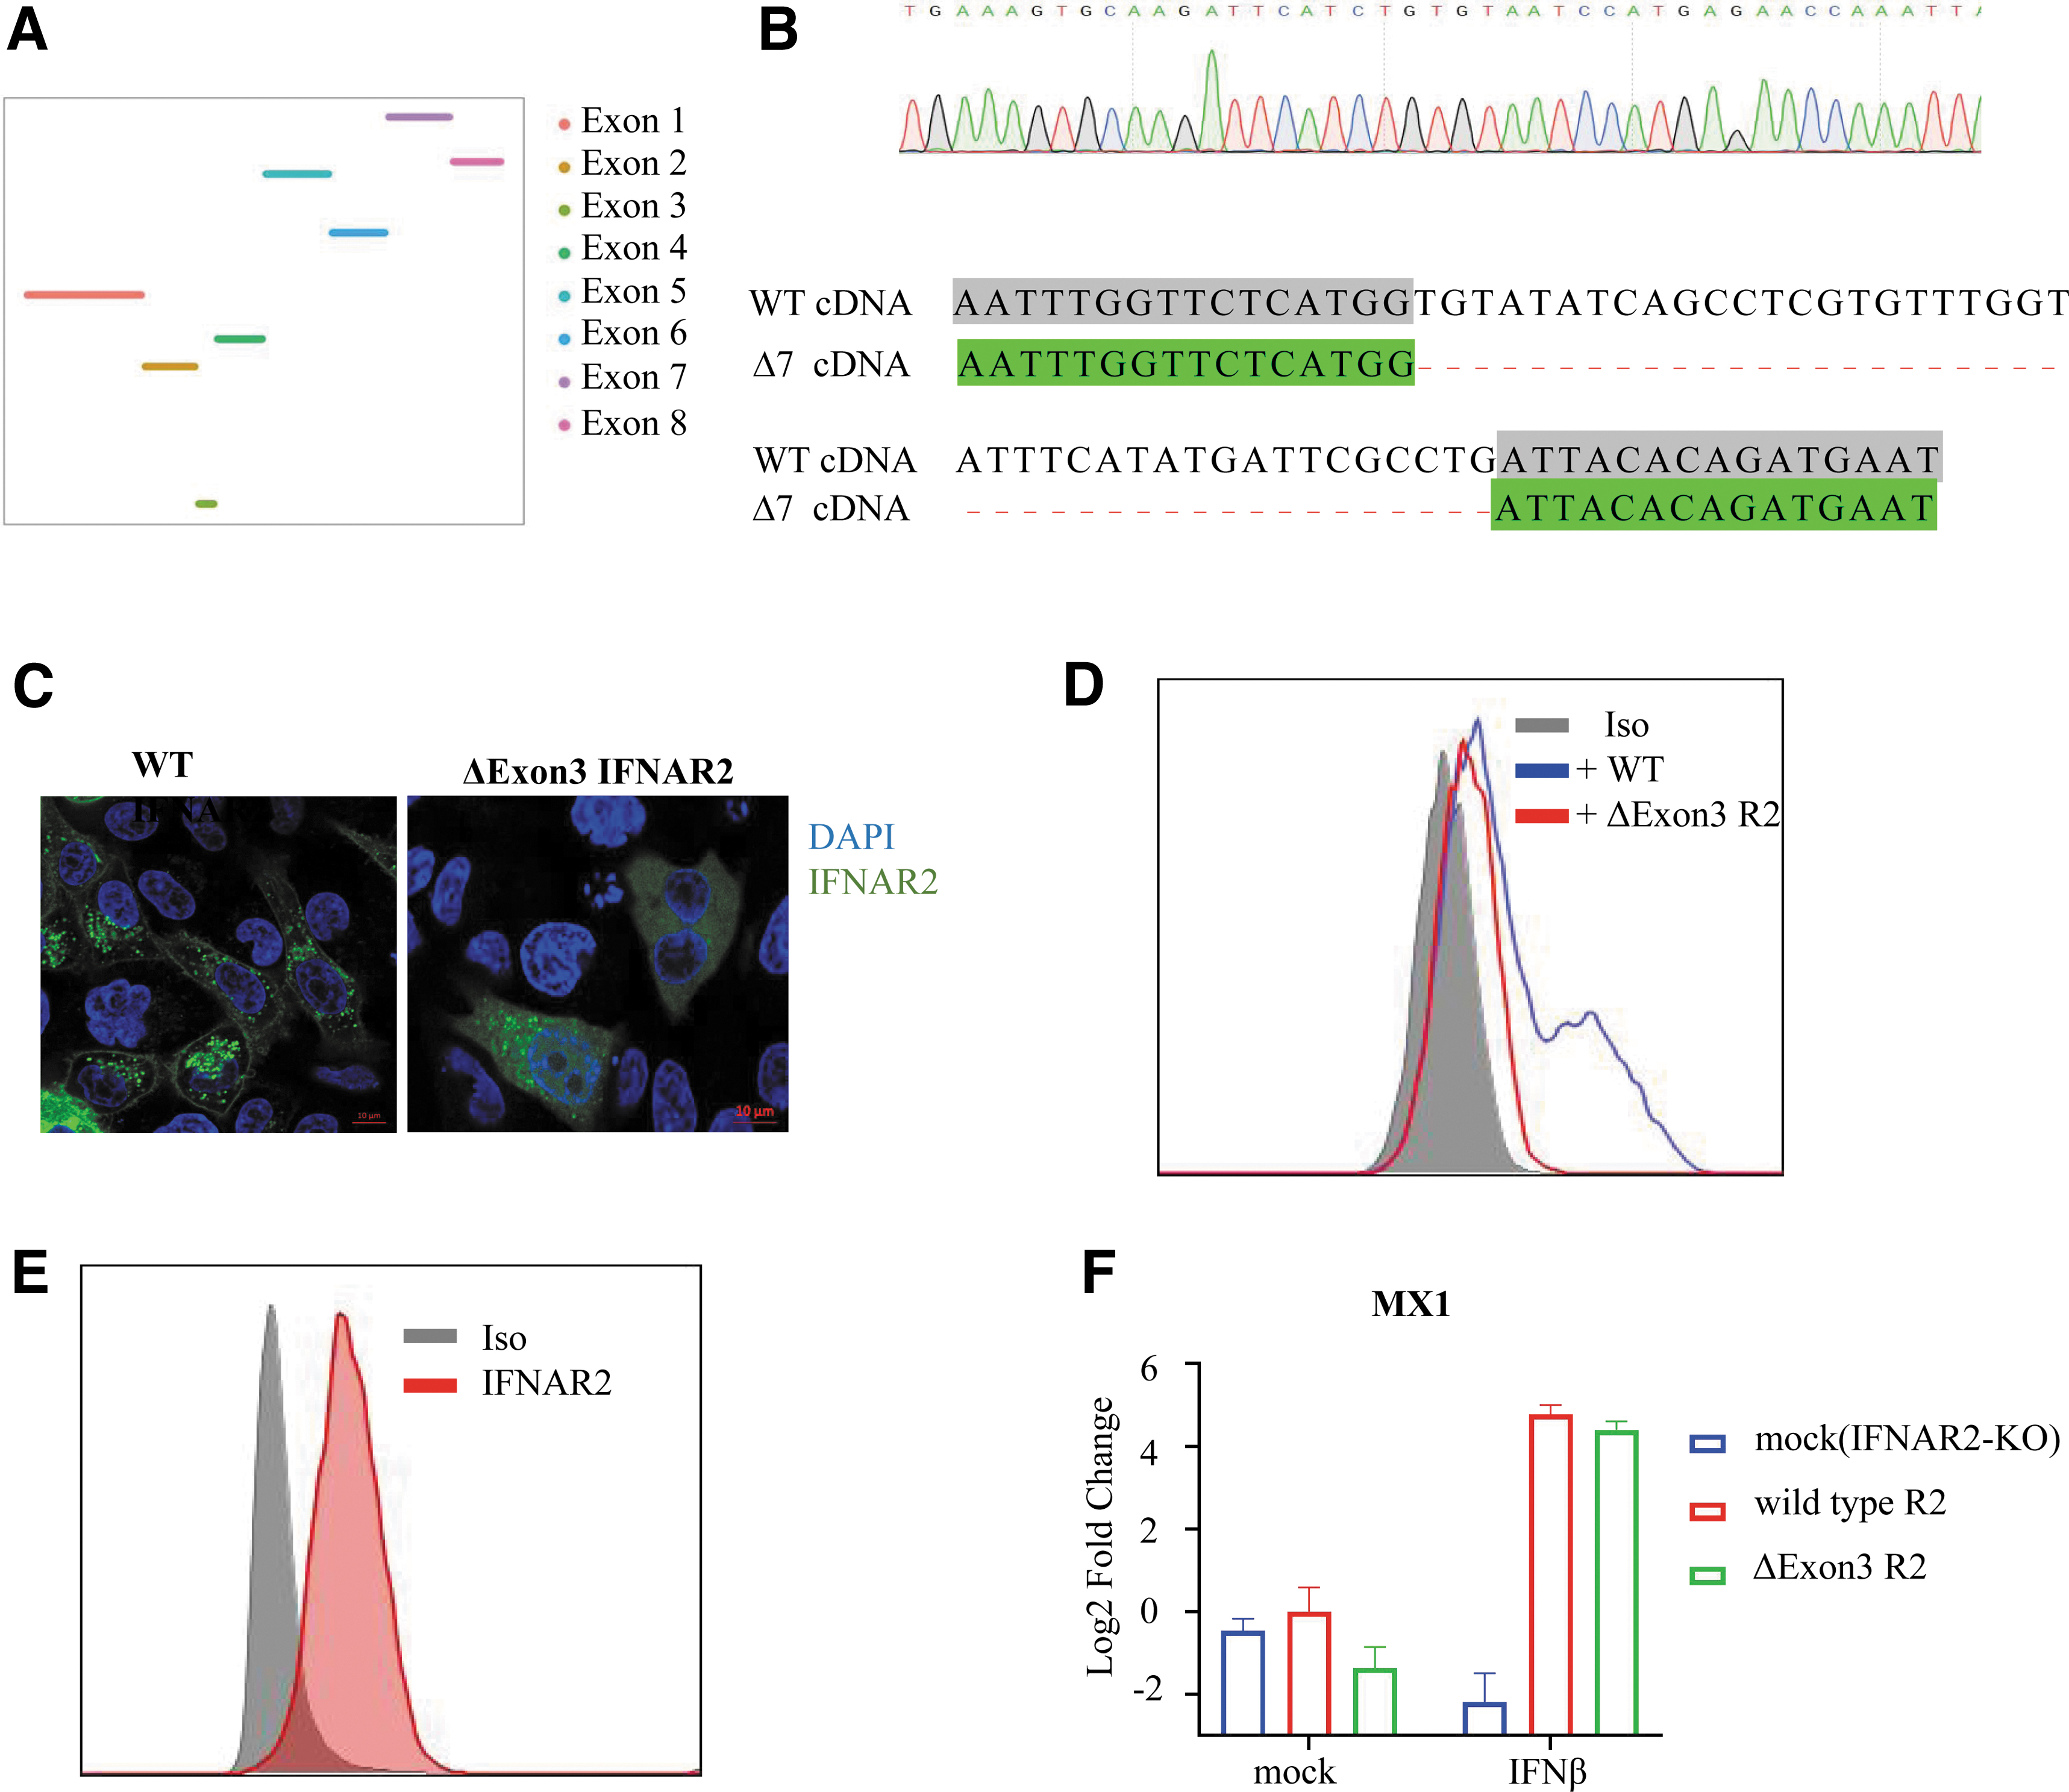
Δ7 bp IFNAR2 mutant THP1 mRNA showed IFNAR2 exon 3 deletion.
The exon 3-encoding region spans the junction of the signaling peptide and the mature polypeptide (Supplementary Fig. S5A). The depletion of exon 3 may lead to impaired signaling peptide function (Supplementary Fig. S5B, C). To test this hypothesis, we cloned the coding sequence Δexon3 IFNAR2 from Δ7 and added a GFP tag fused to its C-terminus. We found clear plasma membrane localization of WT IFNAR2 in HeLa cells (Fig. 4C, left panel), whereas the majority of Δexon3 was located in the cytosolic region (Fig. 4C, right panel). However, the membrane expression of IFNAR2 was detected on Δexon3 IFNAR2-transfected cells by FACS, although at a lower level compared with the WT-transfected cells (Fig. 4D). For the Δexon3 reconstructed stable cell line, IFNAR2 was stably expressed on the cell membrane (Fig. 4E). Overexpression of Δexon3 rescued the induction of MX1 by IFNβ in IFNAR2-KO THP1 cells (Fig. 4F). Thus, 7-bp deletion-induced exon 3 skipping in IFNAR2 was capable of inducing IFN-I signaling.
ISG profile induced in Δ7 overlaps with tonic ISGs
The induction of 21 s-ISGs in Δ7 implies that they are more robust than other ISGs. Previously, a group of tonic ISGs was identified by comparing the transcriptomes of immune cells from WT mice and IFNAR KO mice in the absence of infection or stimulation (Mostafavi and others 2016). These tonic ISGs showed ultrasensitivity in TYK2 KO mice (Mostafavi and others 2016). Additionally, the tonic ISGs defined in HeLa cells showed hypersensitivity to IFN-I in STAT1 or STAT2 KO cells (Urin and others 2019).
Here, we characterized tonic ISGs in THP1 cells with IFNAR1 or IFNAR2 KO. IFNAR1 KO and IFNAR2 KO were considered biological repeats for comparison with 3 Scr clones. The alteration of gene expression by IFNAR KO was plotted against the alteration of gene expression by IFNβ stimulation (Fig. 5A). Twenty-seven ISGs (including IFI44L, MX1, IFIT1, and OAS2) were downregulated by more than 2-fold in both types of IFNAR KO mice (green dots in Fig. 5A). Most ISGs remained unchanged compared to Scr cells (red dots in Fig. 5A). We designated these 27 downregulated ISGs as tonic ISGs in THP1 cells (Fig. 5B and Table 1). The induction rates of tonic ISGs in Scr cells by IFNβ were scattered from low to high (21.14- to 26.12-fold) (Fig. 5A and Table 1) and were equivalent to those of nontonic ISGs. The fold downregulation caused by receptor deficiency correlated with the rates of induction by IFNβ stimulation (Fig. 5A). All 27 tonic ISG expressions were reduced in both IFNAR1 and IFANR2 KO clones, confirming that both IFNAR1 and IFNAR2 are indispensable for tonic IFN-I signaling (Fig. 5B).

S-ISGs overlap with tonic ISGs.
Attributes of ISGs
Log2-fold change.
s-ISG.
§Tonic ISG.
SLE marker.
ISG, interferon-stimulated gene; s-ISG, subset of interferon-stimulated gene; SLE, systemic lupus erythematosus.
We found that s-ISGs coincided largely with tonic ISGs (Fig. 5C). Sixteen of 21 s-ISGs were also tonic ISGs, including IFIT1, MX1, OAS2, and IRF9 (Fig. 5B, C, D). The other 5 s-ISG basal changes were less than but close to 2-fold in IFNAR KO cells (Fig. 5C and Table 1). Eleven tonic ISGs were induced by less than 2-fold in Δ7, including IFI44L, IFI44, IFI6, ISG15, REC8, and SIGLEC1 (Table 1).
Pathogenic roles of IFN-I have been documented in multiple autoimmune diseases, including SLE (Banchereau and Pascual 2006; Higgs and others 2011). A panel of 21 ISGs was identified for evaluating the therapeutic effects of the anti-IFNα antibody sifalimumab in a clinical trial (Yao and others 2009; Petri and others 2013). We compared the candidate markers with ISG categories in our research. Seven genes (EPSTI1, IFIT1, IFIT3, MX1, OAS1, OAS2, and OAS3) appeared in all 3 categories (Fig. 5D and Table 1). There was a higher correlation between SLE markers and tonic ISGs (Fig. 5D and Table 1). SLE markers (except DNAPTP6) were highly induced (>4-fold) by IFNβ (Table 1), whereas only 230 of 412 ISGs were induced up to 4-fold (Supplementary Table S1). Thus, tonic ISGs or SLE markers overlapped with s-ISGs induced in Δ7.
Discussion
Both IFNAR1 and IFNAR2 are required for IFN-I signaling (Uzé and others 1990; Colamonici and others 1994; Novick and others 1994; Soh and others 1994; Schreiber and Piehler 2015). Interestingly, a report showed that mouse IFNβ could activate downstream signaling in an IFNAR2-independent manner (de Weerd and others 2013). However, IFNAR2 KO completely abolished the responsiveness to IFNβ in human cervical carcinoma-derived HeLa cells (Urin and others 2019). In this study, we demonstrated that the human monocytic cell line THP1 did not respond to IFNβ in the absence of IFNAR2. The THP1 data provided here and the data derived from HeLa cells (Urin and others 2019) collectively argue against the possibility of a cell type-specific effect of IFNAR2-independent signaling, and the discrepancy with previous results (de Weerd and others 2013) may be due to species-specific effects (de Weerd and others 2013) or characteristics of transformed cell lines.
Moreover, our data highlight the need for careful verification of the KO of the target gene by CRISPR/Cas9 since the putative loss of protein due to the introduced INDEL could be rescued by multiple mechanisms, including alternative translation initiation and exon exclusion (Tuladhar and others 2019). We also found that the same sgRNA targeting IFNAR2 used in this study also led to residual IFNAR2 expression by alternative translation initiation (data not shown).
We found that a 7-bp deletion led to functionally impaired IFNAR2 with a subset of ISG (s-ISG) induction profile. Oligonucleotides targeting the 7-bp region could be used as a novel IFN-I blocking method with only minimal antiviral ISGs maintained and other ISGs blocked since oligonucleotide therapeutic drugs have been used to block the inclusion of mutated exons of dystrophin and restore muscle dystrophin protein in Duchenne muscular dystrophy (Li and others 2018; Takeda and others 2021).
We have clarified that s-ISGs overlap greatly with tonic ISGs. Tonic ISGs were defined as ISGs capable of responding to physiological low-level IFNs (Gough and others 2012). Notably, the tonic ISGs defined in THP1 overlap greatly with those defined in HeLa cells or in mouse immune cells (Mostafavi and others 2016; Urin and others 2019). The dichotomy of ISG reactions to physiological (tonic) IFN-I was conserved among cell types and species.
It is worth noting that s-ISGs also overlap greatly with robust ISGs (Levin and others 2014). ISGs were categorized into robust or tunable subsets according to their responsiveness to IFN-I stimulation (Levin and others 2014). Robust ISGs showed broad-spectrum responsiveness to IFN-Is, whereas tunable ISGs were induced only by high-affinity IFN-I subsets (Schreiber and Piehler 2015; Kamada and others 2018). Robust ISGs were also preferentially induced in cells with impaired IFNARs (Shemesh and others 2021) or other components in the IFN-I signaling pathway (Mostafavi and others 2016). In this report, we showed that a defect in IFNAR2 preferentially upregulates robust ISGs upon IFNβ stimulation in THP1 cells.
Moreover, tonic ISGs or s-ISGs overlap with unphosphorylated ISGF3 (STAT1-STAT2-IRF9)-induced ISGs (Cheon and others 2013). The ISRE sequences may contribute to the different responsiveness between tonic and other ISGs (Cheon and others 2013; Mostafavi and others 2016). Our result showed that tonic ISGs had higher ISRE matching scores with standard ISRE (Supplementary Fig. S6). If the preferential induction of tonic ISG was based on quantitative or qualitative mechanisms worth further investigation in the future, the selective induction of s-ISG (or other ISG classifications) could be achieved by low “quantity” or “quality” of IFN-I signal, including low amounts of IFN-I, low-affinity IFN-I stimulation, impaired receptor function, and impaired transcription factor compositions (Cheon and others 2013; Levin and others 2014; Mostafavi and others 2016; Platanitis and others 2019; Shemesh and others 2021).
ISGs are used as surrogate markers for IFN-I expression both in basic research (Schoggins 2019) and in clinical trials (Yao and others 2009). Our report supports the overlap of the ultrasensitive group of ISGs with SLE candidate markers (Yao and others 2009). IFN-I upregulation was revealed in multiple diseases, including HIV-I chronic infection, type I interferonopathies caused by genetic mutations, Aicardi–Goutières syndrome, and SLE (Banchereau and Pascual 2006; Crow and Manel 2015; Cheng and others 2017; Crow and Stetson 2022). Additionally, patients with Down syndrome accompanied by high expression of IFN-I receptors showed high tonic ISG upregulation and interferonopathy symptoms (Kong and others 2020). A systematic understanding of ISG induction may lead to the identification of better biomarkers for the diagnosis and treatment of IFN-I overexpression-induced diseases.
Footnotes
Acknowledgment
The authors thank Ms. Xiaohua Nie for assistance in screening for the anti-IFNAR2 antibody.
Authors' Contributions
Lig.Z. and Lin.Z. designed the experiment and drafted the article. Lin.Z., J.M., M.Z., P.Z.L., and J.L. performed the experiment and conducted data analysis. X.J., Liw.Z., and Lin.Z. conducted genomic data analysis. X.J. contributed to the read coverage analysis.
Author Disclosure Statement
No competing financial interests exist.
Funding Information
This work was supported by grants from the Strategic Priority Research Program of the Chinese Academy of Sciences (XDB29050100).
Supplementary Material
Supplementary Information