




Abstract
Multiple sclerosis (MS) is an inflammatory brain disease with dysregulated expression of over 8,800 genes and subnormal responses to type I interferon (IFN) by peripheral blood mononuclear cells (PBMCs). IFN-β therapy ameliorates the dysregulated gene expression, but clinical benefit varies. We hypothesized that IFN dysregulation and IFN-β therapy also affect gene alternative splicing (AS). Messenger RNA splicing was quantitated with microarrays that probe 339,000 splice junctions. We found extensive AS disruption in untreated MS compared with healthy control PBMC. Functional clusters predict that splicing dysregulation will affect immunity, IFN signaling, telomere length, and the splicing machinery itself. Highly dysregulated AS was largely corrected toward normal levels during IFN-β therapy. Nonetheless, during long-term IFN-β therapy, exacerbations were linked to more dysregulated AS. In short-term kinetics, AS increased 4 h after IFN-β injection and returned toward baseline at 24 h. Here, AS was more dysregulated in clinically stable partial responders to therapy compared with complete responders, and thus predicted future clinical exacerbations. All changes in AS were largely independent of (orthogonal to) differential gene expression. The effect of type I IFNs on AS is likely to expand genomic control in human immune cells.
Introduction
Alternative splicing (AS) adds translational diversity and a tier of regulation beyond gene expression. Ninety-five percent of human genes are alternatively spliced, generating 100,000 proteins (Pan et al., 2008). Genetic variation in RNA splicing is linked to diseases, including rheumatoid arthritis and multiple sclerosis (MS) (Li et al., 2016). Some MS-linked genes identified by genome-wide association studies (GWAS) of DNA are alternatively spliced (Hecker et al., 2019; IMSGC, 2019; Karaky et al., 2018).
AS in therapy-naive MS has been analyzed to a limited extent in individual genes and in small groups of patients with undefined types of MS. AS genes implicated in MS pathology are often linked to immunity. These include genes coding for CD20, CD28, CD44, CD45, CD152 (CTLA-4), CD244 (2B4), epidermal growth factor (EGF), granzyme B, HLA class I, hRNP A1, IFNγR1, IKKε, IL-4, IL-7R, IL-12Rβ1, IL-13Rα, IL-15, IL-15Rα, LCK, osteopontin (OPN, SPP1), TGFβ1, TRAIL, and transglutaminase 2 (PubMed search, AS and MS, 2–22-2024; Evsyukova et al., 2010; Tian et al., 2011). AS of nonimmune genes may also be important in MS. Myelin components (MBP, MOG, and PLP) are alternatively spliced. In addition, in vitro interferon-beta (IFN-β) stimulation of peripheral blood mononuclear cells (PBMCs) modifies splicing of nuclear receptor coactivator 7 (NCOA7, coding for an estrogen receptor-binding protein (Yu et al., 2015). IFN-β-induced AS converts NCOA7 to NCOA7-AS, which codes for a smaller neuroprotective protein that combats oxidative stress and potentially enhances brain repair.
Type I IFN regulation of AS has been investigated for individual interferon-stimulated genes (ISG) and antiviral genes, including ADAR1, APOBEC1, GBP3 (GBP-3δC), ICAM1, IFI16, IRF1, 3, 5, and 9, ISG1 and 2, MAVS, MX1 (MxA), NLRP3, OAS1, PKR, RIGI (RIG-I), SP140, STAT1 (STAT1α/β), STING1, and TLR3 (PubMed search, AS and interferon, 2-22-2024). The IFN-γ-induced protein, IRF-1, was suggested to control AS of 35 cytokine and other genes (Dery et al., 2014). However, there has been no comprehensive evaluation of type I IFN effects on AS.
Type I IFNs (IFN-α, β, and ω) are antiviral, antiproliferative, and immune-regulatory. IFN-β, the first biological therapy approved to treat MS, affects short-term expression of >1,200 genes in PBMC, including IRF1 (Feng et al., 2019a). Importantly, the IFN system is dysregulated in MS, before any therapy. Low serum type I IFN levels and subnormal responses of PBMC to IFN stimulation in MS suggest the interferon system is a target for treatment. Dysregulated gene expression of >8,800 genes in therapy-naïve MS compared with healthy control PBMC is largely corrected by long-term IFN-β therapy (Feng et al., 2019a; Nguyen et al., 2023). We hypothesized that type I IFN also regulates splicing of genes that control immunity and antiviral responses. We used in vivo injections of IFN-β to investigate IFN regulation of AS in MS—a disease with perturbed IFN regulation.
PBMC, which control and mediate CNS inflammation in MS, were studied with microarrays that quantitate expression of 67,000 coding and noncoding genes, and also include high coverage of AS sites. We found that there are extensive AS changes in untreated MS compared with healthy control PBMC. This dysregulation reverts to near-normal with long-term IFN-β therapy. Surprisingly, the changes in AS are frequently independent and have no overlap with changes in gene expression.
Methods
Subjects and study design
Totally, 221 PBMC RNA samples from 53 subjects included 26 well-characterized relapsing/remitting MS (RRMS) patients who had comprehensive neurological exams and cognitive, bladder, and fatigue assessment every 6–12 months for up to 19 years before the study and for 6 years after initial phlebotomies (Feng et al., 2019a) (Table 1). Serial MRIs were not performed during ongoing IFN-β therapy, so MRI activity that did not cause clinical exacerbations could have been missed. IFN-treated patients had received subcutaneous injections of 250 ug IFN-β-1b (n = 26) or 44 ug IFN-β-1a (n = 1) for 8.3 ± 1.7 years (range 1–19 years). Their extended disability status score was 2.5 ± 0.5 [extended disability scale score (EDSS); 0 = normal, 10 = deceased] (Kurtzke, 1983); duration of MS since symptom onset was 14.0 ± 2.0 years at study entry.
Demographic and Clinical Characteristics of Subjects
EDSS, expanded disability status scale; IFN-β, interferon-beta; MS, multiple sclerosis; na, not applicable; SEM, scanning electron microscopy.
Eleven RRMS were clinical complete responders (CR) to IFN-β therapy [age 48.4 ± 1.6, mean ± scanning electron microscopy [SEM]), exacerbation-free and progression-free for >6 months before sampling (last attack averaged 5.2 ± 1.8 years prior), and for 5 years after sampling. Fifteen RRMS were PR, stable for >6 months at entry (average 1.0 ± 0.3 years; age 46.7 ± 3.1) who then experienced at least 1 exacerbation over 5 years of IFN-β therapy. During exacerbations, PR were reinduced with double-dose IFN-β therapy (Feng et al., 2019a). Glucocorticoids were not used before or during exacerbations. Age, sex ratio, race, duration of MS, time on therapy, and time after last injection were not significantly different between CR and PR (Student’s t-test).
Nineteen therapy-naïve RRMS included 10 with stable MS (age 45.2 ± 2.6, 8F/2M) and 9 during exacerbations (age 46.3 ± 3.5, 8F/1M). Untreated did not differ from IFN-treated patients in disease duration or disability. Eight healthy controls (HC) (age 42.3 ± 4.8, 5F/3M) were compared with the MS groups.
Inclusion criteria were clinically definite or laboratory-supported MS, ages 18–65, and EDSS of 0–6.5. The exclusion criteria included medical problems such as underlying cardiovascular disease or a history of significant infections and glucocorticoid use within 6 months. All signed University of Chicago IRB-approved informed consents; the study was conducted according to the Declaration of Helsinki principles.
Interferon-β treatment—single and double doses used to probe the dysregulated IFN system
Long-term changes in AS in PBMCs from IFN-treated CR and PR were examined at 104.3 ± 6.8 h after last injection for single doses and at 121.1 ± 11.0 h for double doses and at 73.5 ± 9.5 h in the exacerbating PR patients. Washout times were statistically equivalent between clinically stable CR and stable and exacerbating PR groups. The planned 4-day interruption of IFN-β therapy exceeds the immediate gene-inducing effects of injected IFN-β, which largely leaves the circulation within 1 h (Chiang et al., 1993; Feng et al., 2012). Moreover, new IFN-β-induced RNA expression in PBMC is minimal beyond 24 h (Reder et al., 2008).
Short-term IFN-β effects on AS in clinically stable CR and PR were studied at 0, 4, and 24 h after double-dose injections (500 ug of IFN-β-1b or 88 ug of IFN-β-1a) and were repeated 1 month later with standard single doses (250 ug of IFN-β-1b or 44 ug of IFN-β-1a). Gene expression was first tested at time 0 after washout and then after double-dose IFN-β induction at tightly controlled times: 4.06 ± 0.04 h (mean ± SEM) and 23.6 ± 0.14 h after injections. One month later, the process was repeated, with a single dose of IFN-β. Patients who had exacerbations (active PR) self-injected double-dose IFN-β in clinic the morning after reporting the attack. Time 0 phlebotomy was between 8 and 10 AM to minimize circadian rhythm effects. Subjects were enriched for drug tolerability and for some clinical benefit from IFN-β because patients intolerant to IFN-β or with multiple exacerbations on therapy were excluded from this study.
Isolation of PBMC
PBMCs from 30 mL of heparinized blood were purified by density gradient centrifugation on lympholyte (Cedarlane Labs, Burlington, NC) within 4 h of phlebotomy. Lysates were stored at –80°C in “buffer RLT plus” (Qiagen, Germantown, MD). Use of purified PBMC (monocytes and dendritic, NK, Th1, Th17, Th2, Treg, and B cells) eliminates background noise from granulocytes, nucleated reticulocytes, and megakaryocytes, which generate up to 95% of whole blood RNA, but which are largely irrelevant to MS pathogenesis (Dendrou et al., 2015; Reder, 2023). Use of PBMC considerably improves RNA signal-to-noise ratio, quality of data, and quantitation of MS-relevant transcripts (Feng et al., 2019a).
Array assay of RNA expression and alternative splicing; deep coverage
Total RNA was extracted, reverse-transcribed, and amplified using the RNeasy Reagent Kit (QIAGEN, Valencia, CA). Quantitation and integrity of total RNA samples were measured by Agilent 2100 Bioanalyzer. RNA integrity number (RIN) of the electrophoretic trace of the RNA sample profiled degradation products. RIN median integrity was 10, and the average was 9.70 ± 0.08 (RIN of 10 = intact, 0 = severely degraded). RNA quality control of CHP files used transcriptome analysis console (TAC) 4.0 software, with labeling controls, hybridization controls, and positive versus negative area under the curve (AUC) measures. All 227 samples passed the hybridization controls and AUC. One included sample (0.44%) did not pass the labeling controls threshold (Feng et al., 2019a) but passed the other 2 thresholds and was not an outlier on the PCA map.
100 ng of RNA from randomized samples was hybridized to GeneChip® Human Transcriptome Arrays (HTA) 2.0 (Affymetrix/Thermo Fisher, Santa Clara, CA). High-resolution whole transcriptome HTA microarrays covered 67,000 protein-coding and noncoding genes and 285,000 full-length transcripts (245,000 coding and 40,000 noncoding transcripts such as lncRNA, >200 bp) and other RNA biotypes. They identify a broad dynamic range of expression and detect very low-level signals such as lncRNAs and RNAs coding for cytokines and neuroprotective genes and are equivalent to 200 million-deep reads with RNA seq (Nazarov et al., 2017). Both coding and noncoding genes are alternatively spliced. Totally, 339,000 probe sets gave dense coverage of exon–exon splice junctions, allowing direct quantitation of splicing (Xu et al., 2011).
Array data preprocessing
CEL raw data files were imported, and array data were preprocessed using the aroma.affymetrix R library (https://www.aroma-project.org/). A normal exponential background correction model was applied using the “mle” method implemented by the backgroundCorrect function of limma (Silver et al., 2009). Next, probe-level signals were adjusted by quantile normalization to bring samples toward a common distribution. This was followed by an exon-level robust multiarray average (RMA).
Alternative splicing analysis
Alternative splice sites were identified and compiled into “events.” First, probes from Affymetrix HTA 2.0 array are mapped against the Ensembl human transcriptome to generate an updated array layout description (CDF) file using the “Ensembl” option of the CDFfromGTF function of EventPointer (https://www.bioconductor.org/packages/release/bioc/html/EventPointer.html). Based on this annotation, splicing graphs for each gene are built, and exon boundaries to which ≥2 alternative exons could be joined are designated as “events.” Groups of probes that cover each arm of the alternative paths measure a ratio, the percent splicing index (PSI), which expresses the balance of splicing at that location in a given sample, and indicates the frequency of splicing in an individual exon within a gene (Park et al., 2018; Schafer et al., 2015). Each alternative splicing event (ASE) potentially generates an altered protein. There can be many ASEs in an alternatively spliced gene (ASG). Function and half-life of each isoform may vary, but can have biological consequences, as with NCOA7 (Fig. 4A).
To measure splicing at various post-IFN-β induction times, time and treatment matrices were constructed for each treatment comparison. The resulting AS events were inputted into EventPointer, which measures AS at each event. To limit false-positives, a minimum expression filter was applied such that if all paths in a given event are in the bottom quartile of expression that event is not considered. EventPointer requires that both isoforms under consideration demonstrate significant fold changes in opposite directions. The remaining events are evaluated based on the “LogFC” statistic. Results include the gene’s symbol, the splicing event type, its genomic location, and splicing P value.
AS analysis with EventPointer was confirmed with TAC (Thermo Fisher Scientific, Waltham, MA). TAC visualizes alternative exon and splice junction usage with several algorithms, including a modified version of EventPointer. A subset of CEL files and the metadata matrix was staged for each contrast. TAC then preprocesses and analyzes expression and AS. The full results combine all 3 primary scoring algorithms (splicing index, event pointer, and event estimation score) and the composite score (exon event score). Additionally, TAC visualizes AS sites, splice junction locations, and various encoded protein isoforms.
Significant ASGs were filtered by stringent exon splicing index (ESI) of more than or equal to 2 or less than or equal to −2, EventPointer P value <0.05, event score >0.1, and requirement that the gene was expressed in both groups in a contrast. In addition, significant differentially expressed genes (DEGs) were filtered by fold change of >|2| and by FDR correction P value <0.05. “AceView-identified” genes (cDNA-supported human, mouse, and nematode genes, many noncoding; https://www.ncbi.nlm.nih.gov/IEB/Research/Acembly) were excluded from TAC analysis to further minimize background noise. The changes in ASG and DEG reflect group changes and are a composite of degree of change and frequency of the change within a group. A single outlier would not be significant.
Clustering and functional analysis in IPA
Raw PSI values for all splicing events were extracted using the “getPSI” function in EventPointer to construct heatmaps and PCA plots. Variance in PSI values for each event was then calculated (variance threshold <0.015), and low variance events with <1.5% difference were classified as similar and removed from the dataset. Z-score normalization of each event PSI value [(x − μ)/σ: subtracted row mean from individual PSI divided by standard deviation] was then computed using the Python SciPy library (https://scipy.org). The cluster map function in the Seaborn library (https://seaborn.pydata.org) employed a hierarchical agglomerative-clustering algorithm to aggregate the splicing events based on the average Euclidean distances of subclusters discussed in the text were selected from the top 50 AS gene groups linked to MS relevance, with a threshold of >1.5-fold.
ASGs were further analyzed using the QIAGEN IPA bioinformatics algorithm for biological function and canonical pathway contextualization and to predict important upstream regulators of TAC-identified signaling pathways (Nguyen et al., 2023). IPA pathways are selected with P value <0.05 and |z-score| >0.447, encompassing the top 50 pathways. Functional characteristics of ASGs were also assessed using the “Database for Annotation, Visualization, and Integrated Discovery” (DAVID) knowledgebase, https://david.ncifcrf.gov. To accommodate DAVID’s restriction of ≤3000 gene symbols, ESI stringency was increased to ≥|2.5|.
Results and Discussion
Gene splicing and expression are orthogonal to each other in untreated and IFN-β-treated MS and HC
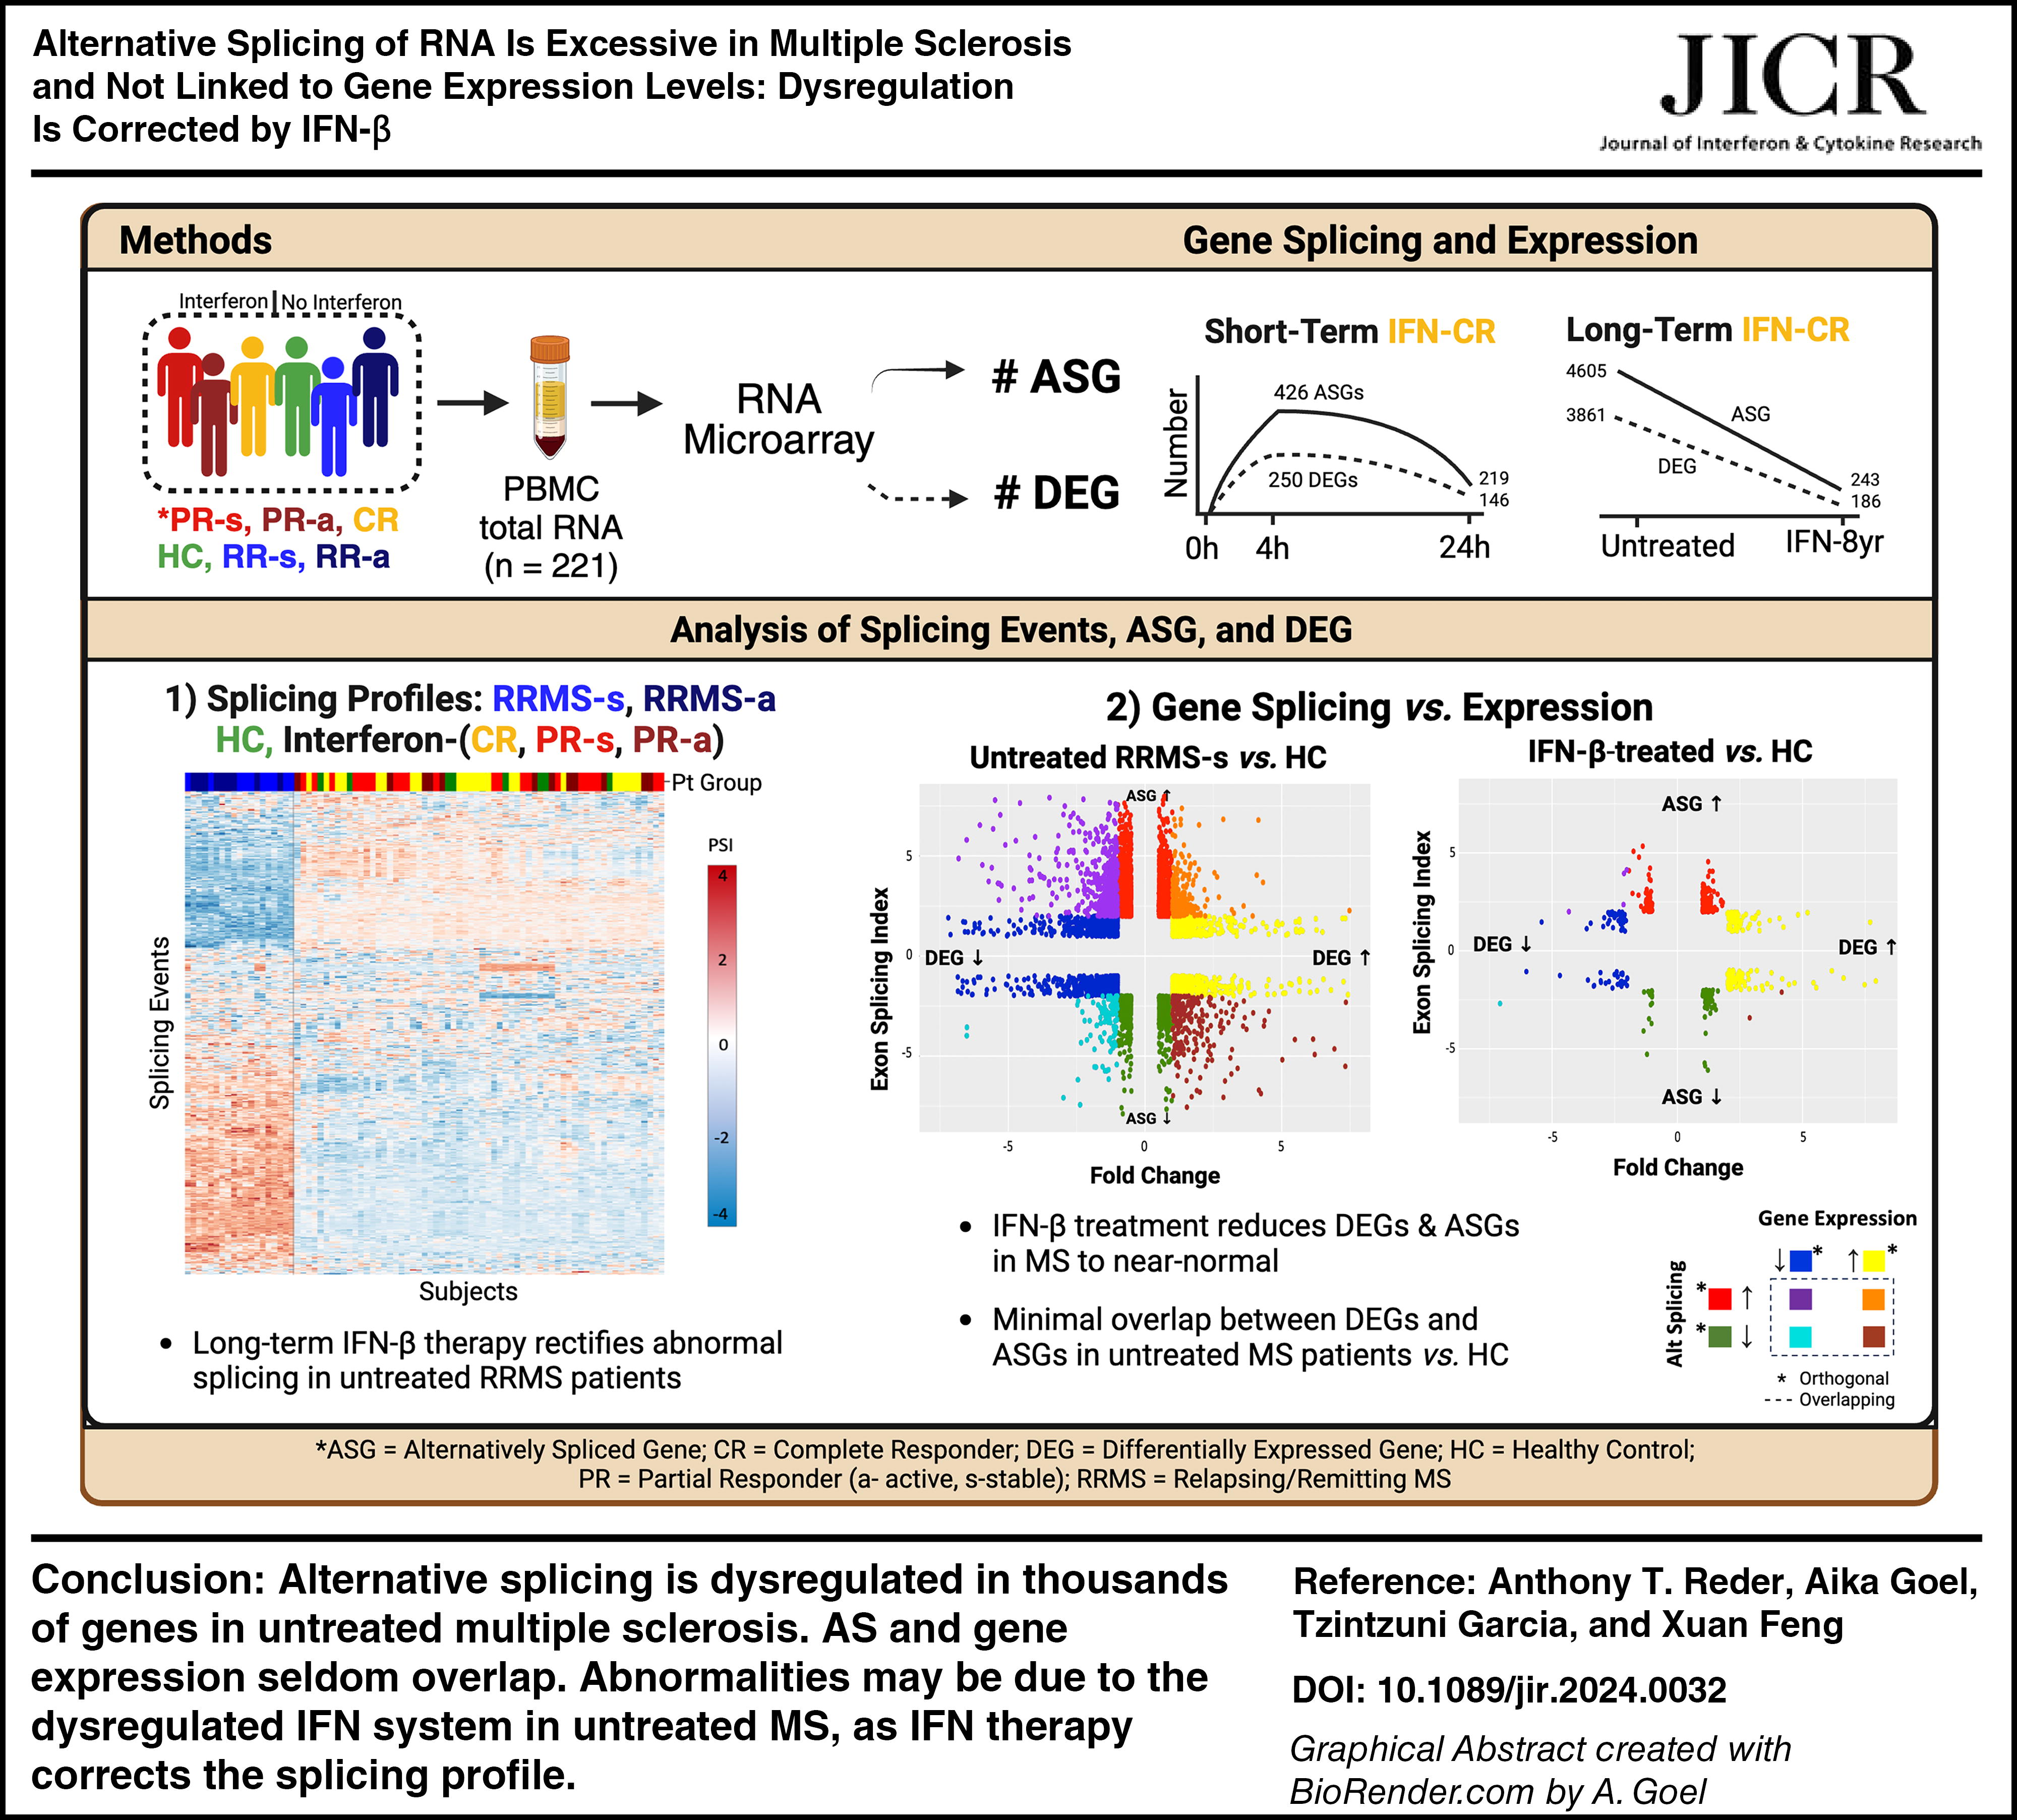
Untreated MS PBMC had 4,605 different alternatively spliced genes (ASG) and 3,861 DEG compared with HC. Only 16% of the ASG and DEG overlapped. Thus, AS was often (84%) independent of changes in gene expression. IFN-β-treated MS compared with therapy-naïve stable MS had 4,371 ASG and 3,621 DEG (Table 2). Totally, 1,174 (17.2%) showed overlapping alterations in both splicing and expression, 82.8% were orthogonal (Fig. 1A). Untreated MS had 10-fold more ASG than IFN-treated MS. Long-term IFN-β-treatment nearly normalized the large number of ASG and DEG in MS to HC levels (Fig. 1B; Table 2, MS washout during IFN-β therapy). Thus, long-term IFN-β therapy creates a new near-normal baseline level of gene splicing. Additionally, 298 ASG are unique to PR, and 172 unique to CR. These have potential predictive value, but require validation in another cohort.

The repertoire of differentially expressed genes (DEG) and alternatively spliced genes (ASG) in PBMC are largely distinct.
Genes Affected by Alternative Splicing Versus Differential Expression
“Both” includes parallel ASG and DEG. For example, in row 1, 15.9% of 8466 ASG + DEG overlap and 84.1% are orthogonal. Filters for ASG = −2 <ESI <2; event pointer P value < 0.05; and event score > 0.1. Filters for DEG = −2 < FC < 2; and P < 0.05.
Clinically stable or active, IFN-β-treated PR and CR after the first 4-day therapy washout, before 16 MU injection, unless otherwise noted.
Combined post-washout groups, before 8 and 16 MU injections. 0 h = 4 days after therapy washout. 8 MU = 8 million international units of IFN-β.
ASG, alternatively spliced gene; CR, complete responders; DEG, differentially expressed genes; IFN-β, interferon-beta; RRMS, relapsing/remitting MS; PR, partial responders; ESI, exon splice index; FC, fold change.
Other group comparisons exhibited this orthogonal pattern. During long-term IFN-β treatment, stable PR and CR after washout showed minimal overlap between ASG and DEG (1.7%). In short-term IFN responses, 4 and 24 h after injections, the number of ASG and DEG [here, IFN-stimulated genes (ISGs)] was 1/10 of the difference between therapy-naïve MS and HC. Only 0% to 7.5% of genes had overlapping AS and gene expression. During exacerbations on therapy, the overlap after washout (0%) was similar to stable PR and was only 2.9%–9.9% after injections. The persistent orthogonal pattern of ASG and DEG indicates that the induction and mechanisms underlying gene splicing and gene expression operate independently or may have complex interactions.
AS was profoundly dysregulated in therapy-naïve MS compared with HC and to long-term IFN-β-treated MS, who return to near normal levels of AS, and share the same space in PCA (Fig. 2). Extensive dysregulation of AS in untreated MS correlates with our findings of highly dysregulated gene expression in untreated MS PBMC (Feng et al., 2019a).
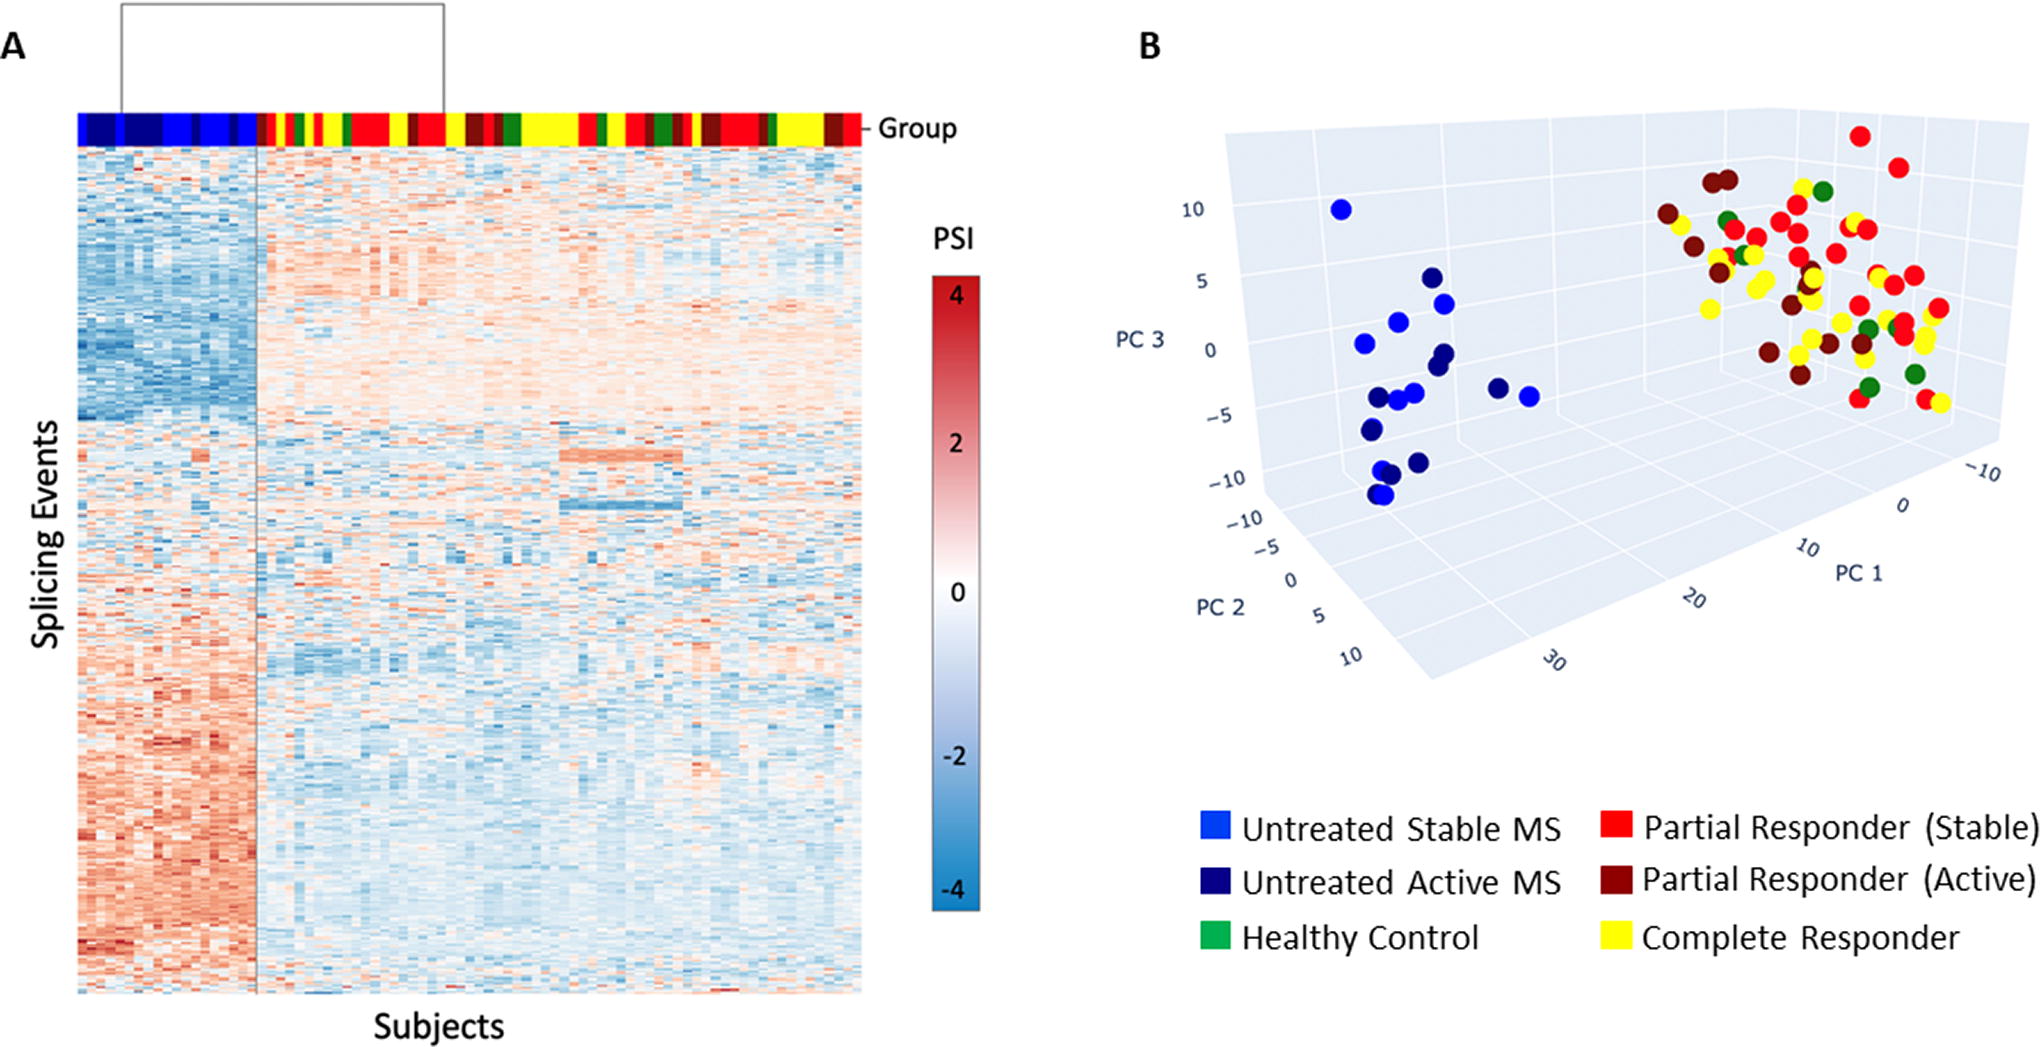
Alternative splicing in therapy-naive MS, long-term IFN-β-treated MS, and healthy control PBMC. Therapy-naive MS patients display a different splicing pattern than IFN-β-treated MS after IFN-β washout and healthy controls.
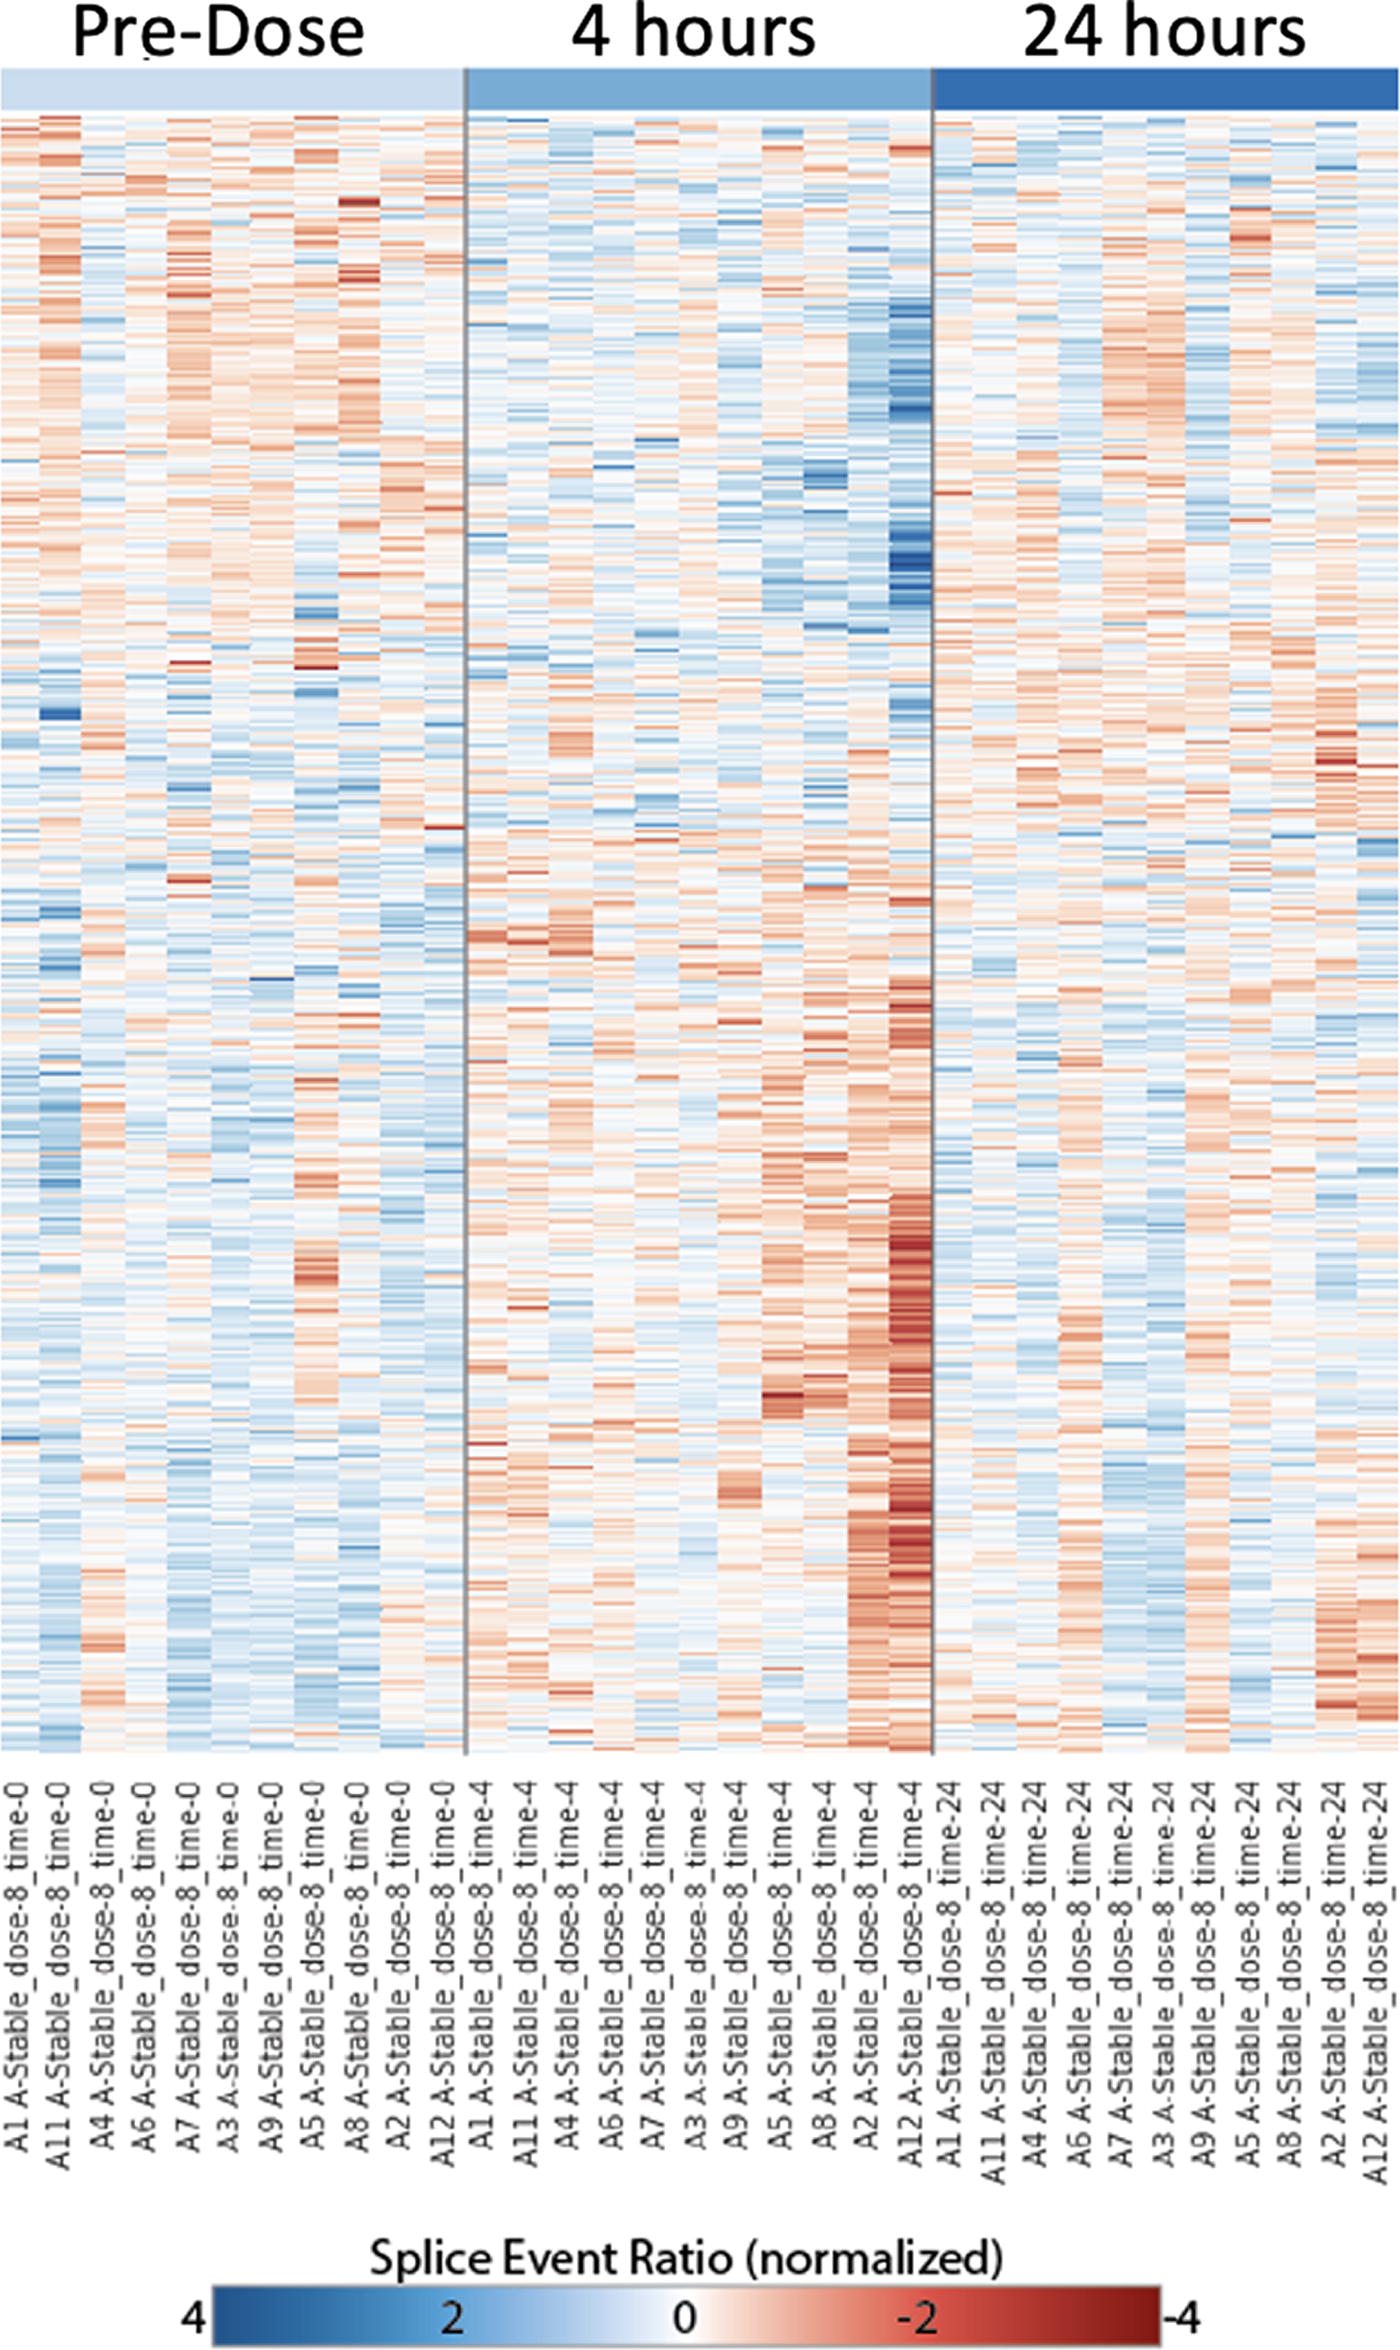
Alternative splicing, before and 4 and 24 h after IFN-β injection. IFN-β injection, 8 MU, in clinically stable CR MS induces a short-term alternative splicing response at 4 h, which returns toward the predose pattern at 24 h. Predose, time 0 is >4 days after last dose of IFN-β therapy. Each row corresponds to a particular splicing event generated from raw PSI values (splice event ratio). Intensity of red or blue indicates the strength of preference for 1 path or other. Rows are scaled [(x − μ)/σ: subtracted mean of row divided by standard deviation] to normalize the overall dynamic range. CR, complete responders; IFN-β, interferon-beta; MS, multiple sclerosis; PSI, percent splicing index.
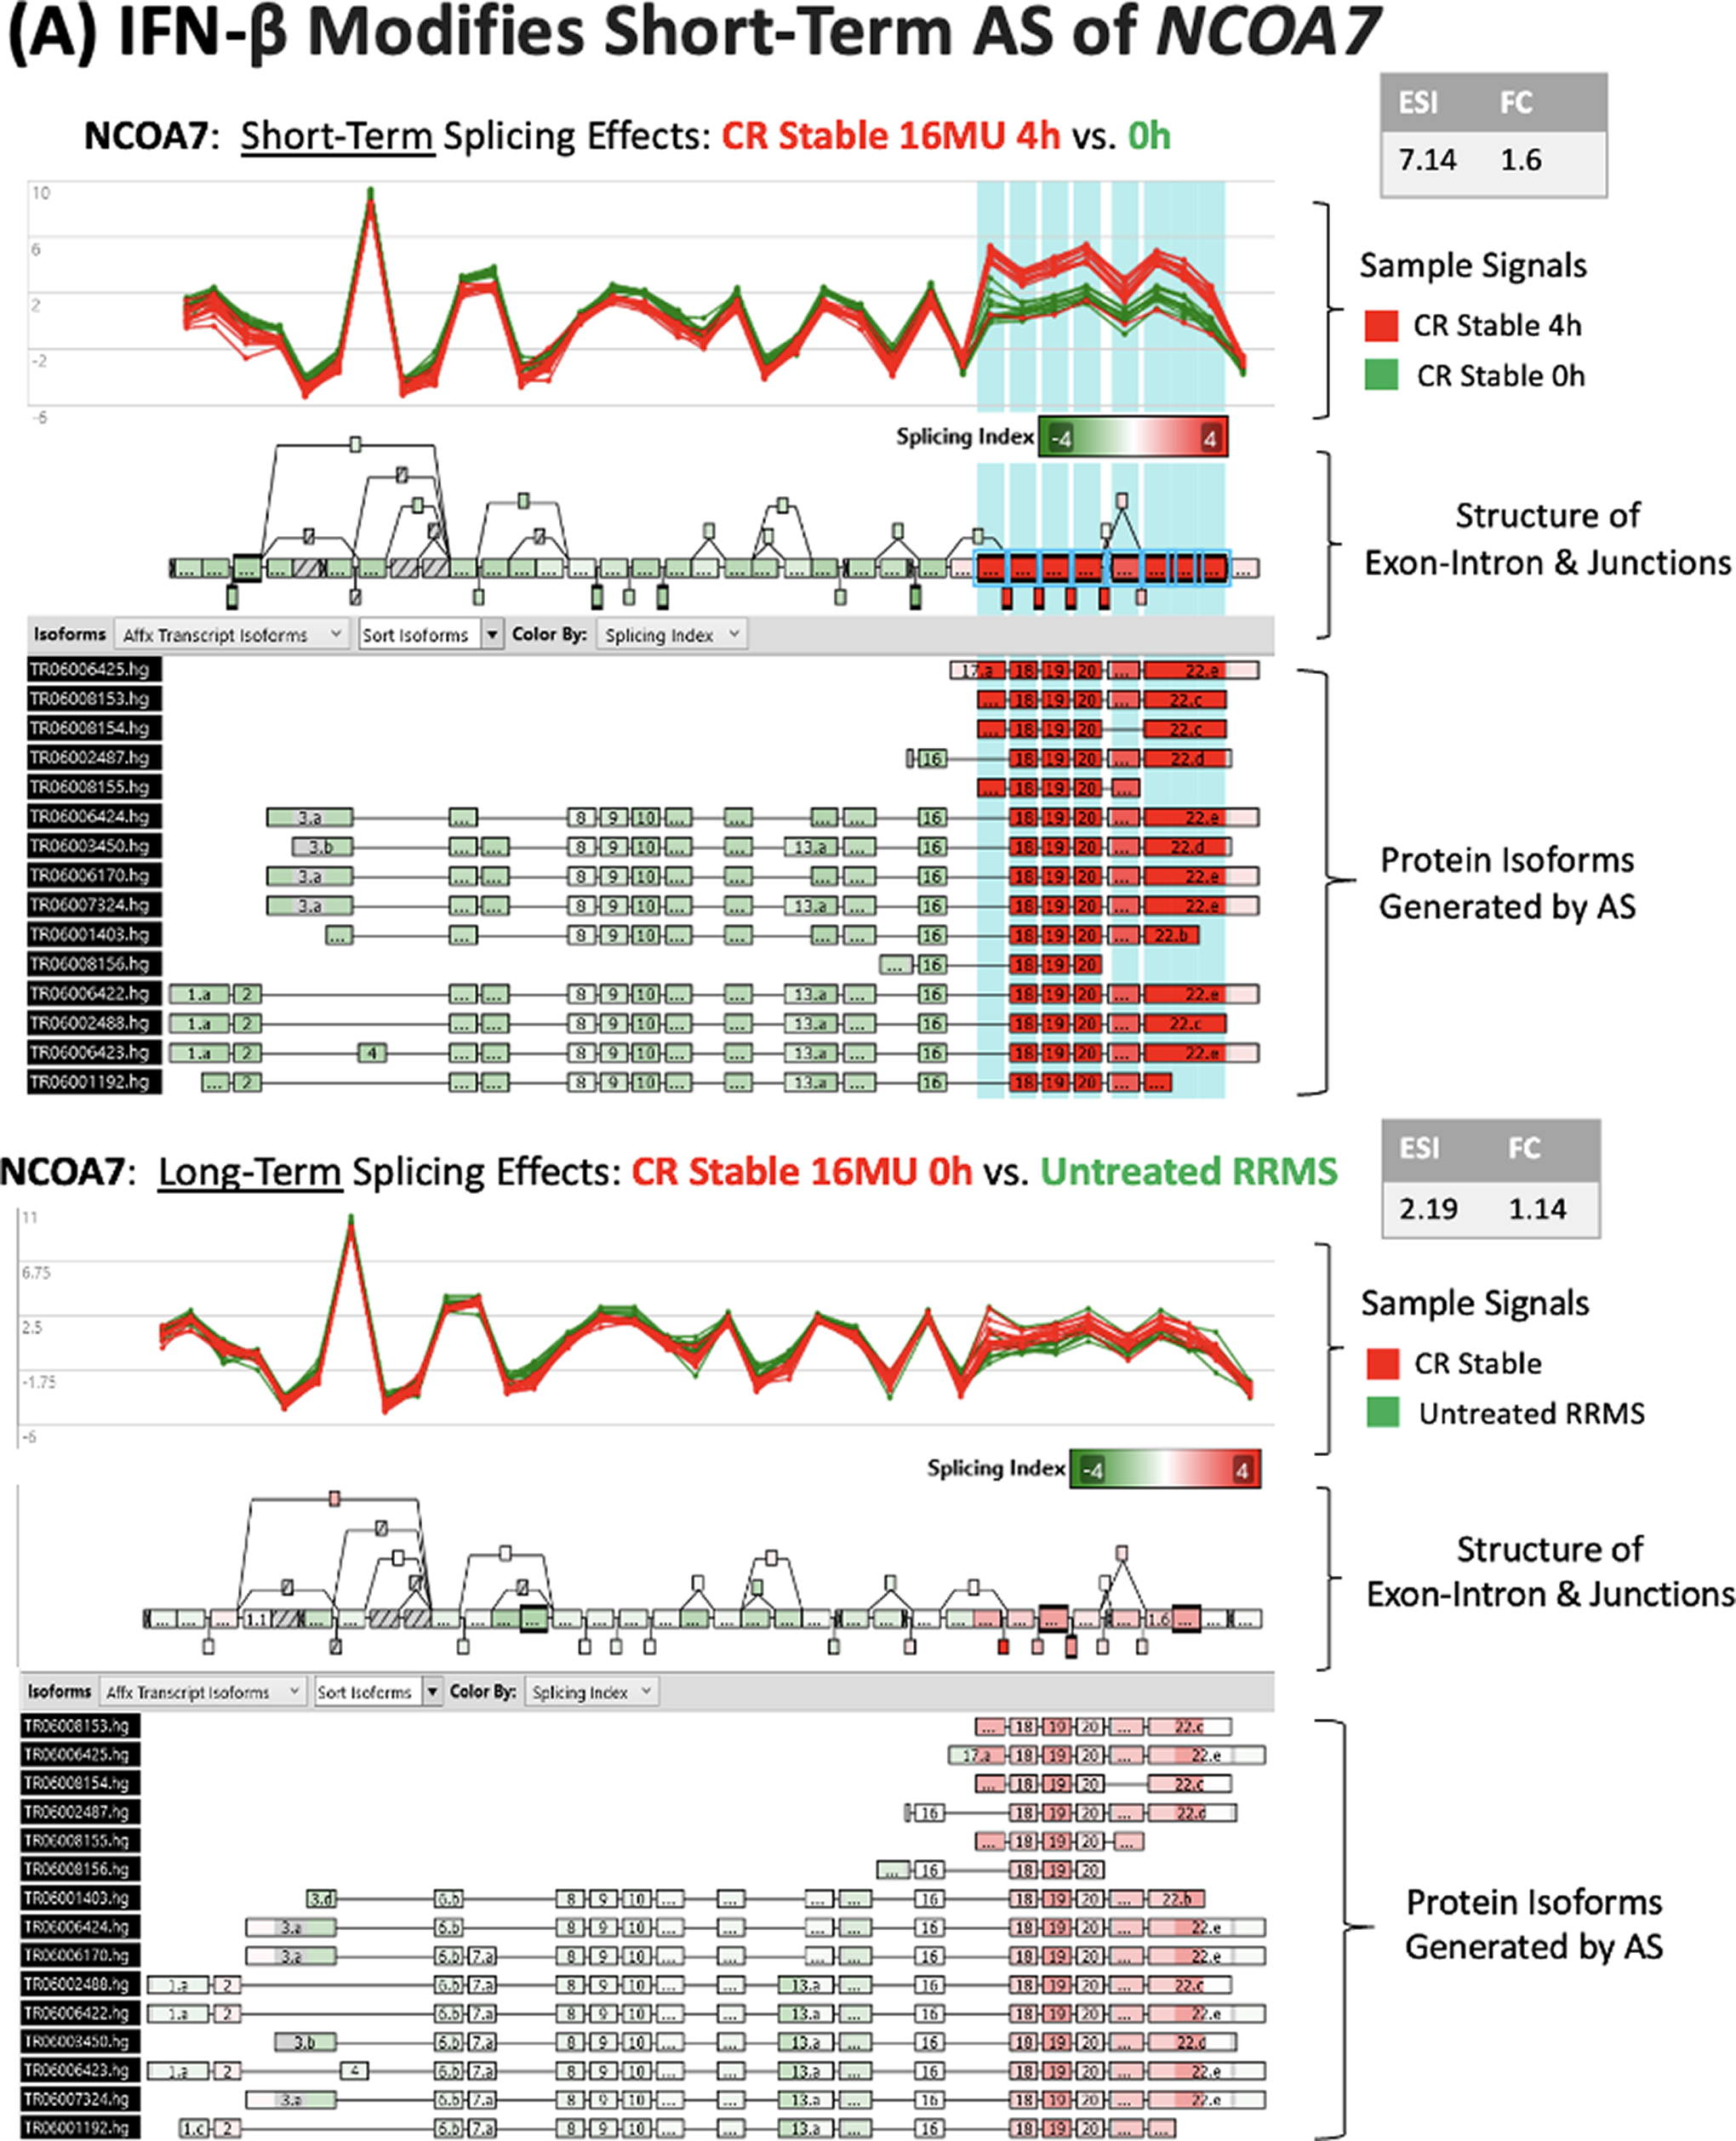
IFN-β injection modifies alternative splicing of NCOA7 and SPP1 in stable CR PBMC.

Alternatively spliced genes segregate into clusters with related biological effects
There are 5 major clusters of MS-relevant genes with extensive IFN-β-modified AS in IFN-β-treated stable CR and PR, after therapy washout, compared with untreated stable MS PBMC. Cluster analysis considers each ASG.
Cluster 21 was highly enriched (2.94-fold) with DAVID analysis. In this cluster, 167 ASGs are related to adaptive immune responses.
Cluster 28 is 2.45-fold enriched. Here, 11 ASGs control cellular response to interferon-β, type I IFN expression, and IFN signaling.
Cluster 46 is 2.08-fold enriched; 213 ASGs code for the structural motif, tetratricopeptide repeat (TPR). Interferon-induced proteins with TPRs form the IFIT family, a core component of antiviral responses. These genes also govern the effects of IFN-β on other clusters, suggesting the centrality of type I IFNs in the regulation of AS.
Cluster 34 is 2-fold enriched. Totally, 120 ASGs control RNA splicing and 115 ASGs control mRNA processing. Thus, in untreated MS, splicing in genes controlling splicing itself is highly divergent from normal and is strongly regulated by type I IFNs. The lack of introns in type I IFN genes, and therefore, lack of AS and simpler requirements for transcription during fever and stress, may protect IFNs themselves from the AS machinery that they unleash.
Cluster 37 is 1.94-fold enriched. In total, 13 ASGs mediate the positive regulation of telomere maintenance via telomerase. Eight ASGs control telomerase RNA localization to Cajal bodies, which are important in assembling ribonucleoprotein particles that control transcription, splicing, and ribosome genesis (Love et al., 2017). In patients who had MS for an average of 8 years before treatment, 5 years of IFN-β therapy prolonged life by 7 years compared with patients on placebo (Goodin et al., 2012). It is possible that endogenous type I IFN or therapeutic IFN-β affect telomere maintenance and other mechanisms to prolong lifespan.
IFN-β injection has a strong short-term effect on alternative splicing events that is maximal at 4 h and declines at 24 h
Four hours after an IFN-β injection in stable CR, splicing events increased or decreased at hundreds of sites (4 versus 0 h; 426 ASGs with 8 MU IFN-β, and 404 ASG with 16 MU) (Table 2)). The rapid change suggests that there is a direct effect of IFN-β on AS. By 24 h, many of these changes had returned toward post-washout levels (219 and 312, respectively). Surprisingly, the short-term IFN-β-induced AS in stable CR (e.g., 426 ASG at 4 h) was 1/10 of AS seen in comparisons of long-term IFN-β therapy such as between post-washout stable CR versus untreated stable MS (4,460 ASG at 0 h).
The modest short-term change in AS events is superimposed on the new set point that arises during long-term IFN-β therapy. The relative changes in AS parallel the 4-fold greater change in gene expression seen with long-term versus short-term IFN-β induction of DEG in the same groups (Feng et al., 2019a: Fig. 1).
The number of ASG differs between CR and PR MS patients during long-term IFN-β therapy
After IFN-β therapy washout, AS differed between IFN-β-treated stable PR and CR. PR had 369 ASGs and CR had 243 ASGs compared with HC; 83 ASG overlapped (5.45%) (Table 2). The more dysregulated state in stable PR versus CR (299 ASG, 61 DEG), even during IFN-β therapy, suggests that the level of AS after washout predicts future disease activity, as stable PR are destined to have a future attack. In IFN-β-treated, clinically active PR versus paired stable PR, there were 276 ASG and 93 DEG, suggesting a superimposed effect of MS exacerbations on gene regulation.
Short-term effects of 16 MU IFN-β on the number of ASG in PR during disease activity (467 ASG) and during stable periods (418 ASG) are similar at 4 h versus 0 h and at 24 h versus 0 h (Table 2). In stable CR, the number of ASG is similar 4 h after 8 MU (426 ASG) and 16 MU IFN-β injections (404 ASG). Unexpectedly, stable PR after 8 MU IFN-β injections had twice as many ASG and DEG as stable PR after 16 MU injection. This suggests a lower threshold for maximal effect of an IFN injection in PR.
ASG levels are replicable between groups. There are high levels of ASG in therapy-naïve MS compared with HC and moderate levels in PR and CR after washout, although PR active > PR stable > CR stable. The degree of AS among groups is also similar within short-term kinetic profiles. Our AS data parallel gene expression data. In MS relative to HC, there are 8,800 DEG in untreated MS versus HC and more unique DEG in stable PR (277 genes) than in CR (36 genes), with 86 DEG in common (Feng et al., 2019a: Table S5).
In therapy-naïve MS compared with HC and IFN-β-treated MS, there are large numbers of ASG and DEG. However, only 1 of 7 genes has simultaneous dysregulation of AS and DE. In addition, in short-term responses to IFN-β injection only 1 of 50 genes overlaps between ASG and DEG, i.e., ASG and DEG are highly orthogonal.
The microarrays used here, with deep coverage of splice sites, detected a large number of ASG and many AS events per ASG. For instance, in therapy-naïve stable RRMS versus stable IFN CR at 0 h (Table 2), there were 4,460 ASG. The 10 genes with the highest exon splice index (ESI) values averaged 11.3 ASE per gene. The 10 ASG just above the 1.5 ESI threshold averaged 3.3 ASE per gene. This compares to only 2.3 AS events per ASG using RNAseq, although quality control and quantitation thresholds may differ (García-Pérez et al., 2022).
Long-term IFN-β treatment regulates AS in individual genes relevant to autoimmunity and can differ from short-term effects
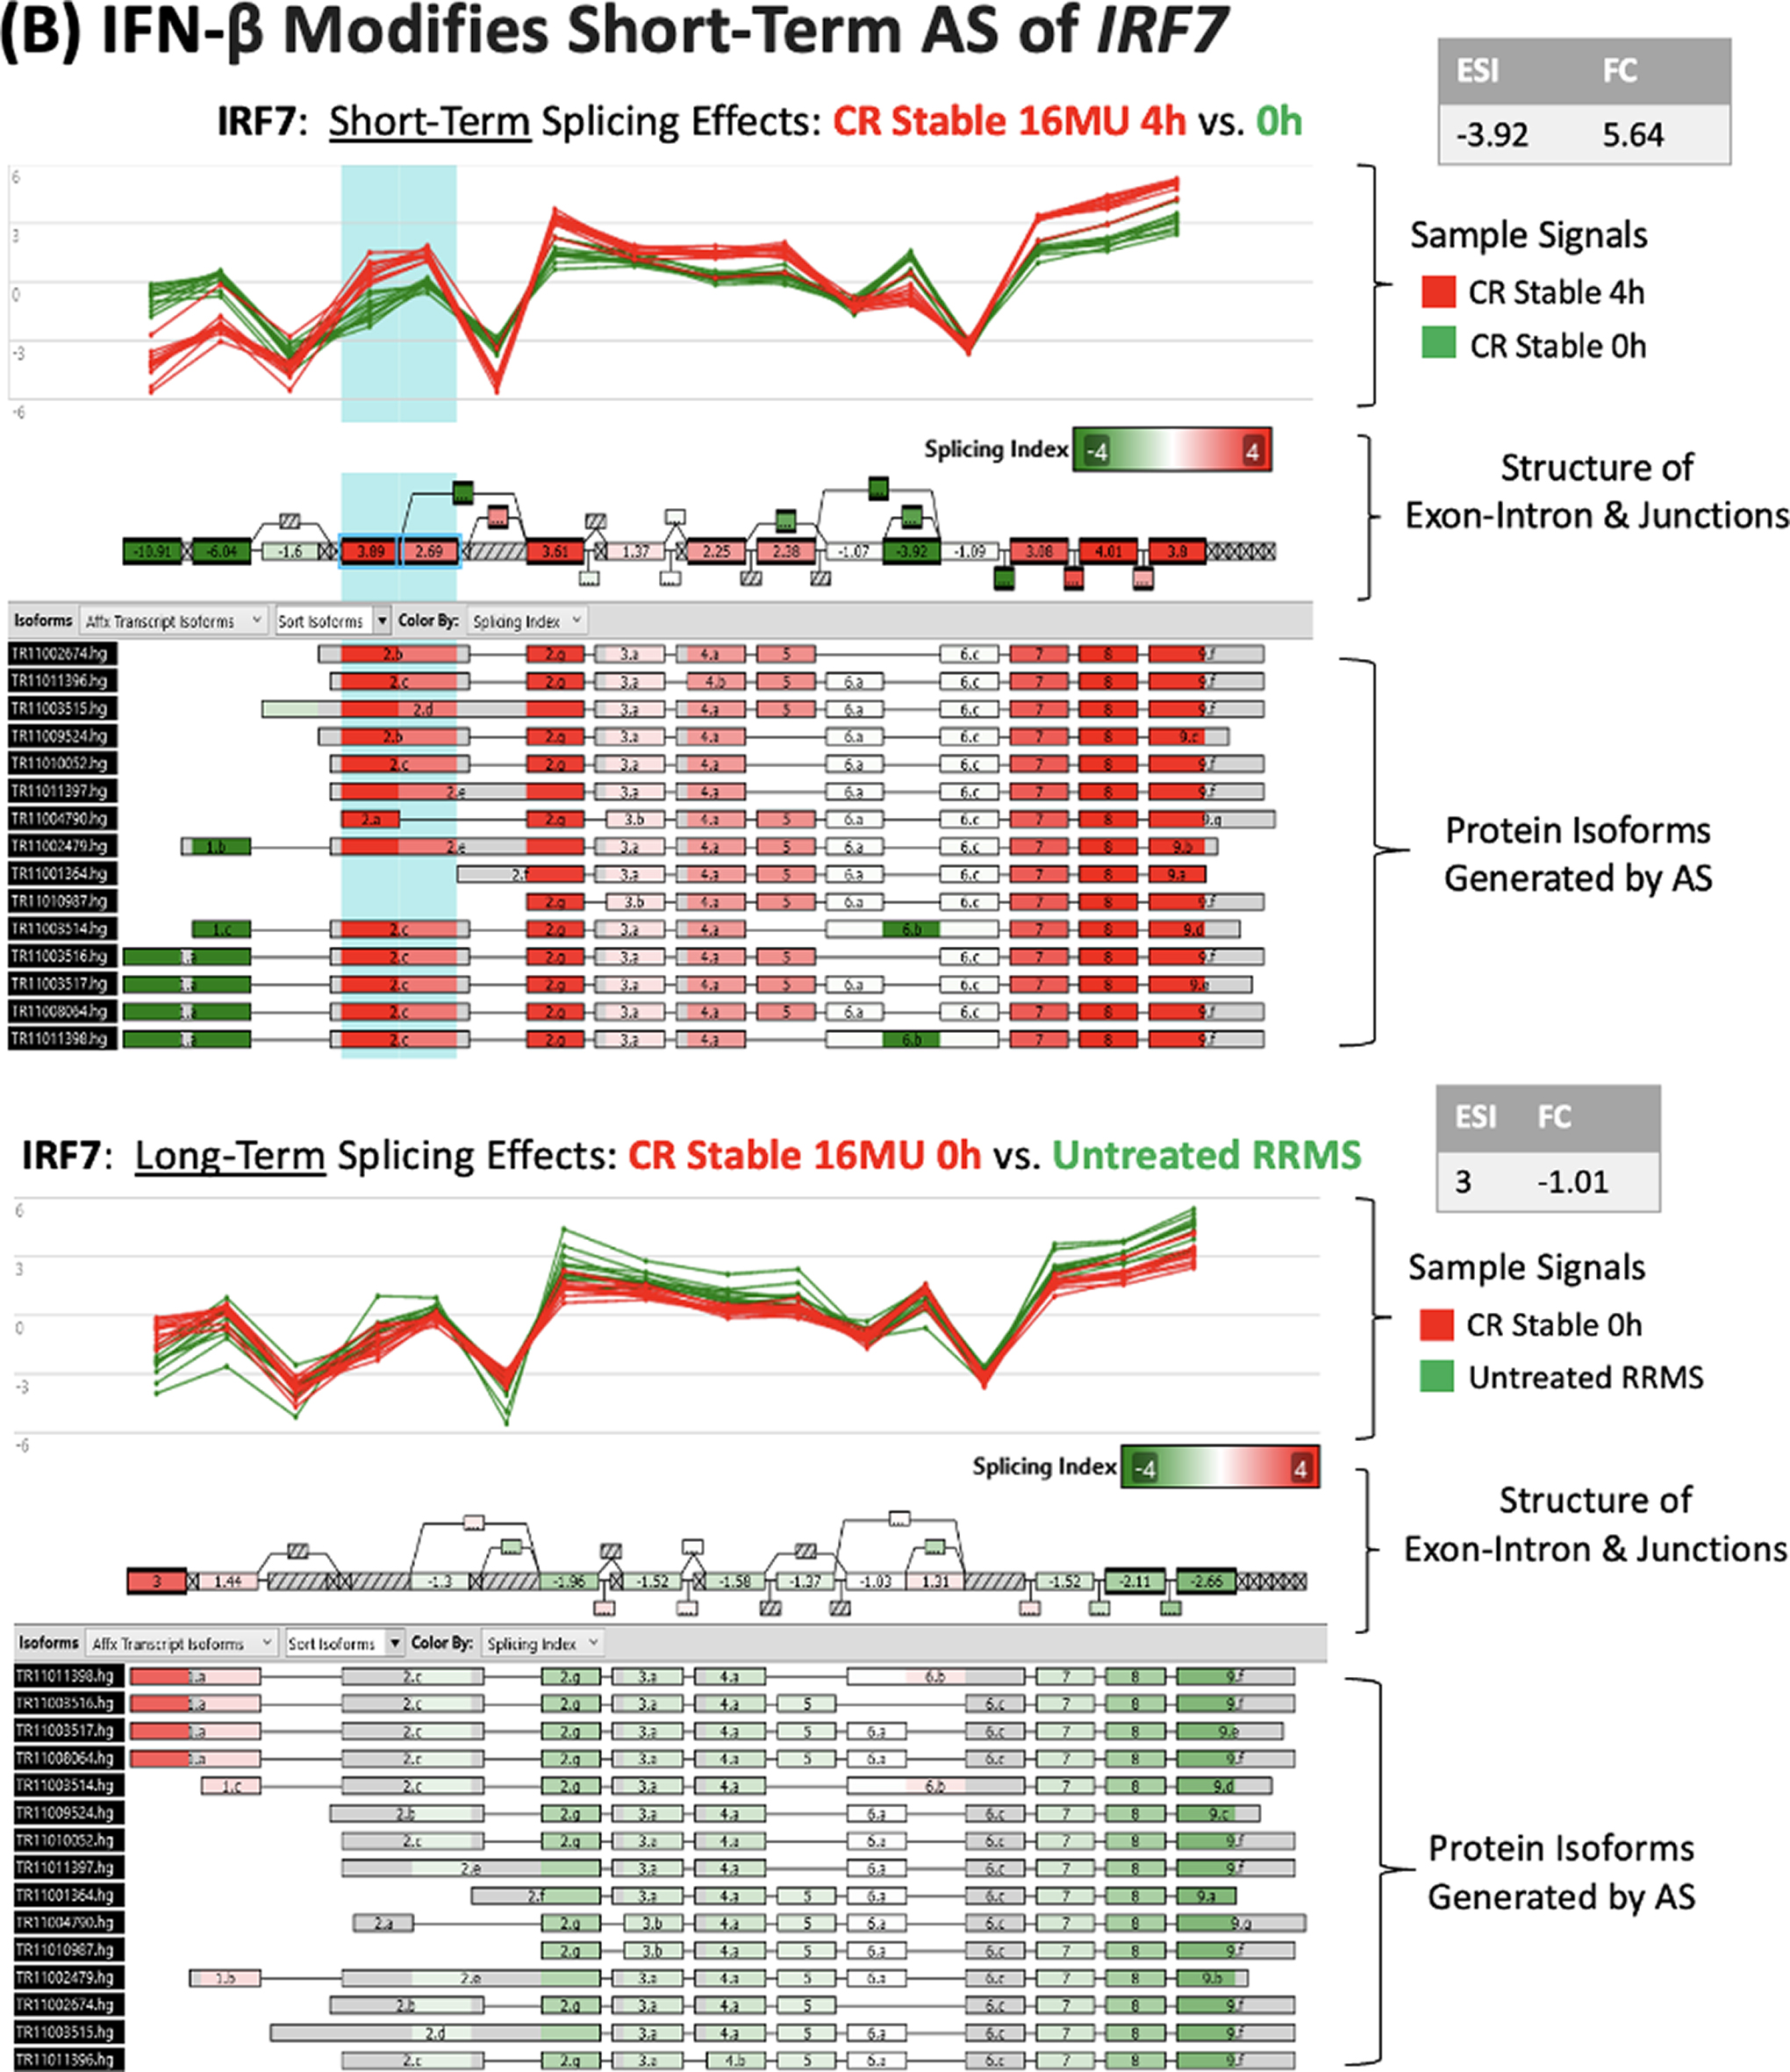
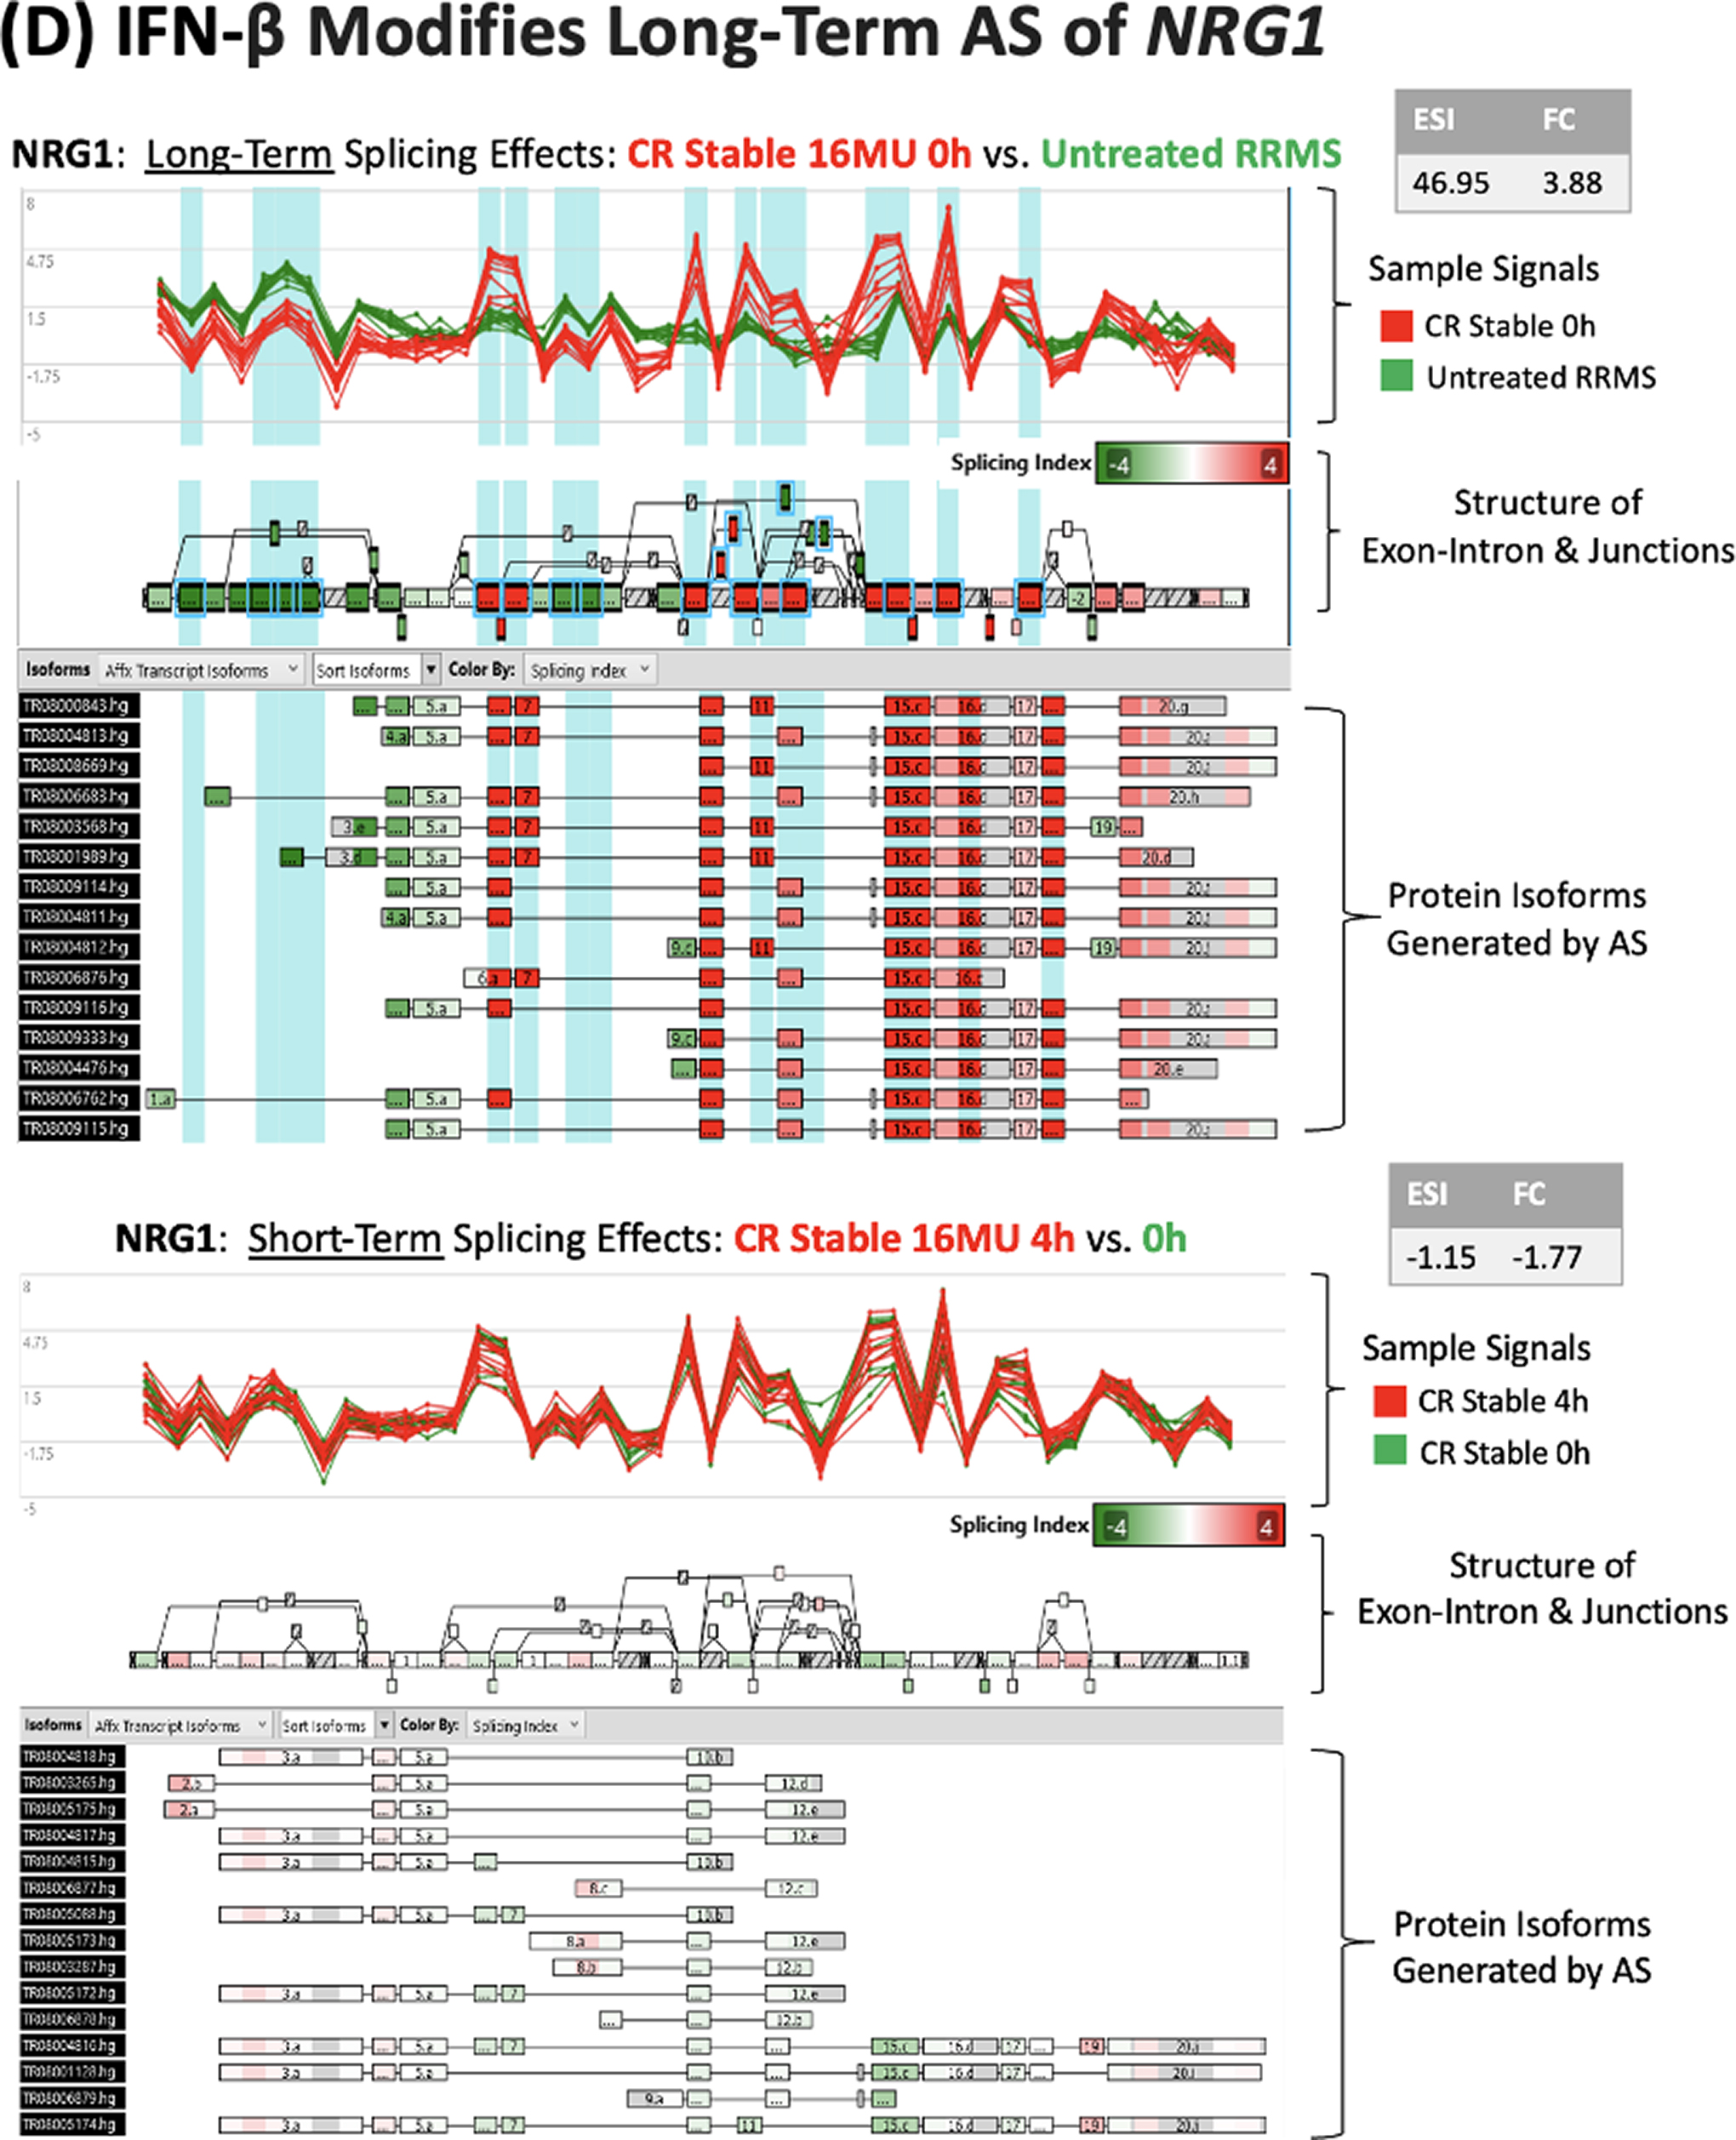
IFN-β-regulated ASG often code for proteins involved in immune regulation, antiviral responses, and neuronal and glial function that are relevant to MS. NCOA7, OAS1, IRF7, SPP1, and NRG1 genes illustrate differing patterns of AS and expression.
Short-term IFN-β injections in stable MS induced pronounced AS at 1 splice site in NCOA7, yet did not alter NCOA7 gene expression (Fig. 4A). The IFN-β-induced changes in AS complement in vitro findings that IFN-β transforms an estrogen-binding protein (NCOA7) to a smaller protein that regulates redox activity (NCOA7-AS) (Yu et al., 2015). IFN-β therapy-induced AS in NCOA7 might enhance neuroprotection and brain repair.
2′,5′-Oligoadenyate synthase (OAS) is an antiviral protein that activates latent RNase L, for an innate immune response against RNA viruses. A splice variant in Europeans, inherited from Neanderthals, generates a p46 isoform that is more active than the p42 isoform, enhancing anti-COVID responses (Zhou et al., 2021). Similar to NCOA7, IFN injection induced a 34-fold change in AS events for OAS and also a 36-fold increase in gene expression at 4 h, but only minimal long-term changes in AS or expression (data not shown).
IRF7 is induced by IFN-β and IFN-α4. It amplifies IFN responses by inducing multiple IFN-α subtypes. Virus-induced AS of exon 2 of IRF7 changes its half-life (K Lynch, Personal Communication, 2024; Thompson et al., 2020). IFN-β injection induces rapid changes in this exon in MS PBMC (Fig. 4B).
Osteopontin (OPN; SPP1) enhances inflammation by inducing Th1 cytokines and reducing IL-10 production in immune cells, but it is also neuroprotective (Duan et al., 2015). Long-term IFN-β therapy caused a 133-fold increase in SPP1 AS, but a 583-fold decrease in SPP1 expression (Fig. 4C). In contrast, 4 h after an IFN-β injection, SPP1 AS and expression were not changed.
Neuregulin (NRG1) controls myelin thickness and synaptic function (Kataria et al., 2021). Similar to SPP1, long-term IFN-β therapy markedly changes NRG1AS, yet has modest effects on gene expression, without short-term effects (Fig. 4D). AS at multiple sites in SPP1 and NRG1 is likely to generate multiple protein isoforms.
These examples complement other studies of splicing variants that affect immunity in MS. IL-7 controls lymphocyte homeostasis, including Treg. Exon 6 of the IL-7 receptor, when spliced out, increases soluble/membrane-bound IL-7Ra, which binds and decreases serum IL-7, changing immune subset balance (Evsyukova et al., 2010). A change in IL-7R in SNP rs6897932 is linked to development of MS. Similarly, a splice variant in CTLA4 reduces the amount of soluble CTLA-4. Low levels of this inhibitory protein diminish immune regulation and Treg development and worsen Grave’s disease, type I diabetes, and myasthenia gravis (Evsyukova et al., 2010).
IFN-β injection induces short-term changes in ASG pathways that reflect MS disease activity
Pathway analysis revealed that clinical activity of MS affected AS, even during IFN therapy. During MS exacerbations, IFN-β injections increased the number of ASG in canonical pathways for type I IFN signaling, antiviral innate immunity, immune function, IL-12 signaling in macrophages, and death receptor signaling (Fig. 5A), all relevant to MS immunopathology. In contrast, IFN-β injection reduced ASG in these pathways in clinically stable PR and CR (Fig. 5B and C), as well as active PR (data not shown). The proinflammatory state was more pronounced with ASG pathway analysis than with ASG numbers alone (Table 2) or with DEG and DEG pathway analysis (Feng et al., 2019a). This constellation of changes is a potential biomarker for disease activity. The trigger may be fluctuation in IFN levels or sensitivity to IFN. However, non-IFN, perhaps virus-induced, stimuli are possible (Feng et al., 2019b; Thompson et al., 2020).
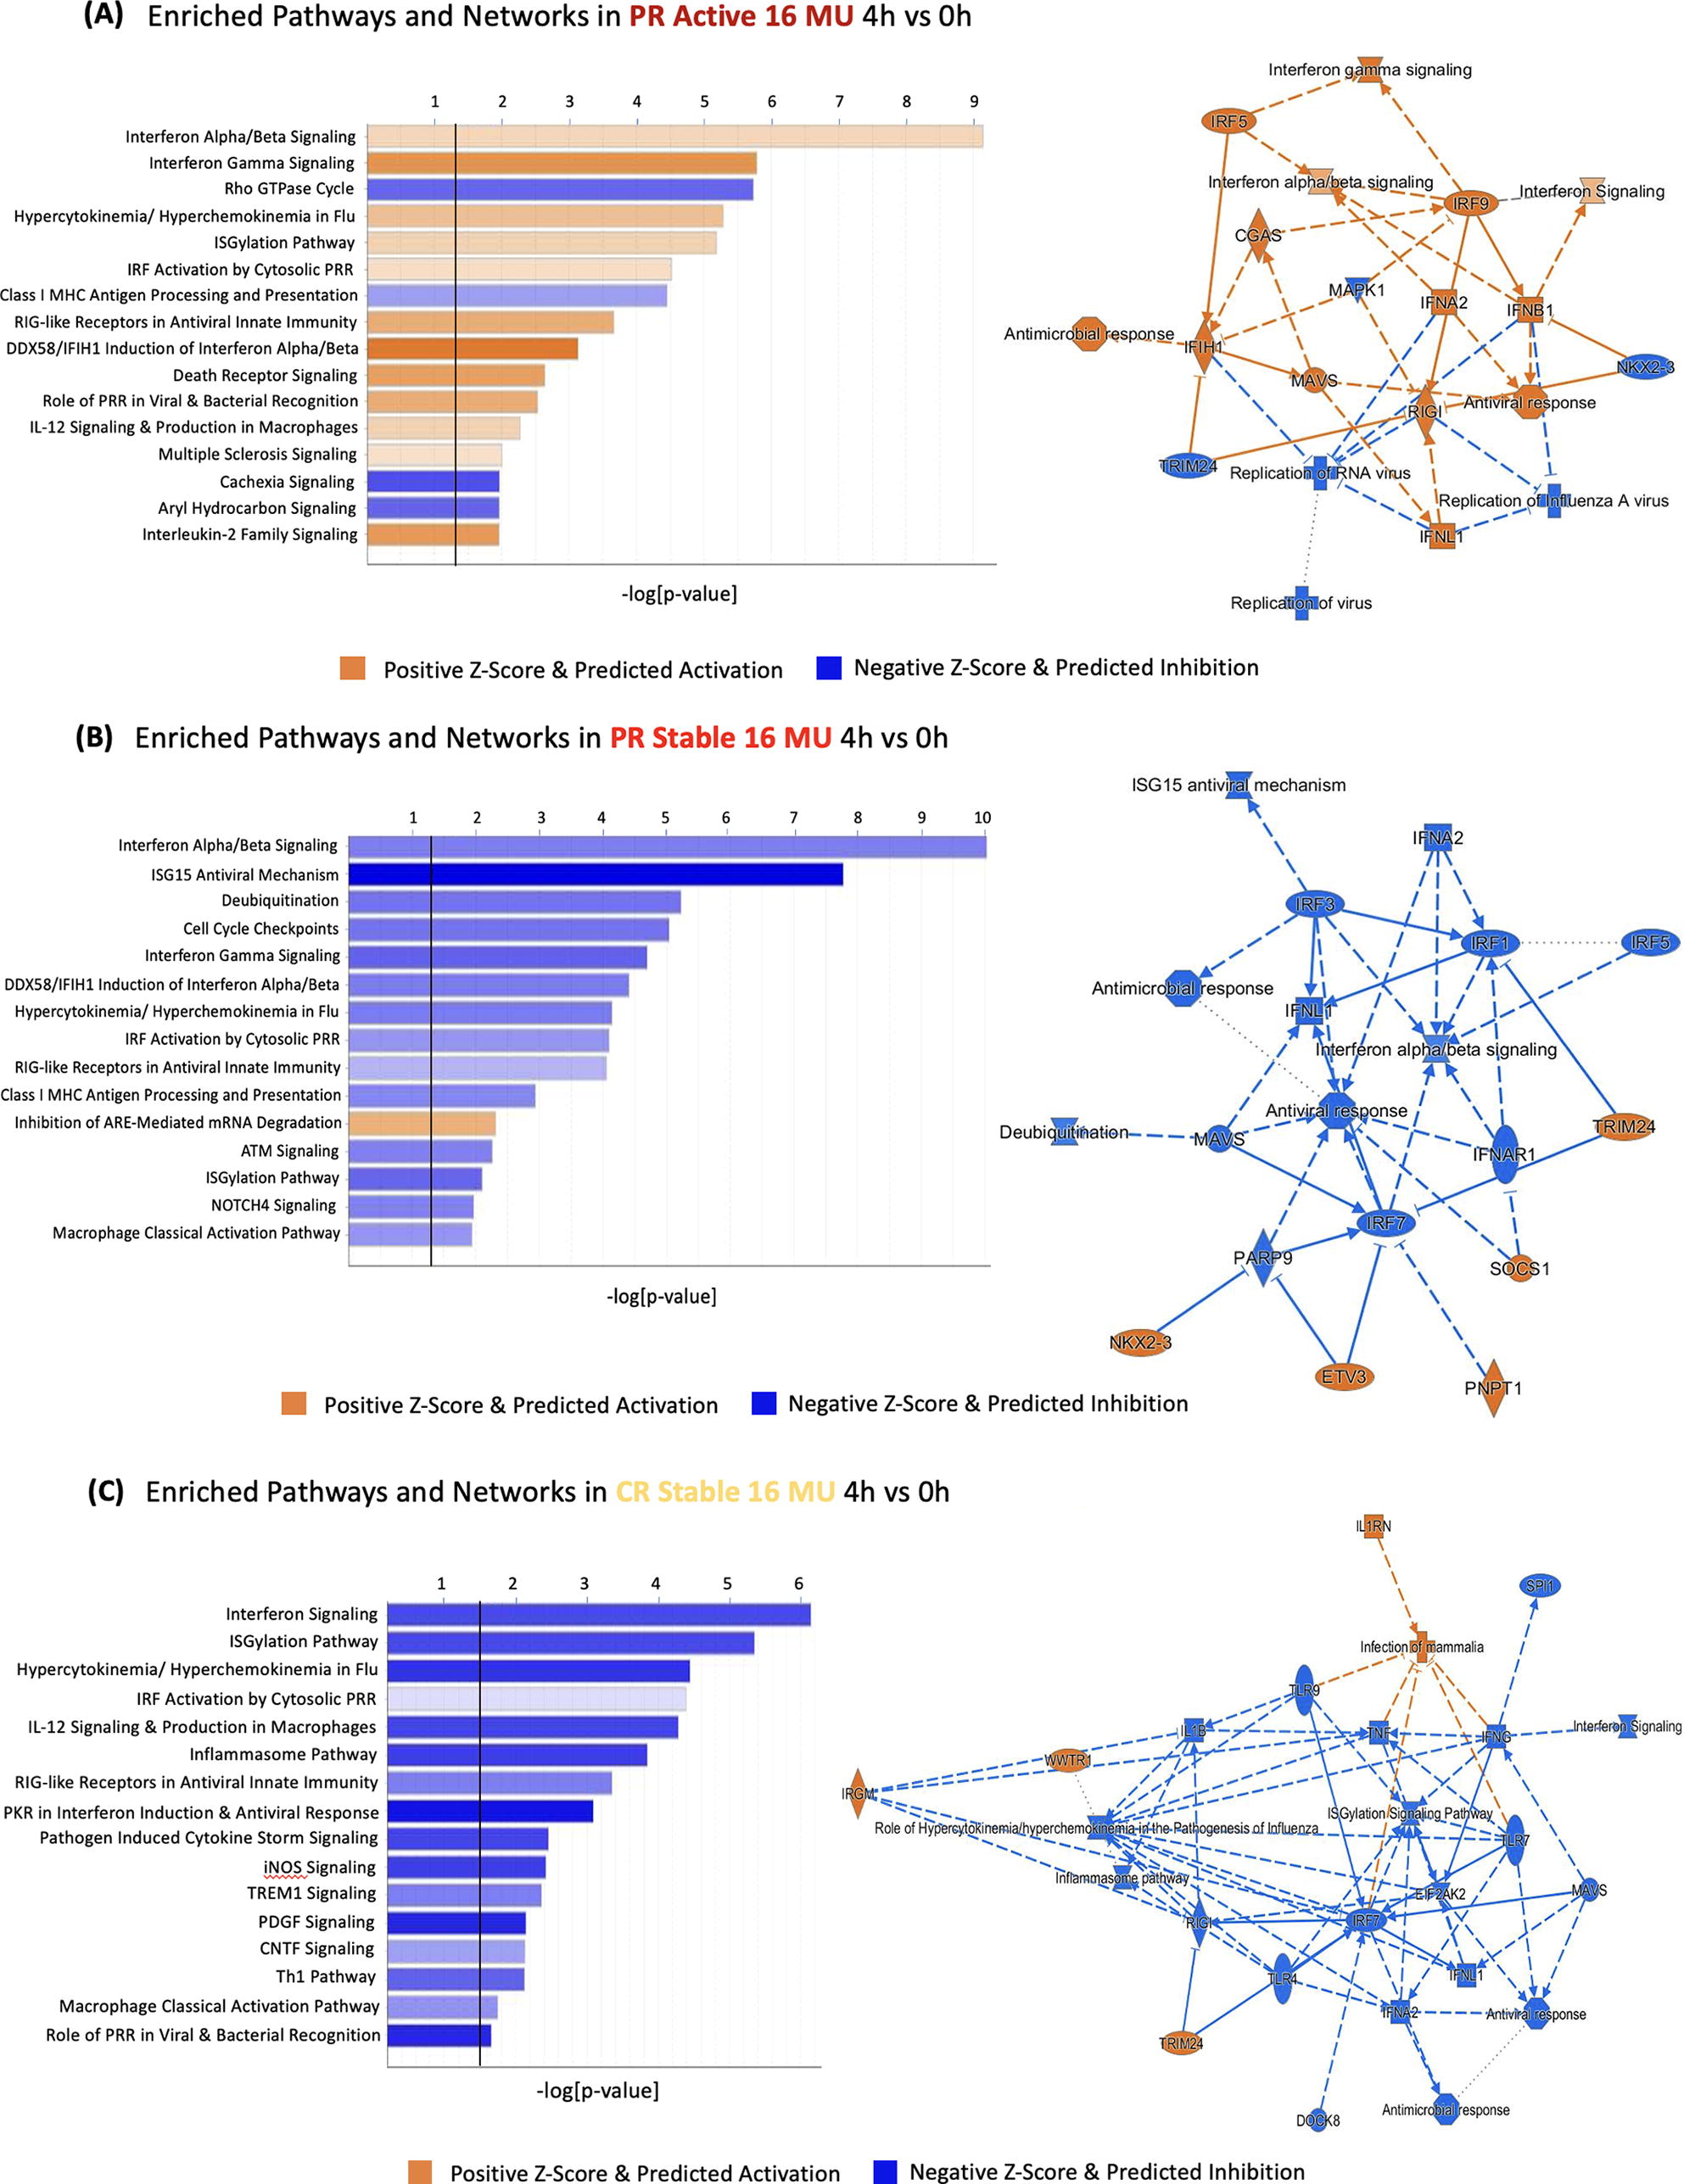
During exacerbations, pathways enriched in alternative splicing increase compared with stable MS. PR active and PR stable, 4 h after 16 MU IFN-β induction versus post—washout, 0 h. All IPA pathways shown passed the log (P value > 0.05) threshold (demarcated by black line). ARE, AU-rich element; IFN-β, interferon-beta; MS, multiple sclerosis; PR, partial responders.
Disease exacerbations appear to overcome the AS-suppressing effect of IFN-β on stable MS. These findings are consistent with the reduced signaling response to type I IFNs seen in vitro during exacerbations (Feng et al., 2002). Pathway analysis of aggregate ASGs during exacerbations showed more dramatic and directional changes than those seen in individual ASG (Table 2) or DEG (Feng et al., 2019a). Thus, ASG acting in concert reflect a proinflammatory state during MS exacerbations, even during ongoing IFN-β therapy.
Administration of 8 MU IFN-β injections induced more AS in stable PR than in CR within these IPA pathways (Table 2), reflecting greater sensitivity to IFN stimulation in PR, paralleling DEG responses (Feng et al., 2019a). There is no increase in ASG within immunoregulatory and neuroprotective pathways, in contrast to their increased DEG (Feng et al., 2019a).
Implications of AS regulation in untreated MS and the effect of IFN-β therapy
There are approximately 20,000 protein-coding genes in humans. The intron—exon structure enables AS, alternate transcription start sites, or alternative polyadenylation sites to generate diversity in the proteins encoded by a single gene (Grzybowska, 2012) and allows cell lines to express multiple protein isoforms simultaneously [Encyclopedia of DNA Elements (ENCODE); Djebali et al., 2012; Liu et al., 2017]. Each alternate splicing event can potentially affect the half-life, potency, and function of the transcribed protein, as exemplified by the NCOA7 gene (Yu et al., 2015) (Fig. 4A).
Many mutations linked to human disease disrupt splice sites or change splicing enhancers or silencers in pre-mRNA and change splicing of downstream target genes (Park et al., 2018). Splicing quantitative trait loci (sQTL) are enriched in untreated MS and are predicted to regulate AS of pre-mRNA (Li et al., 2016). GWAS signatures in MS predict that the effect magnitude of sQTL is at least as great as that of expression QTL (eQTL) (Li et al., 2016). GWAS DNA and RNAseq analysis show that sQTL are often independent of eQTL which affect levels of mRNA (Li et al., 2016).
Using RNAseq data from lymphoblastoid cell lines of 462 people, 57% of genetic variants that affect expression (eQTL) or splicing (sQTL) are independent of each other, based on indirect estimates of eQTL (Lappalainen et al., 2013), complementing our data. The orthogonal relationship of ASG and DEG should allow increased control and diversity of cellular responses during type I IFN-activated immune, anticancer, and antiviral responses and during IFN-β therapy of MS. Disease state–dependent variation in AS profiles in MS (Fig. 5) suggests that AS is modified by inflammation and by the transient reduction in responses to endogenous IFN-β during exacerbations (Feng et al., 2002).
Untreated MS exhibited AS in 4,605 genes compared with healthy control PBMC (Table 2). IFN-β therapy decreased AS to a near-normal state, with only several hundred ASG (Fig. 1B). The changes in AS parallel the altered expression in ≥1 of the IFN-β-treated and untreated MS groups compared with HC in 6,434 coding and 2,362 noncoding genes and with the reduction of DEG to fewer than 400 during long-term IFN-β therapy (Feng et al., 2019a). In total, 162 of the DEG carry MS-associated SNPs in GWAS (IMSGC, 2019). Long-term IFN-β therapy suppresses inflammation in MS patients (Feng et al., 2019a) and normalizes the expression of genes whose products affect AS itself, e.g., cluster #34, above.
The massive dysregulation of AS in MS seen with high-density probes of splice junctions and normalization of AS by IFN-β therapy extend earlier reports. Meta-analysis of 36 studies in MS identified AS in 27 protein-coding genes (Hecker et al., 2019). During fingolimod treatment of 10 RRMS patients, 19 genes were alternatively spliced in at least 1 of 5 PBMC subsets. Second, 5 preselected GWAS-identified B cell genes linked to MS exhibited AS (Putscher et al., 2022). Finally, 30 of 198 AS-affected genes linked to MS progression were enriched in patients’ blood and predicted to modify protein–protein interactions or phosphorylation (He et al., 2021). The authors proposed that these changes are related to a defect in phospho-serine-STAT1 formation in MS (Feng et al., 2002). These studies support a link between AS, type I IFN regulation of AS, and disease activity in MS.
Protein abundance is not always proportionate to transcript levels and is influenced by AS. For instance, if AS leads to intron retention, the intron-containing pre-RNA is more likely to remain in the nucleus and thereby reduce levels of the corresponding protein (Liu et al., 2017). Second, 14% of the genes captured with HTA expression analysis are long noncoding RNAs (lncRNA) (Feng et al., 2019a). lncRNAs are often poorly spliced (Krchnáková et al., 2019) and can use noncanonical splice junctions, thus less likely appearing in AS analysis. Finally, AS of protein-coding genes could generate isoforms that hinder detection by antibody-based assays (Reder, 1992).
MS is a disease with subnormal responses to IFNs, in which IFN-β therapy modifies the expression of many genes controlling immune regulation and other biological processes (Feng et al., 2002). In contrast, high serum type I IFN levels and excessive responses to type I IFNs characterize autoimmune diseases including SLE, Sjögren’s syndrome, and neuromyelitis optica (NMO) (Reder and Feng, 2013; Feng et al., 2012). In Down’s syndrome, where proteins in the IFN signaling pathway are increased by trisomy of their genes on chromosome 21, splicing is also altered (Araya et al., 2019; Reder and Feng, 2013). IFN-α and IFN-β also could affect proliferation of healthy and cancer cells by regulating AS. Finally, IFN-β therapy has unexplained benefits that might be attributable to changes in AS. In a 21-year follow-up of the pivotal 5-year IFN-β-1a trial, IFN-β therapy prolonged longevity in MS by 7 years (Goodin et al., 2012).
Viruses are alternative spliced. Influenza virus hijacks the splicing machinery to produce multiple virus proteins and induces widespread alterations in splicing in A549 fibroblasts (Ashraf et al., 2020; Thompson et al., 2020). HSV-1 and RNA virus infections cause profound and orthogonal changes in both gene expression and AS in human fibroblast cell lines (Hu et al., 2016; Thompson et al 2020). Type I IFN induced by viruses and RNA vaccines is thus likely to affect AS. Viruses also modify AS through additional non-IFN pathways (Thompson et al., 2020).
Summary
Type I IFN has a fundamental role in controlling AS. AS is significantly increased in untreated MS, and long-term IFN-β therapy corrects (i.e., decreases) AS to near healthy control levels. Short-term IFN induction in MS PBMC causes a transient change in AS, but is 10-fold less than the difference in ASG between therapy-naïve and long-term treated MS cells. Clinical partial responders to IFN therapy have stronger ASG responses to standard-dose injections of IFN-β compared with CR with no exacerbations over
Footnotes
Data Availability
Processed data files are provided as supplementary tables. Raw microarray data files are available at the National Center for Biotechnology Information (NCBI) Gene Expression Omnibus (GEO) repository, Accession #GSE138064.
Author Disclosure Statement
A.G. and T.G.: Nothing to declare. X.F. and A.T.R.: unrestricted research grants from Bayer, Biogen, and Serono, all manufacturers of IFN-β.
Author’s Contributions
X.F. and A.T.R.: concept, writing, data processing, analysis, and interpretation, patient accrual, phlebotomy, processing blood, RNA, and microarrays. A.G. and T.G.: writing, data processing, analysis, and interpretation.
Funding Information
The authors are grateful for the funding provided by unrestricted grants from Bayer Pharmaceuticals and the US National MS Society, NMSS RG#4509A, and to the University of Chicago Genomics Core facility for microarray assay. Summary figure created with BioRender.com.