
Abstract
Abstract
Purpose:
To compare the 24-h changes of intraocular pressure (IOP) and mean ocular perfusion pressure (MOPP) obtained with tafluprost versus travoprost in patients with normal-tension glaucoma (NTG).
Methods:
This study is a randomized crossover study of 50 patients newly diagnosed with NTG who received either tafluprost or travoprost given once at 9 PM for 2 months, after which they were crossed over to the other medication for another 2 months. IOP and blood pressure were measured for 24 h before starting the treatment and after finishing the first and second treatment periods.
Results:
Forty-one patients completed the study. The mean (±standard deviation) 24-h IOP was 16.8±2.0 mmHg at baseline, 14.4±2.2 mmHg on tafluprost, and 13.6±1.8 mmHg on travoprost. Both prostaglandin monotherapies significantly reduced mean 24-h IOP as compared with baseline (P<0.001, P<0.001, respectively), and travoprost demonstrated a lower mean 24-h IOP than tafluprost (P=0.044). Both treatments significantly reduced the IOP from baseline at every point over 24 h. At 3 individual time points, travoprost provided a lower IOP than tafluprost: at 4 PM (13.8±2.7 vs. 14.8±2.6 mmHg, P=0.041), at 6 PM (13.5±2.5 vs. 14.4±2.5 mmHg, P=0.006), and at 8 PM (13.3±2.5 vs. 14.5±2.4 mmHg, P=0.029). Both tafluprost and travoprost significantly increased the 24-h MOPP (P=0.008, P=0.002, respectively), and travoprost demonstrated a greater 24-h MOPP than tafluprost (P=0.027).
Conclusions:
Both tafluprost and travoprost were effective in lowering IOP and increasing MOPP throughout 24 h in NTG. However, travoprost reduced IOP greater than tafluprost in the late afternoon and evening.
Introduction
P
Prostaglandin analogs have become a popular first-line therapeutic option in patients with NTG because they reduce IOP throughout a 24-h period and do not lower BP.8–11 Travoprost 0.004% (Travatan; Alcon Laboratories, Fort Worth, TX) is a synthetic ester prodrug of a prostaglandin F2 (PGF2α) analog with high affinity for the prostaglandin F (FP) receptor and was first marketed in 2001. Tafluprost 0.0015% (Taflotan; Santen Pharmaceutical Co., Ltd.) is a relatively new PGF2α derivative, which was launched commercially in 2008.
Numerous studies have compared the IOP lowering efficacy of latanoprost with that of travoprost or with that of tafluprost.12–19 Travoprost was equal to or superior to latanoprost in lowering IOP in patients with open-angle glaucoma, ocular hypertension, or exfoliative glaucoma.13,15,19,20 Tafluprost demonstrated a similar 24 h IOP profile compared with latanoprost. 14 Noninferiority of tafluprost to latanoprost over diurnal IOP measurements was shown throughout a 24-month study period. 12
One published study has compared the IOP lowering effects of tafluprost and travoprost in patients with NTG, which found them to be equally effective. 21 Measurements of IOP throughout a 24-h period, rather than at a single time point, would provide a more robust estimate of IOP treatment effects. 18 The Low-Pressure Glaucoma Treatment Study revealed that a lower mean ocular perfusion pressure (MOPP) during follow-up was significantly associated with visual field progression in NTG. 4 However, the circadian changes of IOP and MOPP were not measured in the previous study. 21 The aim of this study was to compare the 24-h efficacy of tafluprost and travoprost on the IOP and MOPP in patients with NTG.
Methods
This is a randomized, crossover study that compares the 24-h effects of tafluprost with travoprost on the IOP and MOPP in patients with NTG. Written informed consent was obtained from all participants and this study was approved by the Institutional Review Board at Pusan National University Hospital, and conformed to the tenets set forth in the Helsinki agreement. At the screening visit, all participants underwent a complete ophthalmologic examination, including best corrected visual acuity, slit lamp examination, gonioscopy, and fundoscopy. All patients had red-free retinal nerve fiber layer photographs, optic disc stereo photographs, spectral domain optical coherence tomography (Cirrus; Carl Zeiss Meditec, Dublin, CA), and automated visual field examination with the 30–2 SITA program on the Humphrey 740 Visual Field Analyzer (Carl Zeiss Meditec).
The diagnosis of NTG was based on the following eligibility criteria: (1) untreated IOP ≤21 mmHg measured by Goldmann applanation tonometry at intervals of every 2 h from 9 AM to 5 PM, (2) presence of glaucomatous optic nerve appearance and corresponding visual field loss, and (3) open angles on gonioscopy. This study excluded patients who suffered from any other ocular pathology, had history of intraocular surgery, and used IOP lowering drugs. Patients with IOP greater than 21 mmHg at any time during the in-hospital 24-h monitoring were excluded. Patients on antihypertensive or other hemodynamically active medications were not excluded.
Glaucomatous optic disc changes were characterized as focal or diffuse neuroretinal rim thinning, localized notching, cup-to-disc ratio asymmetry of 0.2 or more, or retinal nerve fiber layer defects congruent with visual field defects. Glaucomatous visual field defects were defined by 2 of the following 3 criteria: (1) the presence of a cluster of 3 points on a pattern deviation probability plot with P<0.05, one of which had P<0.01; (2) a pattern standard deviation (SD) with P<0.05; or (3) glaucoma hemifield test results outside normal limits. A reliable visual field test had to fulfill 3 criteria: fixation loss less than 20% and false-positive and false-negative rates of less than 15%.
Since none of the patients received prior glaucoma therapy, no washout period was required prior to enrollment. At the baseline visit, patients were randomly assigned to receive either travoprost 0.004% once every evening (9 PM) or tafluprost 0.0015% once every evening (9 PM) for the first 8-week treatment period and then were crossed over to the other drug during the second treatment period. No washout period separated the 2 treatment periods. At the baseline visit, and during the last 24 h of each 8-week treatment period, patients underwent in-hospital 24-h assessment of IOP and BP. The 8-week treatment period was chosen to avoid a carryover effect of the drugs under investigation.19,22,23 Stewart et al. previously reported that the mean IOP normalizes by week 8 after discontinuation of latanoprost. 22
IOP was measured with a Goldmann applanation tonometer mounted on a slit lamp in the sitting position every 2 h except for the period between 12 AM and 6 AM, during which measurements were taken with a handheld electronic tonometer (TonoPen® XL; Medtronic Solan, Jacksonville, FL) every 3 h in the supine position. Two IOP readings were obtained and the values were averaged. If the measurements differed by 2 mmHg, a third measurement was taken. Previous studies reported that the correlation between IOP measurements with the TonoPen and the Goldmann applanation tonometer was excellent and IOP measurement with the TonoPen closely corresponds to the Goldmann applanation tonometry at the IOP interval of 10–19 mmHg.24,25 All measurements were recorded by 2 well-trained evaluators, who were tested for measurement consistency and agreement before starting the study. The IOP was always measured by the same investigators who were masked to the treatment regime, with the same calibrated Goldmann tonometry and TonoPen. TonoPen calibration was confirmed each day prior to the initial subject recording, and only measurements with a 95% or higher confidence were recorded.
Systolic and diastolic BP (SBP and DBP, respectively) were measured with a brachial Riva-Rocci sphygmomanometer on the upper left arm in the sitting position every 2 h after the subject had been seated for at least 3 min except for the period between 12 AM and 6 AM during which measurements were taken every 3 h in the supine position. Mean arterial pressure (MAP) and ocular perfusion pressure (OPP) were calculated as follows: (1) MAP=DBP+1/3×(SBP−DBP), (2) sitting OPP=95/140×MAP−IOP, and (3) supine OPP=115/130×MAP−IOP. Subjects were instructed to continue normal indoor activities during day time hours of 6 AM–10 PM. During the nocturnal hours of 12 AM–6 AM, lights in individual rooms were turned off at 10 PM, and patients were required to remain supine in bed.
The sample size was calculated to have sufficient power to detect up to 80% of a 1 mmHg difference in the mean IOP between the 2 dependent groups, assuming a SD of 2 mmHg and a α-value of 0.05. In patients with bilateral NTG, the eligible eye was the one with lower mean deviation of the Humphrey visual field. If both eyes exhibited similar damage, 1 eye was randomly chosen at the time of enrollment. The 24-h IOP curves at baseline and between treatments were compared by repeated-measures analysis of variance (ANOVA) and a paired t test was used to compare each time point within the ANOVA. Bonferroni's correction was used to adjust the P values for multiple comparisons. IOPs within the first 12 h after administration (10 PM, 12 AM, 3 AM, 6 AM, and 8 AM) were identified as one data group, and those in the second 12 h (10 AM, 12 PM, 2 PM, 4 PM, 6 PM, and 8 PM) were considered a second data group. The distribution of adverse effects between the 2 medications was compared with the use of McNemar's test. All analyses were conducted with SPSS version 21.0 (SPSS, Inc., Chicago, IL). Continuous variables are presented as the mean and SD. Categorical variables are reported as a number (n) and percentage (%) of total eyes.
Results
A total of 50 patients with NTG were recruited. Seven patients withdrew from the study due to personal reasons and 2 patients dropped out due to noncompliance with glaucoma medications. Forty-one patients completed the full 4-month study period. Seven of the 41 patients were taking antihypertensive medication. The baseline characteristics of the patients who completed both treatment periods are summarized in Table 1.
SD, standard deviation.
The untreated mean (±SD) baseline IOP over the 24-h period (mean value of IOP at all time points of measurements) was 16.8±2.0 mmHg. The mean 24-h IOP after the administration of tafluprost was 14.4±2.2 mmHg, and that after administration of travoprost was 13.6±1.8 mmHg. Compared with untreated baseline IOP readings, the mean 24-h, and maximum and minimum IOP were significantly reduced with both prostaglandin monotherapies (all P<0.05, Fig. 1 and Table 2). When the 2 prostaglandins were compared, travoprost had a greater ocular hypotensive efficacy than tafluprost for the mean 24-h IOP (P=0.044) (Table 2). The assessed difference between treatments was 0.7 mmHg, with a 95% confidence interval of 0.2–1.3 in favor of travoprost. Both treatments significantly reduced IOP from baseline at every assessed time point over 24 h (P<0.05, Table 2). At individual time points, there were significant differences between tafluprost and travoprost at 4 PM, 6 PM, and 8 PM with travoprost having greater ocular hypotensive effects (P=0.041, P=0.006 and P=0.029, respectively) (Table 2). The assessed mean differences (95% confidence interval) between treatments were 1.0 mmHg (0.3, 1.8) at 4 PM, 0.9 mmHg (0.4, 1.4) at 6 PM, and 1.3 (−0.4, 2.1) at 8 PM in favor of travoprost. When the IOPs were partitioned into 2 groups of first and second 12-h period IOP, both tafluprost and travoprost showed similar efficacy for the first 12-h period IOP (10 PM–8 AM) (P=0.482). However, travoprost showed a greater efficacy than tafluprost in the second 12-h period (10 AM–8 PM) (P=0.037) (Table 2). The assessed mean difference between treatments was 0.8 mmHg, with a 95% confidence interval of 0.2–1.4 in favor of travoprost.
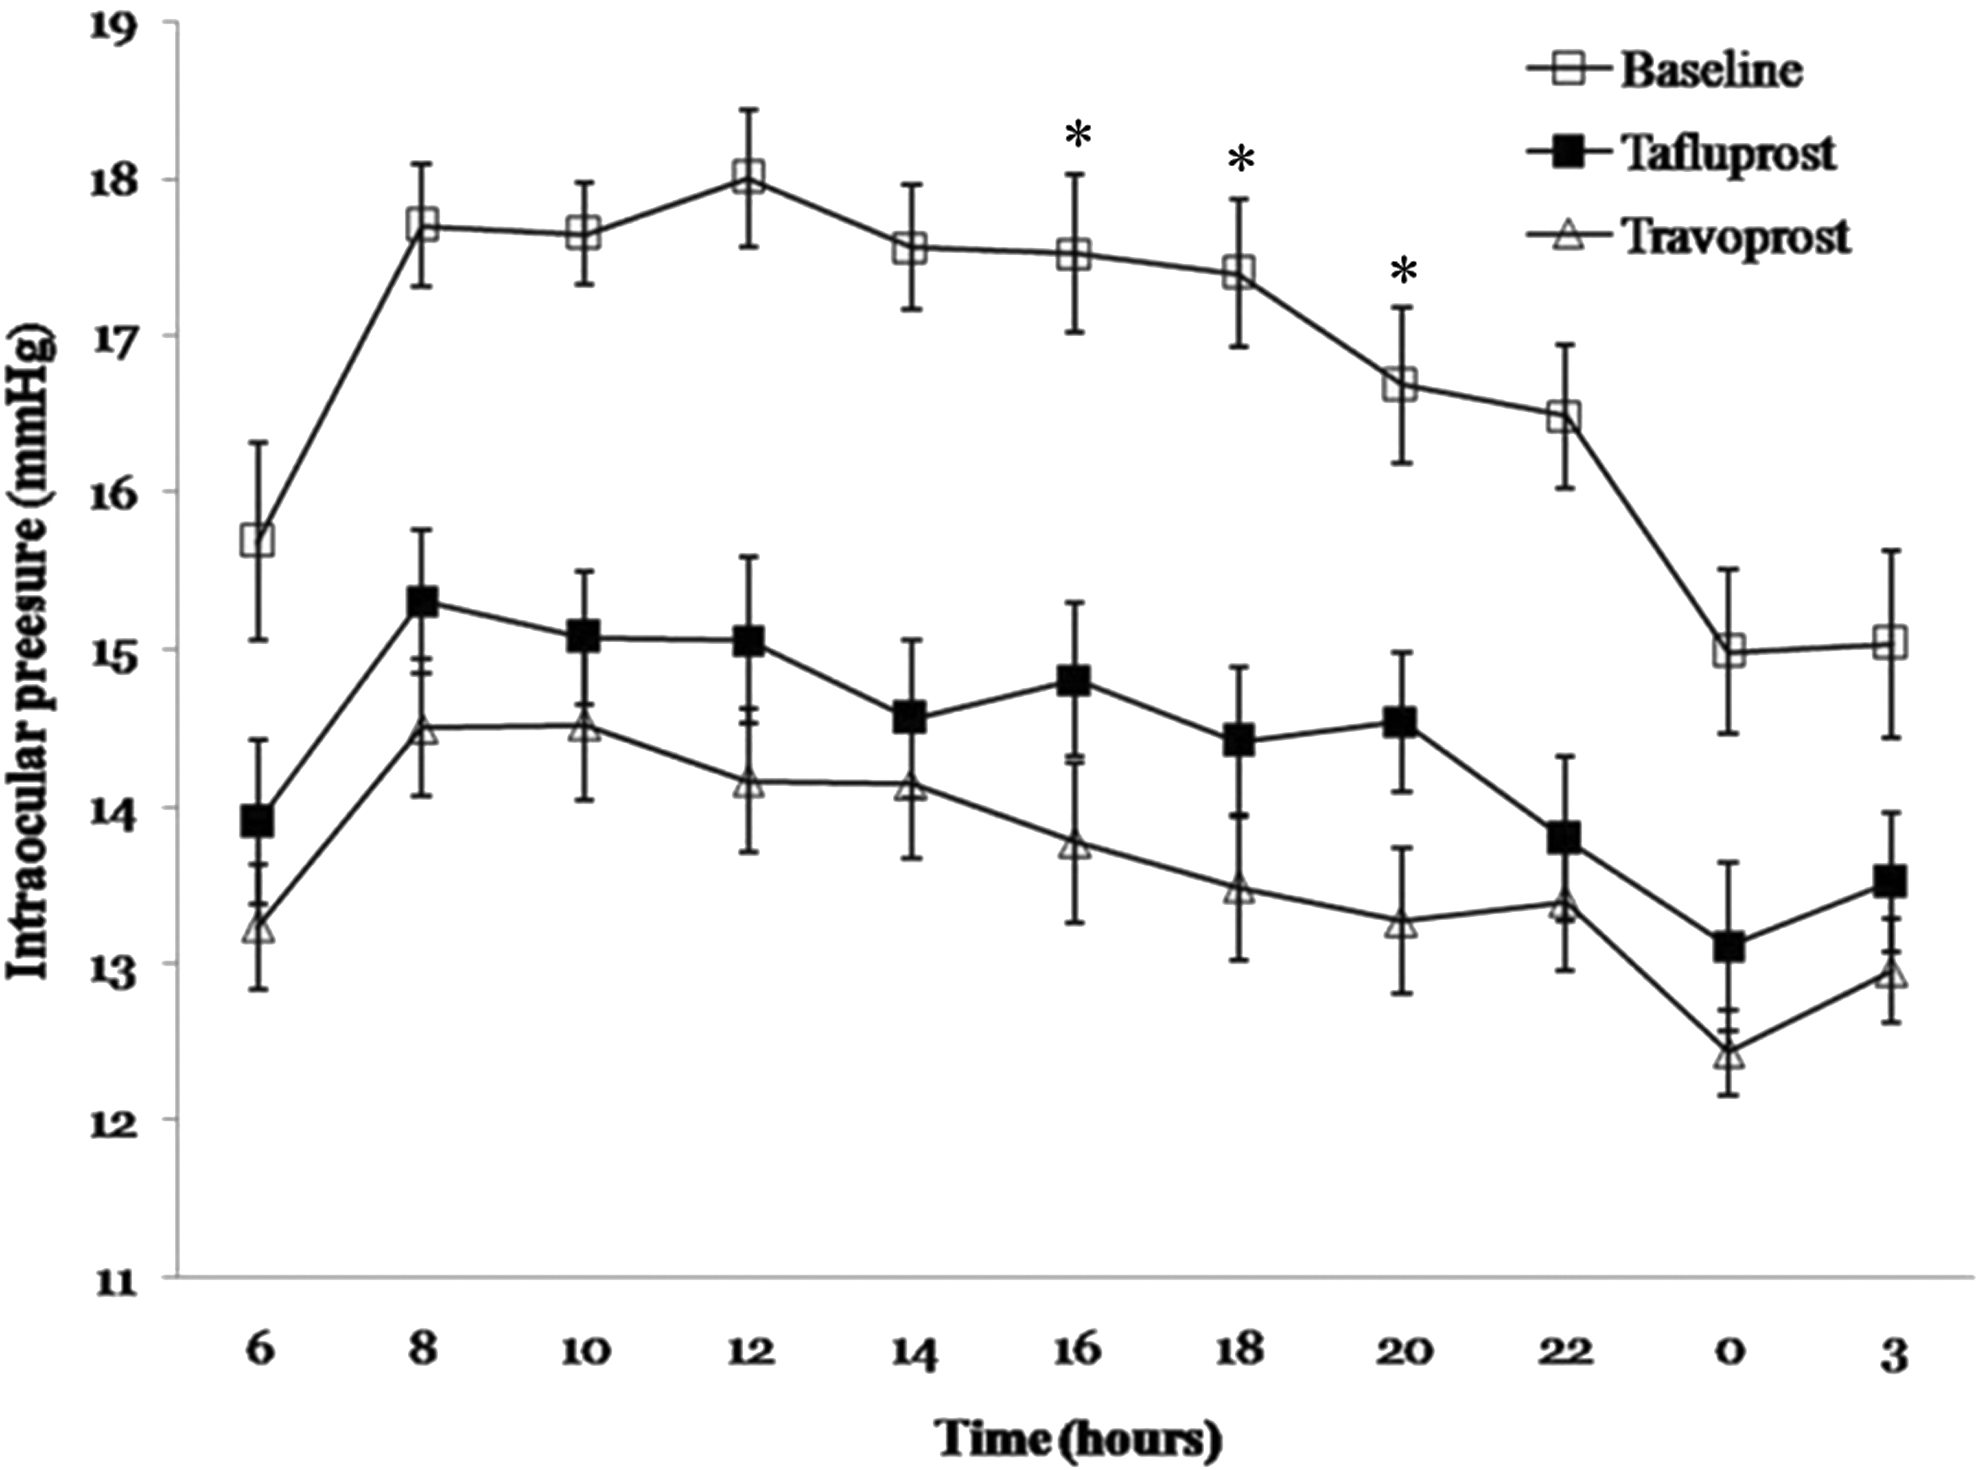
Twenty-four-hour intraocular pressure (IOP) (mean±standard error) at baseline (open squares) and after treatment with tafluprost (closed squares) and travoprost (open triangles). Compared with untreated baseline IOP readings, mean 24-h IOP was significantly reduced with both prostaglandin monotherapies (P<0.001, P<0.001, respectively). When the 2 prostaglandins were compared, travoprost had a greater ocular hypotensive efficacy than tafluprost for mean 24-h IOP (P=0.044). At individual time points, there were significant differences between groups at 16, 18, and 20 h with travoprost having greater ocular hypotensive effects (*P=0.041, P=0.006, and P=0.029, respectively).
Both treatments significantly reduced the IOP from baseline at each individual time point and for the 24-h curve. Maximum and minimum IOP were also significantly reduced with both prostaglandin monotherapies. When the 2 prostaglandins were compared, travoprost had a greater ocular hypotensive efficacy than tafluprost for the mean 24-h IOP (P=0.044). At individual time points, there were significant differences between groups at 16, 18 and 20 h with travoprost having greater ocular hypotensive effects (P=0.041, P=0.006, and P=0.029, respectively).
Bonferroni corrected P-value between baseline and tafluprost.
Bonferroni corrected P-value between baseline and travoprost.
Bonferroni corrected P-value between tafluprost and travoprost.
Values are means±SD.
IOP, intraocular pressure.
The differences in 24-h SBP and DBP between the baseline and after treatment with tafluprost or travoprost were not significant. There was no statistically significant difference between the 2 treatments on 24-h SBP and DBP curves (P=1.000, P=0.574, respectively). Compared with untreated baseline MOPP, 24-h MOPP was significantly increased with tafluprost or travoprost (P=0.008, P=0.002, respectively) (Fig. 2). Travoprost demonstrated a greater 24-h MOPP than tafluprost (P=0.027) (Table 3). The levels of MOPP at 8 AM, 12 PM, 2 PM, 4 PM, and 8 PM after administration with travoprost alone were significantly greater than baseline MOPP (Table 4).
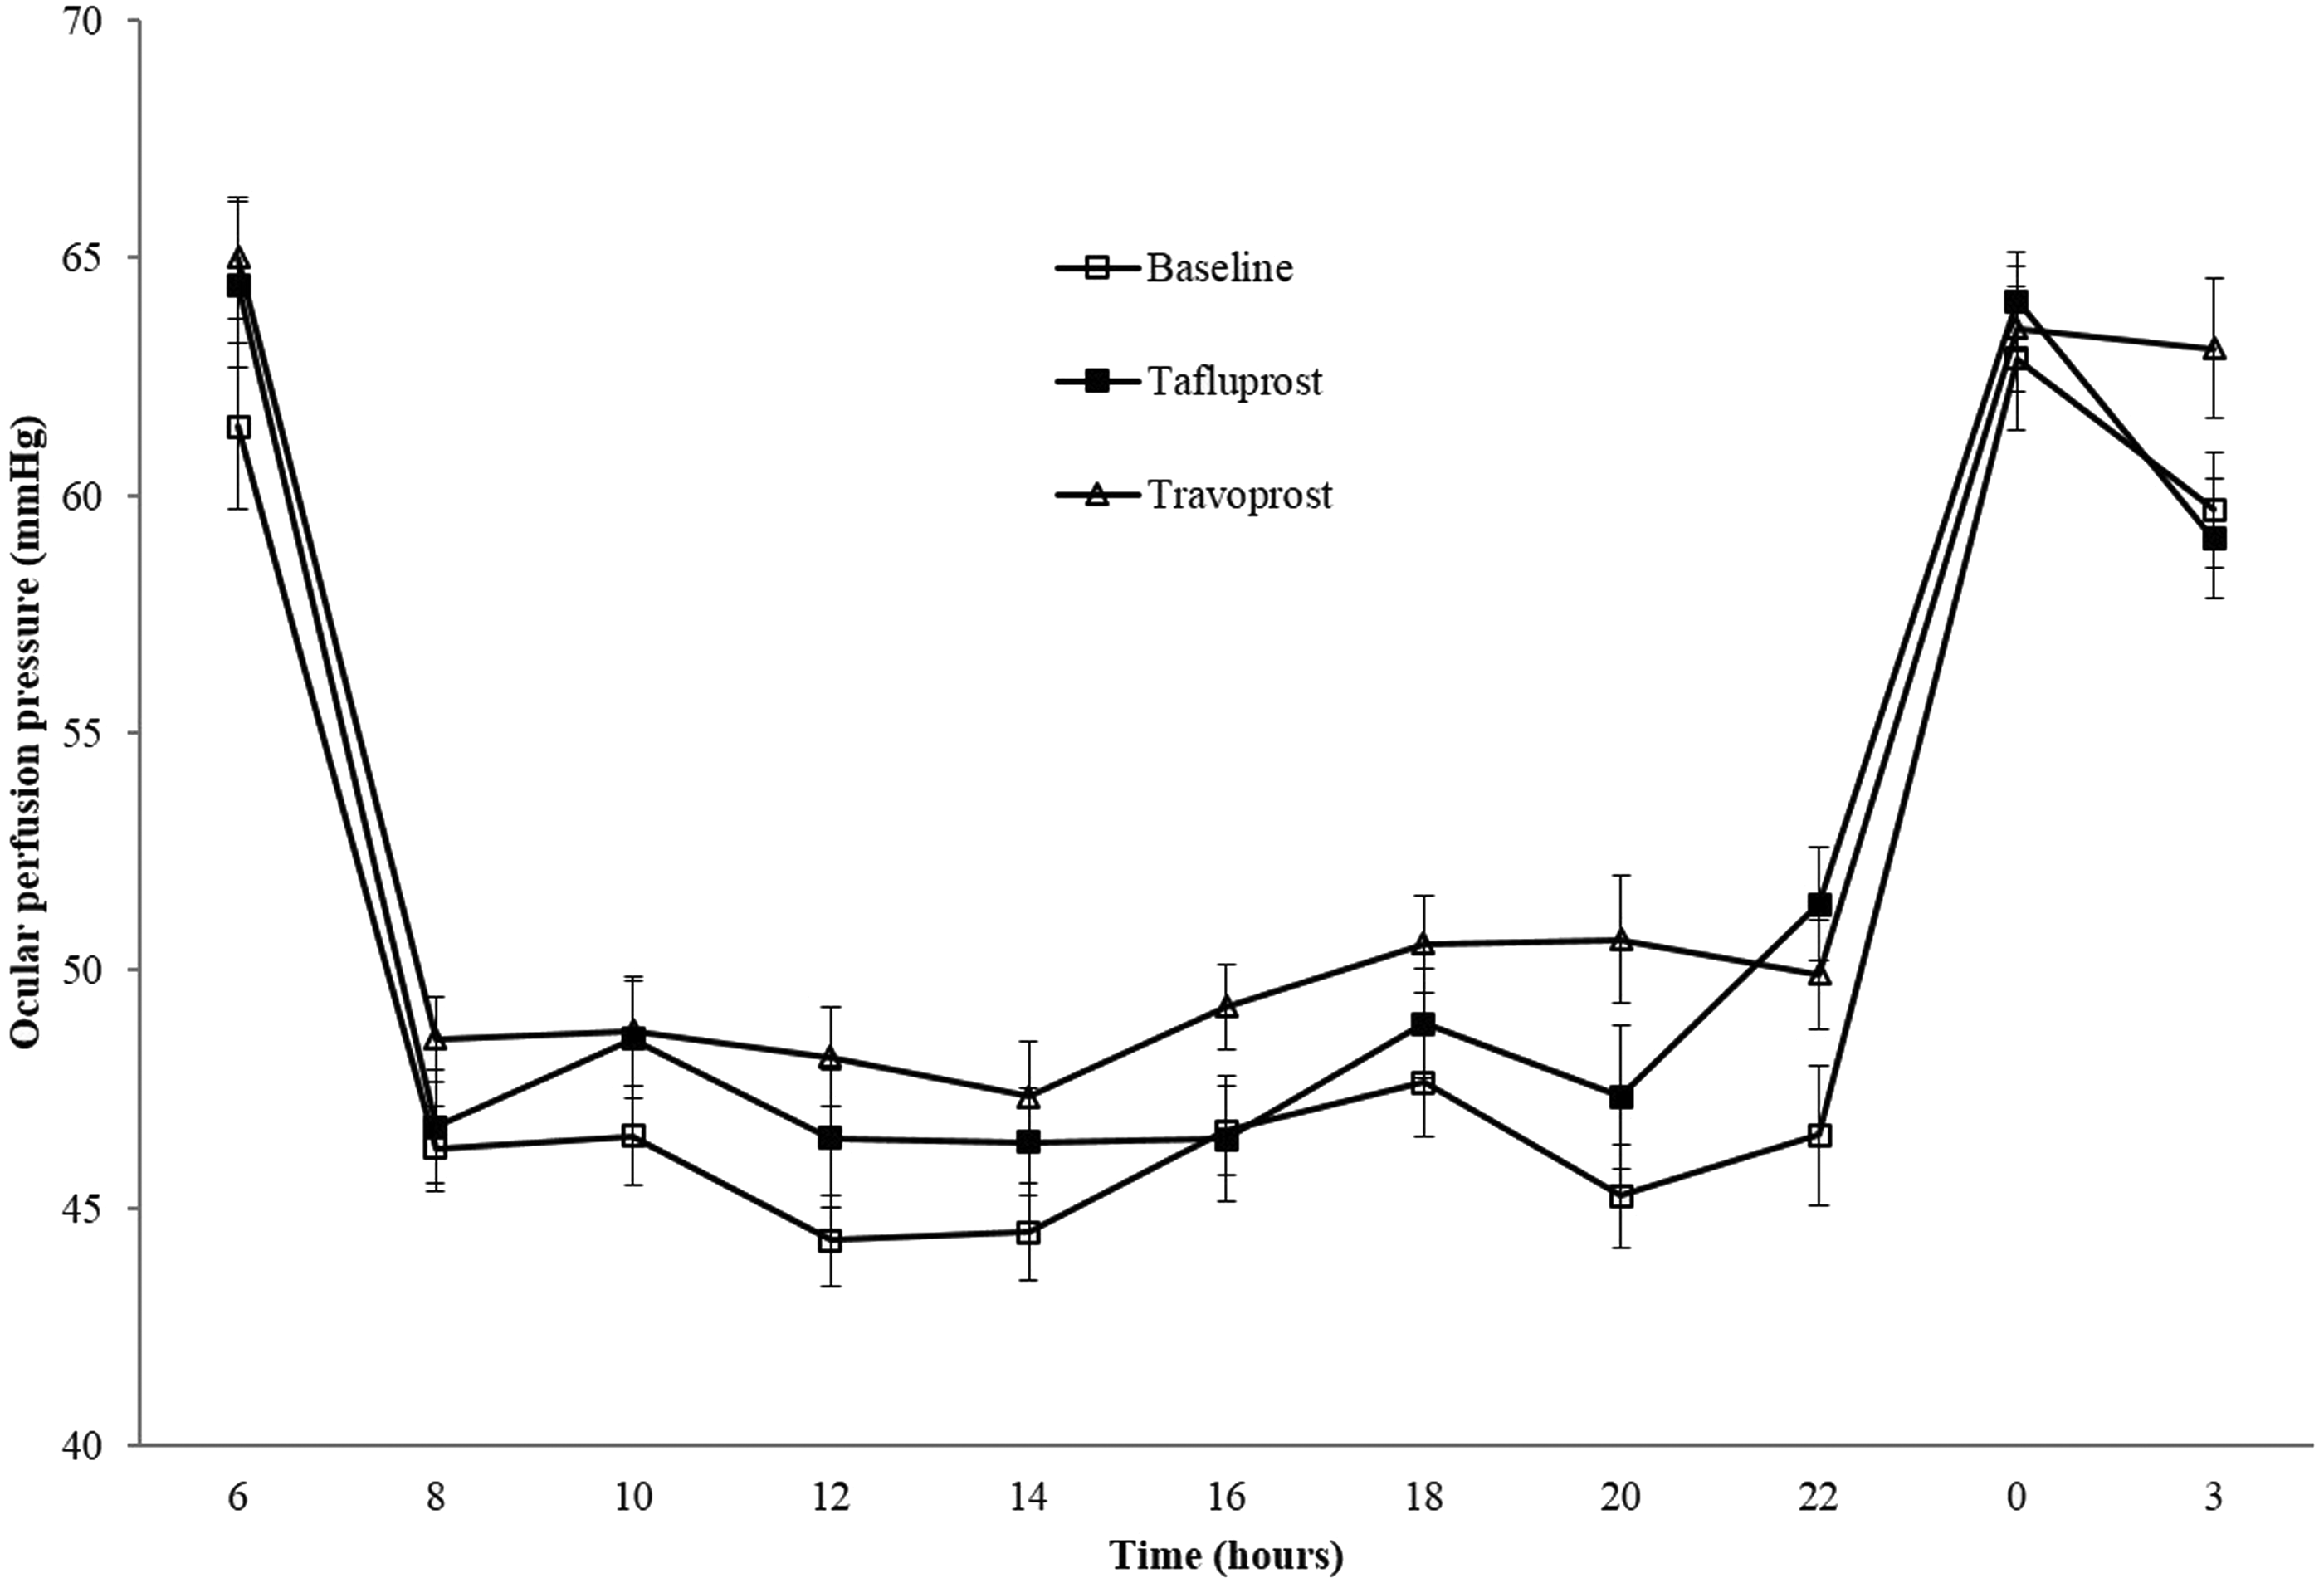
Twenty-four-hour mean ocular perfusion pressure (MOPP) (mean±standard error) at baseline (open squares) and after treatment with tafluprost (closed squares) and travoprost (open triangles). Compared with untreated baseline MOPP, mean 24-h MOPP was significantly increased with tafluprost or travoprost (P=0.008, P=0.002, respectively). Travoprost demonstrated a greater 24-h MOPP than tafluprost (P=0.027).
The differences in 24-h SBP and DBP between the baseline and after treatment with tafluprost or travoprost were not significant. There was no statistically significant difference between the 2 treatments on 24-h SBP and DBP curves. Compared with untreated baseline MOPP, mean 24-h MOPP was significantly increased with tafluprost or travoprost (P=0.008, P=0.002, respectively). Travoprost demonstrated a greater 24-h MOPP than tafluprost (P=0.027).
Bonferroni corrected P-value between baseline and tafluprost.
Bonferroni corrected P-value between baseline and travoprost.
Bonferroni corrected P-value between tafluprost and travoprost.
DBP, diastolic blood pressure; MOPP, mean ocular perfusion pressure; OPP, ocular perfusion pressure; SBP, systolic blood pressure.
Travoprost alone significantly improved MOPP at 8 h, 12 h, 14 h, 16 h, and 20 h compared with baseline.
Bonferroni corrected P-value between baseline and tafluprost.
Bonferroni corrected P-value between baseline and travoprost.
Bonferroni corrected P-value between tafluprost and travoprost.
Table 5 summarizes the adverse events experienced by subjects using both medications. Conjunctival hyperemia was the most common adverse event in both medications. The incidence of adverse events was not significantly different between tafluprost and travoprost.
Conjunctiva hyperemia was the most common adverse event in both medications. The incidence of adverse events was not significantly different between tafluprost and travoprost.
Discussion
This study demonstrated that both tafluprost and travoprost significantly reduced IOP at each individual time point, mean 24-h, maximum and minimum IOP compared with untreated baseline IOP readings in patients with NTG. Compared with untreated baseline MOPP, 24-h MOPP was significantly increased with tafluprost or travoprost. When the 2 medications were compared, mean 24-h IOP was significantly lower with travoprost than with tafluprost and 24-h MOPP was significantly greater with travoprost than with tafluprost. Travoprost was found to have a greater IOP lowering efficacy in the second 12 h of the measurement period. At individual time points, the IOP lowering efficacy of travoprost was significantly superior to that of tafluprost at 4 PM, 6 PM, and 8 PM. The assessed differences (95% confidence interval) between treatments were 1.0 mmHg (0.3, 1.8) at 4 PM, 0.9 mmHg (0.4, 1.4) at 6 PM, and 1.3 (0.4, 2.1) at 8 PM in favor of travoprost.
The results of this study are in agreement with that of a previous clinical study, which reported that travoprost produced greater IOP reduction than tafluprost at 10, 12, 16, 18, and 20 h after administration in patients with POAG or ocular hypertension. 26 These results are consistent with those of earlier studies comparing travoprost and latanoprost.13,19 Netland et al. demonstrated that travoprost had a greater efficacy in reducing IOP at 16 h compared with latanoprost. 13 Konstas et al. also reported that travoprost had a greater ocular hypotensive efficacy than latanoprost at 21 h. 19 This may be explained by the results of an experimental study, which reported that travoprost has greater affinity for the FP receptor than latanoprost in bovine corpus luteum. 27 In addition, another experimental study showed that the IOP-lowering efficacy of travoprost was greater than that of tafluprost at 6 h after administration in a mouse model. 28 A previous study demonstrated that tafluprost and travoprost were equally effective in IOP-lowering efficacy in patients with NTG. 21 However, 24-h IOP measurement was not considered in that previous study. 21 IOP measurements over a 24-h period provide a more robust estimation of IOP reduction and a more complete understanding of the efficacy of treatment compared with IOP measurements performed at a single time point. 29
The Early Manifest Glaucoma Trial (EMGT) suggested each 1 mmHg higher of IOP on follow-up was associated with an approximate 10% increased risk of glaucoma progression in the study group. 30 The CNTG study also found that when IOP is lowered by 30%, patients with NTG subsequently show a slower rate of visual field progression than in untreated eyes. 2 The difference in IOP between treatments found in this study may have clinical relevance when a patient who is treated with tafluprost showed a greater IOP in the late afternoon and evening above the target IOP. Travoprost may lower the risk of glaucoma progression to a greater extent than tafluprost based on the results of the EMGT and CNTG study group.2,30
The reason for the difference in IOP-lowering efficacy in the late afternoon and evening between tafluprost and travoprost is not exactly known. A partial explanation may be derived from the difference in the chemical structures of travoprost and tafluprost. Travoprost is an ester that acts as a prodrug of a fluoro analogue of PGF2α with fluoromethylphenoxy group at carbon-17. 31 Tafluprost is a PGF2α derivative in which the 15-position hydroxyl group is substituted by 2 fluorine atoms. 32 Introducing fluorine atoms into a molecule offers an alternative for improving metabolic stability and bioavailability and increasing binding affinity. 33 In addition, hydrolytic stability can be greatly enhanced by fluorination, as the highly electronegative fluorine acts by withdrawing electron density from the enol ether, consequently decreasing its rate of hydrolysis. 34 Structural characteristic of travoprost involves 3 fluorine atoms and that of tafluprost involves 2 fluorine atoms. We speculate that the molecular structure of travoprost may have pharmacologically greater metabolic stability and affinity for FP receptor than that of tafluprost.
Recently, lower MOPP has been found to be an important risk factor for POAG.5–7 In addition, the Low-Pressure Glaucoma Treatment Study revealed that lower MOPP during follow-up was significantly associated with visual field worsening in NTG. 4 In this study, we found that both tafluprost and travoprost significantly improved 24-h MOPP compared with untreated baseline MOPP levels. Given the IOP lowering benefit on ocular perfusion pressure, it is not surprising that both prostagladin monotherapies improved MOPP. The results of this study are in agreement with those of previous studies, which reported that latanoprost induced a significant IOP decrease and increased ocular perfusion pressure in patients with NTG.7,10 This study found no unexpected adverse events associated with tafluprost or travoprost treatment: conjunctival hyperemia was the most frequently reported adverse effect. These results are consistent with data, which indicate that conjunctival hyperemia is the most common local adverse event of the prostaglandin analogs, with an incidence of 15.8%–29.6% with tafluprost and 37.5%–49.5% with travoprost.13–15,18,19 No significant difference existed between the 2 drugs for any side effect.
There are several limitations to this study. One limitation is the relatively short treatment periods of 8 weeks. However, a previous study reported that IOP reduction is transient even after treatment for up to 12 months and IOP will return to pretreatment levels within a few weeks after discontinuation of latanoprost in patients with open-angle glaucoma and ocular hypertension. 23 Therefore, assessment of IOP and MOPP was only determined 8 weeks after treatment in this study. This was to enable the effect of the first medication to be completely washed out and replaced. However, we cannot exclude the possibility of a potential for some minor carry-over effects from the first to second treatment period. Another limitation is that central corneal thickness was not measured after treatments in this study. Sawada et al. demonstrated that the use of prostaglandin analogs can decrease CCT and this change should be considered when the IOPs obtained by GAT are analyzed. 15 The patients in this study population were all Asian. Therefore, the effects of tafluprost or travoprost on IOP and MOPP may be different in patients with NTG in other populations.
In conclusion, this study demonstrated that both tafluprost and travoprost effectively reduce 24-h IOP and increase 24-h MOPP pressure in patients with NTG. Travoprost was found to have a longer duration of action for IOP reduction than tafluprost. Further investigation would be required to substantiate whether these effects remain in effect with more chronic treatment.
Footnotes
Author Disclosure Statement
No competing financial interests exist.