
Abstract
Abstract
Purpose:
Glaucoma medications reduce the risk of progressive visual field loss, but adherence to these medications is often poor. A better understanding of the appropriate metrics for quantifying glaucoma medication adherence is needed. We describe and compare different means of quantifying glaucoma medication adherence.
Methods:
Adults with glaucoma were enrolled in a prospective 2-site study. Participants completed a self-report instrument and received electronic medication monitors to use for ∼3 months. Pharmacy records were queried regarding requested refills over the monitoring period; medication possession ratio (MPR) was calculated.
Results:
Of the 137 total participants, those who answered “Very confident” to the question, “How confident are you that you always remember to use your glaucoma medications?” and “No” to the question, “In the past 4 weeks, did you ever forget to take your medicine?” were more likely [odds ratio (OR) 2.78, 95% confidence interval (CI) 1.19–6.52] to take ≥80% of the prescribed doses according to electronic medication monitors. Mean MPR was 1.49, standard deviation (SD) 0.82, range 0.1–5.31. The proportion of participants taking greater than or equal to 80% of the prescribed doses according to the electronic monitors was 59% for participants with MPR <1.2 (n = 27), 63% for participants with MPR 1.2–1.8 (n = 27), and 88% for MPR >1.8 (n = 25).
Conclusions:
Asking about confidence may be a good method of screening for poor adherence for glaucoma medication. MPR may be an inadequate representation of glaucoma medication adherence.
Introduction
G
Whether measured by pharmacy data, 6 self-reporting, 7 or medication monitoring,8–11 adherence to IOP-lowering medication (referred to hereafter as glaucoma medication) is often poor 12 with adherence rates ranging from 10% to 97%, depending on the specific definition and method of measurement. Unfortunately, poor adherence is associated with worse visual field defects 13 and progressive visual field loss. In a retrospective study of 35 adults with glaucoma, 25 patients with stable visual fields over 36 months had a median adherence rate (defined as proportion of prescribed doses taken according to an electronic monitor) of 85%; patients whose visual fields worsened (n = 10) had a median adherence of 21% (P < 0.001). 14 Failure to recognize poor medication adherence can lead to the inaccurate conclusion that the currently prescribed therapy is inherently ineffective and prompt the decision to add medication or recommend surgery. 15
Glaucoma medication adherence is complex, both in terms of patient self-management and assessment. Proper adherence to a prescribed glaucoma medication regimen involves obtaining the medication, successfully instilling the drop into the eye, using the medication at the appropriate time, and doing so consistently each day. 16
Medication adherence in glaucoma can be queried by self-report, direct observation, electronic medication monitors, and pharmacy data. However, without a biologic metabolite to measure, no “gold standard” for describing glaucoma medication adherence exists. Self-reported adherence is likely the most commonly used measure of adherence in clinical care. Patient self-report, however, has been shown to overestimate adherence when compared to results of electronic monitors.9,17,18 Likewise, agreement between physician-suspected nonadherence and demonstrated nonadherence on electronic monitoring is poor. 18 Electronic medication monitors provide a wealth of information about dosing, but are cost prohibitive as a screening measure for nonadherence on a large scale. We, 19 and others, 20 have developed detailed assessment tools, which correlate well with glaucoma medication nonadherence. Such tools, however, require time and data that may not be readily available when screening for nonadherence in a clinical setting. Pharmacy refill measures, such as medication possession ratio (MPR; the ratio of medication required to medication available according to refill data), are inexpensive to collect and more objective than self-report, but may underestimate medication usage if medications are acquired from unmeasured pharmacies or through samples distributed in the clinic.
The purpose of this study was to measure and compare glaucoma medication adherence over ∼3-month time period by 3 metrics, including self-report, electronic monitors, and MPR as determined from pharmacy refills. Specifically, we hypothesized that (1) self-reported items, including questions capturing both self-reported adherence and self-efficacy with glaucoma medication adherence, and the results of a visual analog scale (scored by the participant) would be associated with electronically monitored adherence and (2) less-frequent refills would correspond to lesser proportion of prescribed doses taken according to the electronic monitor. The results of the study may guide selection of the most appropriate metrics to use to screen for nonadherence and to measure adherence in clinical trials.
Methods
In this IRB-approved study, eligible participants were adults, with medically treated glaucoma, receiving care at a VA or a University eye clinic. The sample size was chosen for convenience. Potential participants were identified by review of the medical record, excluding patients who underwent intraocular surgery within the past 3 months or were expected to undergo intraocular surgery in the next 3 months, active uveitis, or ocular infection as drop regimens may change from day to day in these situations. Potential participants were excluded for best-corrected visual acuity <20/70 in the better-seeing eye. This was because low vision may limit completion of some study tasks. Potential participants were also excluded if they indicated that someone else was responsible for drop administration. At the VA site, all patients meeting inclusion criteria and with upcoming appointments in the eye clinic were mailed a letter explaining the study and given a number to call to opt out. Patients who did not opt out were called several days before their scheduled visit to receive more information about the study. Patients interested in participating were asked to arrive before their appointment for study activities. At the University site, following the chart review for eligibility, potential participants were informed of the study by clinical staff at check-in. Every attempt was made to enroll consecutive patients. At the baseline study visit, participants who provided informed consent were (1) provided a survey of self-reported medication adherence and (2) given electronic medication monitors on a container bottle to hold one of their glaucoma eye drop bottles [Medication Event Monitoring System (MEMS); MWV Switzerland Ltd.] and record time and date of dosing. Participants were informed that the monitor would record bottle openings and that these data would be recorded by the study team. Participants used the electronic monitor from the time of the baseline visit until the next scheduled clinic appointment, ∼3 months later. For participants from the VA site, pharmacy records were queried for refill requests for glaucoma medications for a 6-month period, encompassing the duration of time that the participant used the electronic monitor.
Demographic characteristics
Age, gender, and self-reported race were collected from the medical record. Health literacy was assessed with the Rapid Estimate of Adult Literacy in Medicine (REALM), a word recognition test that can be administered in 2–5 minutes. 21 In prior work, we have found lower REALM scores to be associated with worse glaucoma medication adherence. 22
Self-report items
To test the hypothesis that specific components of a validated 19 self-reported glaucoma medication adherence instrument were associated with electronically monitored adherence, the survey (Appendix) was provided to each participant at the baseline visit by research staff. Two questions and one self-report item were selected for analysis from the surveys based on our hypotheses. 19 One question queried self-efficacy and the latter queried self-reported adherence. The 2 questions included the following: “How confident are you that you in performing the following task: always remember to use your glaucoma medications?,” and “In the past 4 weeks, did you ever forget to take your medicine?” (possible answers: “yes” or “no”). The third item to be studied from the survey was the visual analog scale. For this item, participants were asked to mark on a 10-cm line how often they took their glaucoma medication exactly as prescribed, with the left end of the line representing 0% and the right end representing 100%.
Electronic monitors
Participants stored one of their glaucoma eye drop bottles in a container bottle with an affixed electronic monitor cap (MEMS) from the time of enrollment until their next appointment. If a participant was prescribed more than 1 bottle of glaucoma medication, the electronic monitor was used for the most frequently dosed medication. From the data downloaded from the monitors at the end of the study, the proportion of prescribed doses taken was derived. For example, if a participant was prescribed timolol to be taken twice daily over a 3-month period (2 times per day ×30 days/month ×3 months = 180 prescribed doses) and the electronic monitor indicated 120 openings, the proportion of prescribed doses taken would be recorded as 67% (120/180).
The data from the electronic monitors were also used to calculate the proportion of prescribed doses taken according to schedule. Taking the dose “according to schedule” was defined as taking the next scheduled dose within a window encompassing less than and greater than 25% of the nominal dosing interval. For example, if a medication was prescribed to be taken twice daily and was taken first at 9 am, the appropriate dosing window for the next dose would be 6 pm–12 am. The proportion of doses taken on schedule are presented to supplement the description of adherence provided by the calculated proportion of prescribed doses taken, but are not used in comparative analyses. The reason for this is that the participants in this study were treated by multiple providers who may have instructed their patients differently in terms of the appropriate dosing interval. For example, if a participant was told by the provider to take the medication twice daily without instruction regarding timing and the participant takes the medication upon awakening at 6 am and before bed at 11 pm consistently each day, he or she would be completely adherent with the provider's instructions, but would be 100% nonadherent according to the criterion for proportion of prescribed doses taken on schedule as described above.
Medication possession ratio
For study participants from the VA Medical Center, pharmacy records were reviewed to determine the number of refills for glaucoma medications received for a 6-month period encompassing the time period that the participants used the MEMS. To determine the number of doses available to a participant based on number of refills and quantity of medication requested, we considered the number of doses available in the glaucoma medication bottle. To determine the number of doses in individual bottles, we consulted with the specific manufacturer, the local VA pharmacy, and manually counted drops. For example, for the topical beta blocker most commonly prescribed at our facility, timolol 0.5%, the manufacturer, Falcon, estimated 31 drops/mL, the pharmacy estimated 20 drops/mL, and our count indicated 32 drops/mL. Due to these discrepancies, we present in this report calculations of MPR according to the number of drops/mL as judged by our count of drops in the bottles used by our facility's pharmacy (e.g., 32 drops/mL for the above example). In sensitivity analyses, we performed all comparisons for MPR as calculated by the pharmacy's estimate and the manufacturer's estimate. To determine the number of doses required, we accounted for the frequency of prescribed dosing and whether the drop was prescribed for one or both eyes. The MPR was defined as the number of prescribed doses divided by the number of doses available to the participant 7 over a 6-month period, encompassing the duration of time that the participant used the electronic monitor. For analysis purposes, the continuous variable of MPR was divided into 3 categories to attempt to capture those participants within the VA system who have an undersupply of medication, the appropriate amount of medication, and an oversupply of medication. Based on the distribution of this variable, it was determined that MPR of less than 1.2, 1.2–1.8, and greater than 1.8 were appropriate cutoffs.
Analysis
Descriptive statistics for demographic variables were produced by site (VA and University) and overall. These variables included gender, ethnicity, race, age, number of glaucoma medications used at baseline, and REALM score.
The first hypothesis examined the association between self-reported adherence and self-efficacy with electronically monitored adherence. A composite self-reported adherence and self-efficacy measure was defined as follows: for the 2 survey questions (“How confident are you that you can carry out the following task: always remembering to use your glaucoma medications,” and “Did you forget to take your medication in the last 4 weeks”), a dichotomous composite was constructed so that if the participant answered “very confident” to the first question and “no” to the second, then the participant was assigned a value of “1,” indicating high levels of self-reported adherence. The decision was made to dichotomize the responses because the few numbers in each of the individual cells others than “very confident” precluded meaningful comparative statistics. We hypothesized that participants who marked the self-reported visual analog scale closer to the end of the 10-cm line, corresponding to taking their medications as prescribed closest to 100% of the time would have better adherence on electronic monitoring. The results of the visual analog scale were dichotomized such that participants reporting taking their glaucoma medications as prescribed greater than or equal to 80% of the time (corresponding to a visual analog scale response of 8 cm on the 10 cm scale) were assigned a value of “1” indicating high levels of self-reported adherence and “0” otherwise. Finally, the proportion of prescribed doses taken according to the electronic monitor was dichotomized to <80% (assigned value of “0”) or ≥80% (assigned value of “1”). Eighty percent is an empiric, but commonly used cutpoint, in describing medication adherence.13,23 Logistic regression models were then constructed using the LOGISTIC procedure in SAS 9.2 to examine the association between (1) the self-reported adherence and (2) the dichotomized visual analog scale with MEMS percent adherence greater than or equal to 80%.
The second hypothesis assessed the relationship between the amount of medication a participant has and the percent of doses taken according to the electronic monitor. The association between the 3-level MPR categorical variable and MEMS percent adherence greater than or equal to 80% was examined by logistic regression in only the VA participants. Estimates and standard errors from these models were used to calculate the Wald odds ratios and 95% confidence intervals.
Results
The demographics of 137 participants enrolled in the study are presented in Table 1. Participants used the electronic monitors for a mean of 187 days (range 24–606 days), corresponding from the time of their baseline visit until their next scheduled clinical visit. Ten of the 137 participants did not return the electronic monitors, including 6 participants from the University, 4 from the VA Medical Center, 4 women and 6 men, and 6 white and 4 African American participants. Descriptive results of the various measures of medication adherence are presented in Table 2.
Visual analog scale: Participants marked on a 10-cm line “How often do you take your glaucoma medications exactly as prescribed?” with 0 = none of the time and 10 = all of the time. Results dichotomized for greater than or equal to 8 cm or less.
One participant did not complete the survey.
Ten participants did not return the electronic monitors.
VA participants only, as free samples of glaucoma medication were available at the University clinic and likely influenced pharmacy refill patterns.
SD, standard deviation.
In regard to the first hypothesis examining the association between the self-reported items and measured medication adherence, participants who answered “very confident” to the question, “How confident are you that you can carry out the following task: always remembering to use your glaucoma medications?” and “no” to the question, “In the past 4 weeks, did you ever forget to take your medicine?” were more likely [odds ratio (OR) 2.78, 95% confidence interval (CI) 1.19–6.52] to take at least 80% of the prescribed doses according to the MEMS. Subjects who marked 8 or more centimeters on the visual analog scale were more likely to take at least 80% of the prescribed doses according to the MEMS (OR 2.35, 95% CI 0.96–5.75).
The second hypothesis looked at the relationship between the amount of medication a participant has and percent adherence. The proportion of participants taking greater than or equal to 80% of the prescribed doses according to the electronic monitors was 59% for participants with MPR <1.2 (n = 27), 63% for participants with MPR 1.2–1.8 (n = 27), and 88% for MPR >1.8 (n = 25). Those participants in the highest MPR group were more likely to take greater than or equal to 80% of the prescribed doses compared to those in the lowest MPR group (OR 5.04, 95% CI 1.21–21.05) as well compared to those in the middle MPR group (OR 4.31, 95% CI 1.02–18.15), Fig. 1.
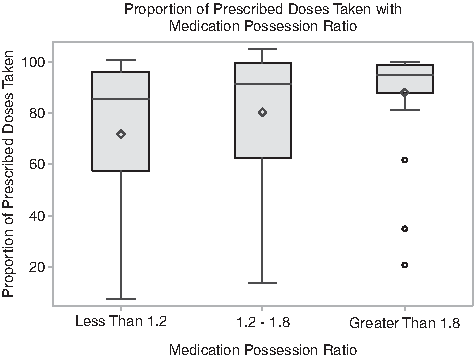
Proportion of prescribed doses taken with medication possession ratio. The proportion of prescribed doses taken according to the electronic monitor is found on the X axis. The Y axis represents medication possession ratio (MPR; the ratio of medication required to medication available according to pharmacy refill data) grouped into MPR <1.2, MPR 1.2–1.8, and MPR >1.8. The top and bottom of the box represent the first and third quartile, the band represents the media, and the diamond represents the mean. The range is denoted by the whiskers and the outliers by circles.
We repeated all analyses for MPR calculated according to the manufacturer's estimate of the number of drops in a bottle and according to the local pharmacy's estimate of number of drops in a bottle with similar results with no change in significant findings. We also repeated analyses replacing the proportion of prescribed doses taken with the proportion of doses taken on schedule (defined as ±25% of the nominal dosing interval); likewise, no changes in significant relationships were found (data not shown).
Discussion
We hypothesized that the responses to specific questions from a validated survey of self-reported adherence and self-efficacy with glaucoma therapy would be associated with worse adherence according to electronic monitors and worse ability to successfully self-administer eye drops. We found that answering “very confident” to the question “How confident are you that you can perform the following task: always remember to use your glaucoma medications” and “No” to the question “In the past 4 weeks, did you ever forget to take your medicine?” was associated with taking ≥80% of the prescribed doses according to the MEMS. Although a visual analog scale has been shown to be helpful in identifying nonadherence in some studies of chronic disease, including one conducted in patients with glaucoma,24,25 we did not find an association between responses to the visual analog scale and adherence according to the MEMS.
On an average, participants possessed ∼150% of the amount of the glaucoma medication required according to their prescribed regimen. Although other studies reporting MPR to describe glaucoma medication adherence report lower average values, 26 these studies were performed in non-VA settings. Studies in chronic diseases other than glaucoma suggest that MPR may overestimate adherence.27,28 Several factors may contribute to the higher-than-expected MPR observed in this study. Some medications have more excess per bottle than others. For example, we counted 77 drops per bottle for the most commonly prescribed glaucoma medication in the VA clinic, latanoprost. The bottle is intended to last 1 month for bilateral, daily use. As such, with perfect dosing, a patient would have an excess of more than 1 week of medication at the end of the month. Also, 6 months may be an inadequate duration to adequately capture refill patterns for Veterans receiving a 90-day supply of medication.
Given the high mean MPR, we considered that oversupply of medication may in fact be associated with lower proportion of prescribed doses taken, as has been demonstrated in other chronic diseases such as hypertension, 27 but we did not find this association for our participants. Although the proportion of participants taking ≥80% of the prescribed doses increased as MPR increased, the majority of participants in each tertile of MPR took at least 80% of the prescribed doses according to the MEMS.
Our study has several limitations. We did not include MPR for participants from the University clinic because free samples of some medications were available in the clinic and were likely to distort the results of a pharmacy refill query. As such, our findings related to MPR should not be extrapolated to a non-VA setting. Given the slight discrepancies in the drop count per bottle between our own measure, the pharmacy, and the manufacturer's estimate, we used our own count of drops per bottle to calculate MPR for analysis. However, the number of drops in a bottle may change over time from the date of bottle fill until expiration due to changes in the plasticity of the bottle and the viscosity of the fluid. Accordingly, the manufacturer's estimate may be more accurate than the drop count. Our results for the sensitivity analyses using the manufacturer's estimate and using the pharmacy's estimate, however, did not differ from the results we present. Although we made every attempt to approach consecutive eligible patients regarding participation, patients who elected to participate in the study may have better (or worse) adherence behavior than a random sample of glaucoma patients. In addition, all participants in the study knew that their glaucoma medication adherence behavior was being monitored and may have altered their behavior due to this knowledge. Our goal was to obtain electronic monitoring for at least 90 days and although our average period of monitoring was 127 days, some participants were monitored for less than 90 days. We did not exclude these participants who returned their monitors early because we considered that these participants might be less adherent to medication if they were less adherent to the study. Conversely, one might argue that participants monitored for short periods might maintain better-than-usual adherence as the duration of “good behavior” would not need to be as long.
In conclusion, asking glaucoma patients simple questions may be helpful in screening for nonadherence. Pharmacy refill measures may be useful in describing persistence, but did not correlate well with electronically monitored adherence in our VA study population over a 6-month time frame. Our results suggest that electronic monitoring provides better outcome measures of glaucoma medication adherence than MPR to use in clinical studies conducted over a shorter time frame.
Footnotes
Acknowledgments
This study was funded by a VA Health Services Research & Development Career Development Award (K.W.M.) and American Glaucoma Society Clinician Scientist Award (K.W.M.). Dr. H.B. Bosworth was supported by research career scientist award (RCS 08—027). This work was presented in abstract form in March, 2015 at the annual meeting of the American Glaucoma Society.
Author Disclosure Statement
No competing financial interests exist.