




Abstract
Abstract
Purpose:
Assessing the morphologic properties of cells in microscopy images is an important task to evaluate cell health, identity, and purity. Typically, subjective visual assessments are accomplished by an experienced researcher. This subjective human step makes transfer of the evaluation process from the laboratory to the cell manufacturing facility difficult and time consuming.
Methods:
Automated image analysis can provide rapid, objective measurements of cultured cells, greatly aiding manufacturing, regulatory, and research goals. Automated algorithms for classifying images based on appearance characteristics typically either extract features from the image and use those features for classification or use the images directly as input to the classification algorithm. In this study we have developed both feature and nonfeature extraction methods for automatically measuring “cobblestone” structure in human retinal pigment epithelial (RPE) cell cultures.
Results:
A new approach using image compression combined with a Kolmogorov complexity-based distance metric enables robust classification of microscopy images of RPE cell cultures. The automated measurements corroborate determinations made by experienced cell biologists. We have also developed an approach for using steerable wavelet filters for extracting features to characterize the individual cellular junctions.
Conclusions:
Two image analysis techniques enable robust and accurate characterization of the cobblestone morphology that is indicative of viable RPE cultures for therapeutic applications.
Introduction
T
An important reason for the current remarkable interest in stem cell replacement therapy is the ability of stem cells to self-renew and produce large numbers of human cell progeny. 5 These progeny can, in turn, be differentiated into RPE or other somatic cell types for transplantation. This strategy requires accurate and efficient identification of the type of progeny produced. RPE replacement therapy, in particular, requires careful characterization to assure that the identity and purity of the cells to be transplanted are indeed RPE. RPE identity and purity is reflected in the appearance of a cuboidal cobblestone monolayer morphology. An objective, quantitative method for measuring the extent of cobblestone morphology will serve regulatory requirements for RPE cellular identity and purity, a critical step when developing a stem cell replacement therapy.
Visual inspection of cobblestone morphology is currently used to initially identify the RPE phenotype and indicate appropriate stem cell differentiation. Although cobblestone morphology is routinely used to indicate that a pure population of healthy RPE cells has been obtained, this determination is subjective and highly dependent on observer experience. Confirmatory objective measures of RPE identity, such as protein expression, immunohistological staining, or electrophysiological properties, are time consuming and require destruction of the cellular sample being measured. To more efficiently determine RPE identity and purity, a simple rapid objective test is needed. With this aim, we developed an automated image analysis method for nondestructive, quantitative and objective measurement of cobblestone morphology in an RPE monolayer. We found that the cobblestone pattern recognized by an experienced observer can be efficiently measured using computational image analysis.
There are two main approaches for identifying structures such as the distinctive cobblestone morphology in biological microscopy images. First, a segmentation or feature extraction step can be applied to the images. The resulting features are then used to identify or classify objects of interest in the images. Methods that use cell segmentation as a basis for characterizing cobblestone morphology have been reported previously.6,7 Such approaches generally require fluorescently labeled cells, and may not be robust to variations in imaging conditions. The second approach is nonfeature based, and is applied to the entire image without requiring a feature extraction step. In many cases, it is difficult or impossible to reliably extract features for object detection and classification, and such nonfeature-based classification approaches are desirable. In this study, we describe advances applicable to both approaches.
We have developed a novel classification approach that is capable of accurately characterizing cobblestone morphology in biological images. This approach uses the Normalized Compression Distance (NCD).8,9 The NCD is based on the notion of Kolmogorov complexity from the field Algorithmic Information Theory, 10 precisely quantifying the most concise description of the differences among a set of digital objects. The NCD is a normalized metric, meaning that it takes values on the range of [0,1], with 0 indicating that the digital objects are identical and 1 indicating that the digital objects are maximally dissimilar. The NCD approximates the relative Kolmogorov complexity using standard file compression algorithms. This approach can be applied in an unsupervised manner, 11 automatically classifying images based on meaningful differences in appearance with no manually applied class labels. The approach can also be applied in a semi-supervised manner that uses both labeled and unlabeled images. 12 The ability to use the NCD in a semi-supervised formulation, incorporating unlabeled images into the training set to improve the accuracy of RPE cobblestone characterization is an important advantage. 13 In this study we describe a fully supervised approach using the NCD between pairs of images, and also using the shared information among all of the images in the training set. An image compression algorithm is used to measure visual similarity of cobblestone structures between an image being evaluated and a set of manually labeled training images. The classification approach is well suited to measure the distinctive cobblestone morphology that is characteristic of healthy RPE cell monolayers. The novel automated technique rapidly provides an objective, quantitative measure of cobblestone morphology useful to describe the identity and purity of stem cell-derived RPE cultures. Our work combines the NCD with a novel approach that uses image compression, rather than feature extraction, to capture similarities in visual structure for phase contrast and fluorescence microscopy images. This approach is most useful in capturing the overall characteristics of an image. We also describe the use of feature-based approaches for characterizing the morphology of individual cellular junctions that in combination result in the cobblestone pattern.
Existing approaches to quantifying cobblestone morphology using feature extraction compute characteristics from image pixels to identify cobblestone structure, including, for example, methods based on edge detection to extract information from gradient maps. 14 Here we have applied an alternative approach using a mathematical framework for Steerable Wavelet Filters (SWFs) developed using methods based on parametric steerable template matching. 15 SWFs provide an advantage over the other methods due to the fact that they make no prior assumptions about the type of junction or angular separation being characterized. These SWFs are parameterized shapes able to measure symmetry for arbitrarily sized and shaped structures.
The two approaches described here for measuring the characteristics of cobblestone structure formation provide accurate, rapid, and objective measures of RPE monolayer identity and purity. The compression-based approach is suitable for whole-image characterization, whereas the SWF provides a more precise characterization of the individual cobblestone junctions. Both approaches work with noninvasive phase-contrast microscopy, and are directly applicable to cells in the process of manufacture. Both techniques are also compatible with analysis of fluorescence microscopy images stained using immunohistochemistry. Fluorescence microscopy images are generally less variable and more amenable to automated image analysis. The methods described can be used nondestructively with phase contrast microscopy for evaluating final cell products intended for human therapeutic application. More precise destructive assays can also be implemented using fluorescence microscopy on samples taken from the manufacturing pipeline. Applying these image analysis algorithms can facilitate efforts to develop stem cell-based RPE replacement therapy for AMD patients.
Figure 1 shows an overview of the image preprocessing and analysis steps. Sample phase and fluorescence images are shown, along with results of the preprocessing steps to reduce imaging noise and variability before analysis. The 2 analysis approaches described, SWFs and NCD, can be applied to either imaging modality. The NCD and SWF analyses are different and complementary approaches. The NCD classifies an unknown image against a training set of images. The image compression algorithm used to identify similarity is optimized for visual characteristics, hence the NCD used in this manner can be considered to capture visual similarity. The SWF applies a symmetry detection filter (Fig. 1, SWF panel, middle) to the skeleton branch points of a preprocessed image (Fig. 1, SWF panel, left). The results of the SWF analysis are the symmetry responses for each branch point represented here by a box plot (Fig. 1, SWF panel, right). Taken together, these 2 techniques offer a novel and effective approach to characterizing the morphology of stem cell cultures at the level of the entire image (NCD) and the individual cobblestone junctions (SWF).
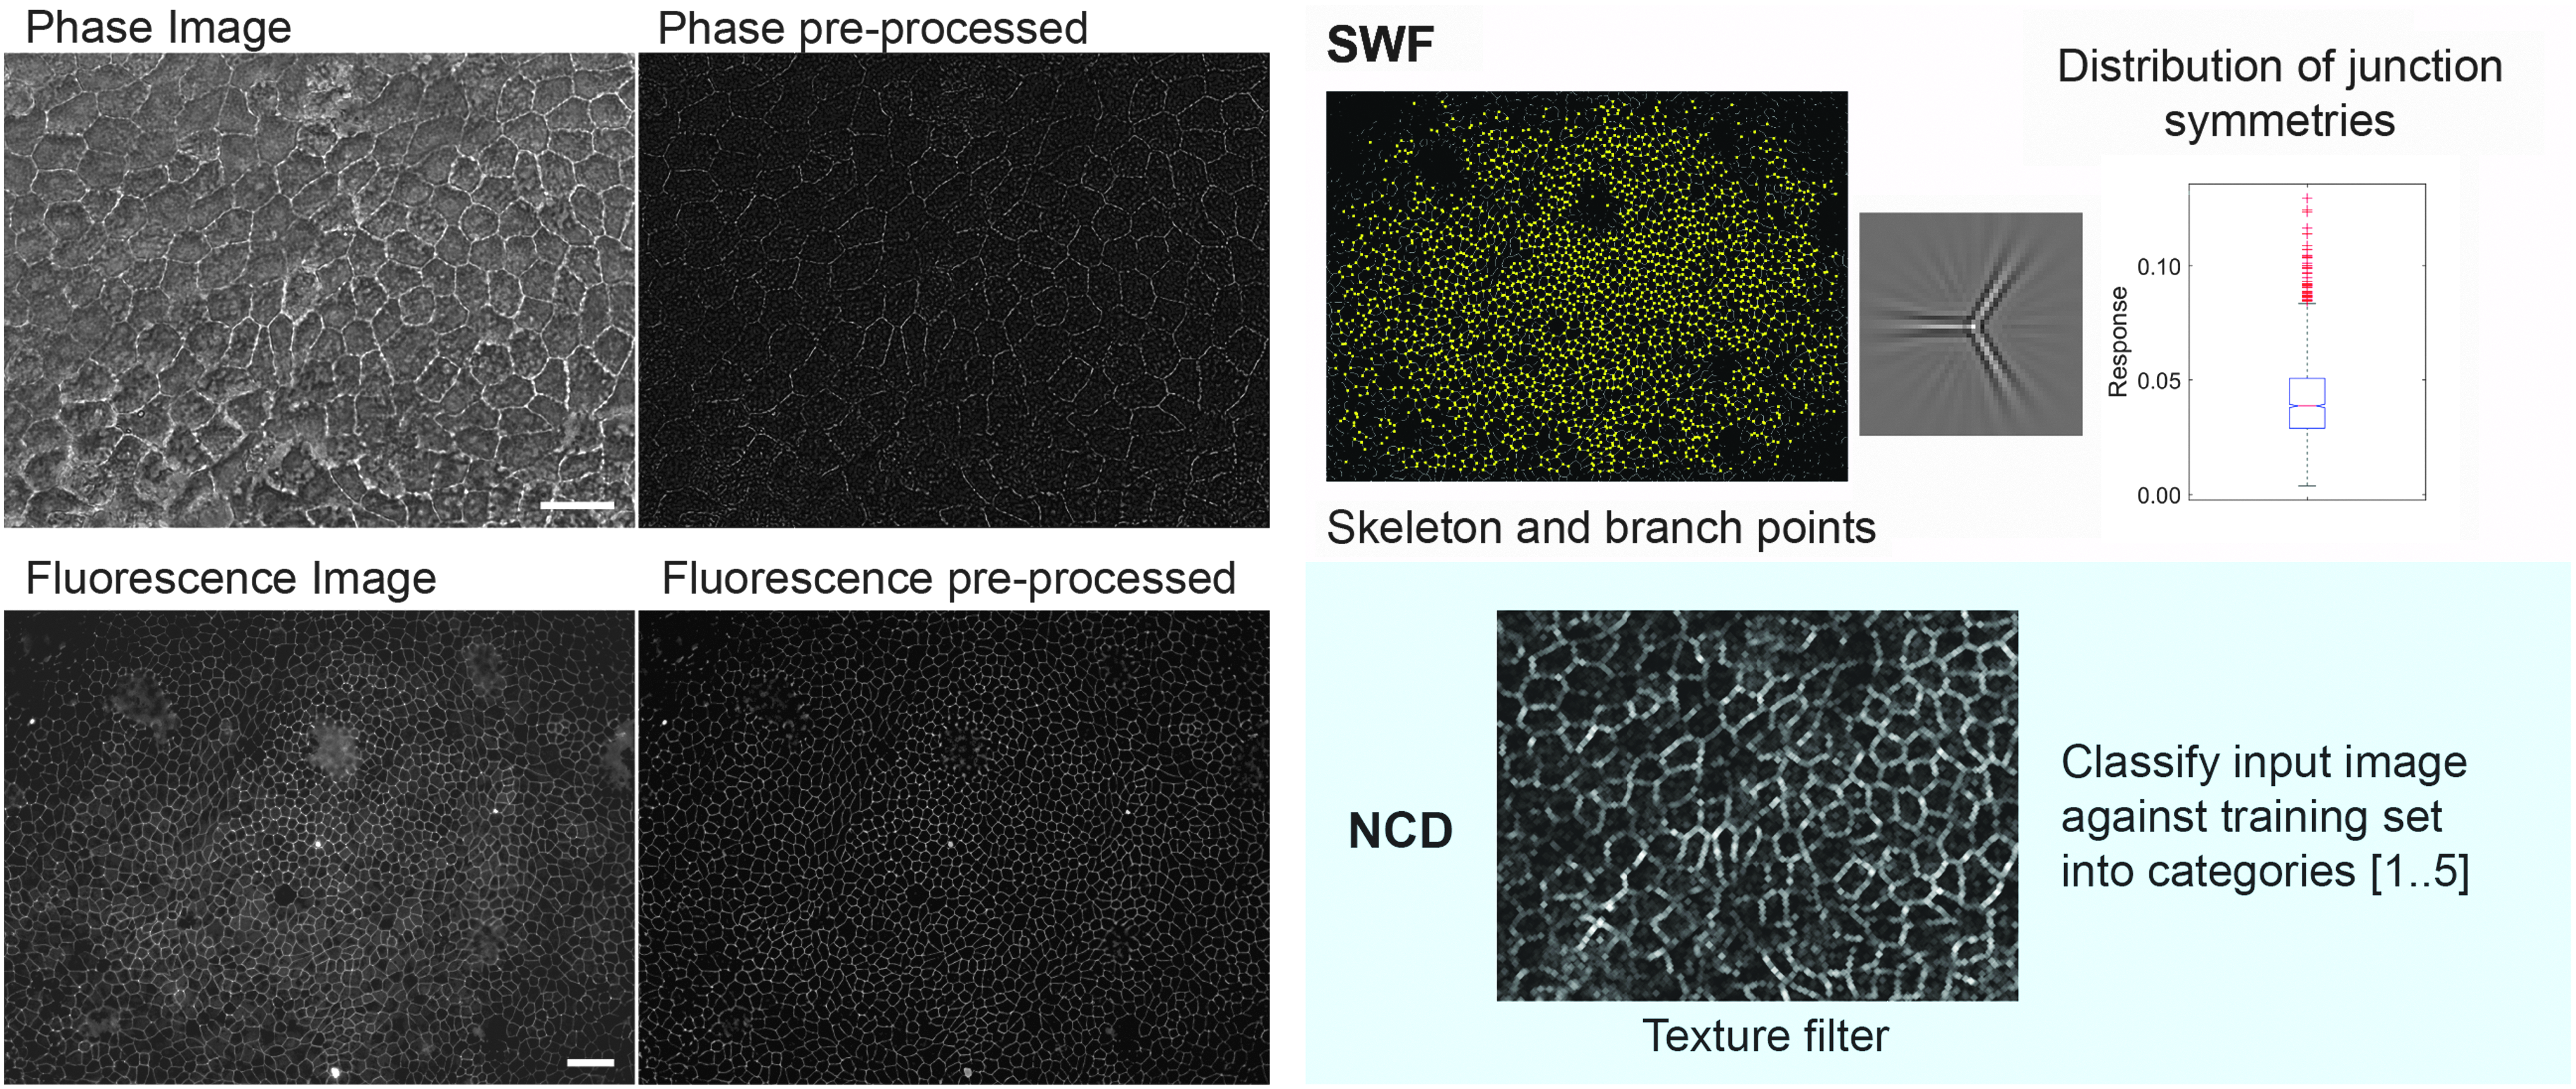
Illustrating the preprocessing and analysis steps. Phase and ZO-1 fluorescence microscopy images manually identified as category 5 (left). Analysis steps include SWFs and NCD. The SWF analysis first skeletonizes the image and finds the branch points (SWF panel, left). The filter (SWF panel, center) is evaluated at each branch point. The distribution of responses is shown as a box plot (SWF panel, right) with the red line indicating the median value, the blue box extending from the 25th through the 75th percentile, and data beyond the whiskers considered outliers. The NCD classifies each image against the training set. The NCD and SWF are complementary techniques that can be applied to either imaging modality. Scale bars indicate 50 μm. NCD, normalized compression distance; SWF, steerable wavelet filters.
Methods
Standard RPE monolayer images
The individual cell morphology within stem cell-derived RPE cultures ranges from a fusiform to cuboidal morphology depending on culture conditions over time. As the number of healthy cuboidal RPE cells increases, the cellular monolayer acquires an increasing degree of cobblestone morphology. Experienced observers chose the images shown in Fig. 1 to represent the spectrum of cobblestone morphology on a scale of 1 to 5. The lower end of the scale (Category 1) represents fusiform cells in a disordered pattern as found in less differentiated cultures or cultures that have undergone EMT. The higher end of the scale (Category 5) represents cuboidal cells densely packed in an ordered cobblestone pattern as found in the native RPE layer and healthy RPE cultures. Our automated analysis was developed referencing these 5 categories of the standard phase-contrast micrograph images. Human adult RPE cells used for this investigation were derived and cultured, as described previously.5,26 Phase images were captured using a Zeiss Axio observer D1 microscope. For immunostaining, RPE cells were fixed in 24-well culture plates (Cat. No. 3527; Corning), using 4% paraformaldehyde in phosphate-buffered saline (PBS) for 10 min, followed by rinsing 3 times with PBS. Fixed cells were processed for immunostaining with ZO-1, as described previously. 26 The resolution of phase images was 0.31 μm per pixel, and for fluorescence the resolutions were 0.49 μm per pixel.
Image preprocessing
The image preprocessing for both the phase and ZO-1 fluorescence images uses a denoising algorithm originally developed for fluorescent spot detection, 18 and later extended for multichannel 3D stem cell images. 17 The approach models image noise as consisting of low-frequency structural noise and high-frequency imaging shot noise. A Gaussian filter with standard deviation of 10 pixels is used to remove low-frequency structural background. Next, a median filter with support of 5 pixels is used to remove shot noise. Finally, a standard deviation filter, 27 again with a support of 5 pixels, is used to enhance edges.
Normalized compression distance
To classify a 2-dimensional cell culture, we measured its similarity to a training set of images known to belong to a particular category. The NCD is an effective technique for measuring similarity among complex digital data. The NCD measures similarity between digital objects on a scale from 0 (least similar) to 1 (most similar). The NCD uses file compression algorithms as a basis for approximating the relative Kolmogorov complexity.8,9 Given a set of images X, the NCD of that is defined as
where G(X) is the size in bytes of the each image in X concatenated one after another. The NCD(X) can be thought of as a “diameter” for the set X. If we have training sets of labeled RPE images
Where
The NCD was originally formulated as a distance between pairs of digital objects, rather than multisets as described in Eq. (1). For this formulation, Eq. (1) is still valid, and results in a distance matrix among all of the training data and the image being classified. This distance matrix can then be processed using a spectral K-means algorithm, as described in Cohen et al. 11 Here, as in previous applications, slightly superior results are obtained using the multiset approach. The NCD can also be used in a semi-supervised manner, where unlabeled image data could potentially improve the classification accuracy, as described previously.12,13 This semi-supervised approach would require the NCD to be used in a pairwise spectral formulation.
NCD with image compression and wavelet decomposition
The NCD requires a compressed object size in bytes. To obtain a compression measure that captures visual structural similarity, we applied a wavelet filter (SYMLET) to each image, and computed the L1 norm of the approximation sub-band. The L1 norm captures the sparsity in this sub-band, based on how similar pairs or multisets of images are to each other. Equivalent classification results were also obtained using the wavelet-based JPEG 2000 compression algorithm, but at an increased run time.
Steerable wavelet filters
The SWF implementation uses the source code and approach published by Chenouard and Unser. 28 The source code required is freely available for research use and can be downloaded from http://bigwww.epfl.ch/demo/circular-wavelets/
For junction characterization, the images were preprocessed as described above. An additional morphological skeletonization and branch point extraction step was applied. Steerable wavelets were formed with 3 arms and a scale factor of 25, and placed at each detected branch point in the preprocessed image. The SWF was rotated in 1° increments from 1° to 120°, the maximum response at each rotation was taken as the response, and the junction points were identified as a thresholded regional maxima of the response.
Software, machines, and timing
All of the software tools used for classification here, along with sample images, are available free and open source under the GPL license. This allows the software to be freely accessed, then modified or used, and redistributed as long as the terms of the license are maintained.
The software is available at https://git-bioimage.coe.drexel.edu/opensource/rpe. Sample images can be downloaded from http://bioimage.coe.drexel.edu/openSource/RPE/rpeSampleImages.zip. For the SWFs, the additional toolkit must be downloaded directly from http://bigwww.epfl.ch/demo/circular-wavelets/.
Software tools are implemented primarily in MATLAB 2015b, and will require a license for MATLAB, including the image processing and wavelet toolkits. It is possible to compile these tools and redistribute them to clients without a MATLAB license. All results were obtained on a Windows 10 PC, with a 6 core i7 CPU, 64GB RAM, and an NVIDIA GTX680 video card. For NCD-based image classification, preprocessing the image training data requires approximately 1 h, with subsequent classification of a single unknown image requires approximately 30 s. The SWF-based image analysis requires ∼30 s per image, but does not require a preprocessing step.
Results
RPE cells have a tendency to undergo epithelial to mesenchymal transition (EMT) spontaneously in culture, depending upon the passage number and density of passaging. 16 RPE cells in their native epithelial form show cobblestone morphology; however, they become fibroblastic with a fusiform morphology when they undergo EMT. We identified RPE cells at various stages of EMT in culture and manually classified them into 5 categories with 5 being most cobblestone/epithelial and 1 being most fibroblastic/mesenchymal. We took images for each category from multiple RPE lines. Figure 1 shows examples of category 5 images in phase (top) and fluorescence microscopy (bottom).
Image preprocessing
A preprocessing step is applied to reduce the normal variations in image intensity that can occur for different culture and microscopy conditions. The preprocessing step also enhances the cobblestone structure that is being quantified in the subsequent classification and analysis.
The preprocessing steps are the same for both phase and fluorescence microscopy, but the algorithms use different parameters as detailed in the methods section. We use an approach applied previously in the analysis of 3D time-lapse microscopy of neural stem cells 17 known as contrast enhancement filtering. 18 Contrast enhancement filtering models the imaging noise as consisting of slow varying structural background noise combined with high-frequency shot noise. Each type of noise is filtered separately. A low-pass Gaussian filter is applied for the slow varying background and a median filter is applied for the high-frequency shot noise. For the NCD analysis, an additional texture filter is applied to enhance the edges along each cell boundary. For the SWF analysis, it is necessary to scale the SWF based on the length of the linear cell–cell contacts formed by tight junctions that underlie the hexagonal structure in the images. For the images in this study we used a scale factor of 25.
Image classification using the NCD
We analyzed 34 phase-contrast images of RPE monolayers that were manually labeled with a cobblestone measure from 1 (least cobblestone) to 5 (most cobblestone). The resulting change in NCD for each multiset of training images is shown in Fig. 2. We used the same approach to analyze 30 fluorescence images labeled with ZO-1 that marks tight junctions in RPE cultures, also classifying those into the same set of manually labeled classes. Ninety-five percent confidence intervals for the classification were computed as described in Witten and Frank 19 and are reported in square brackets following the classification result. All 34 phase images were correctly classified, with 100% accuracy [0.9, 1.0]. For the ZO-1 images, the images were classified with 87% accuracy [0.71, 0.95]. The NCD classification of cobblestone formation is effective at providing a single cobblestone metric across the entire image. Figure 2 shows all 34 of the phase contrast images that were classified, grouped by their manually labeled cobblestone value. Table 1 lists each image identified in Fig. 2, and lists the change in NCD value of each of the 5 classes for each training set when the image, treated as an unknown, is added to the training set. Each image is assigned to the class with the minimal increase in NCD.

Phase contrast RPE images. Each image is manually labeled into classes 1 (least cobblestone) through 5 (most cobblestone). Classification values detailed in Table 1. All 34 images were correctly classified using compression distance. Scale bar indicates 50 μm. RPE, retinal pigment epithelium.
The image class and ID is shown in the 2 left columns, corresponding images are shown in Fig. 1. Each image is assigned to the class that achieves the minimal increase in diameter when the image is added to the training set. The minimum value is in italics for each image. Classification was 100% correct.
Measuring junction characteristics using SWFs
SWFs are mathematically parameterized shapes that are useful for measuring symmetry in images. SWFs can be created to measure arbitrary symmetrical structures by controlling the number of “arms” in the shape. In addition to the shape, the rotation and scale of the structures are controlled by a single parameter. Figure 3 shows an example of a SWF being rotated at 3 points (red, green, and blue) on a ZO-1 image. The resulting red, green, and blue curves are shown in the adjacent panel indicating the relative response as the filters are rotated 360°, with snapshots shown at the red maximum (left) and minimum (right). Note that the response curve has a phase of 120° due to the symmetry of the SWF. Supplementary Movie S1 is available online at www.liebertpub.com/jop.
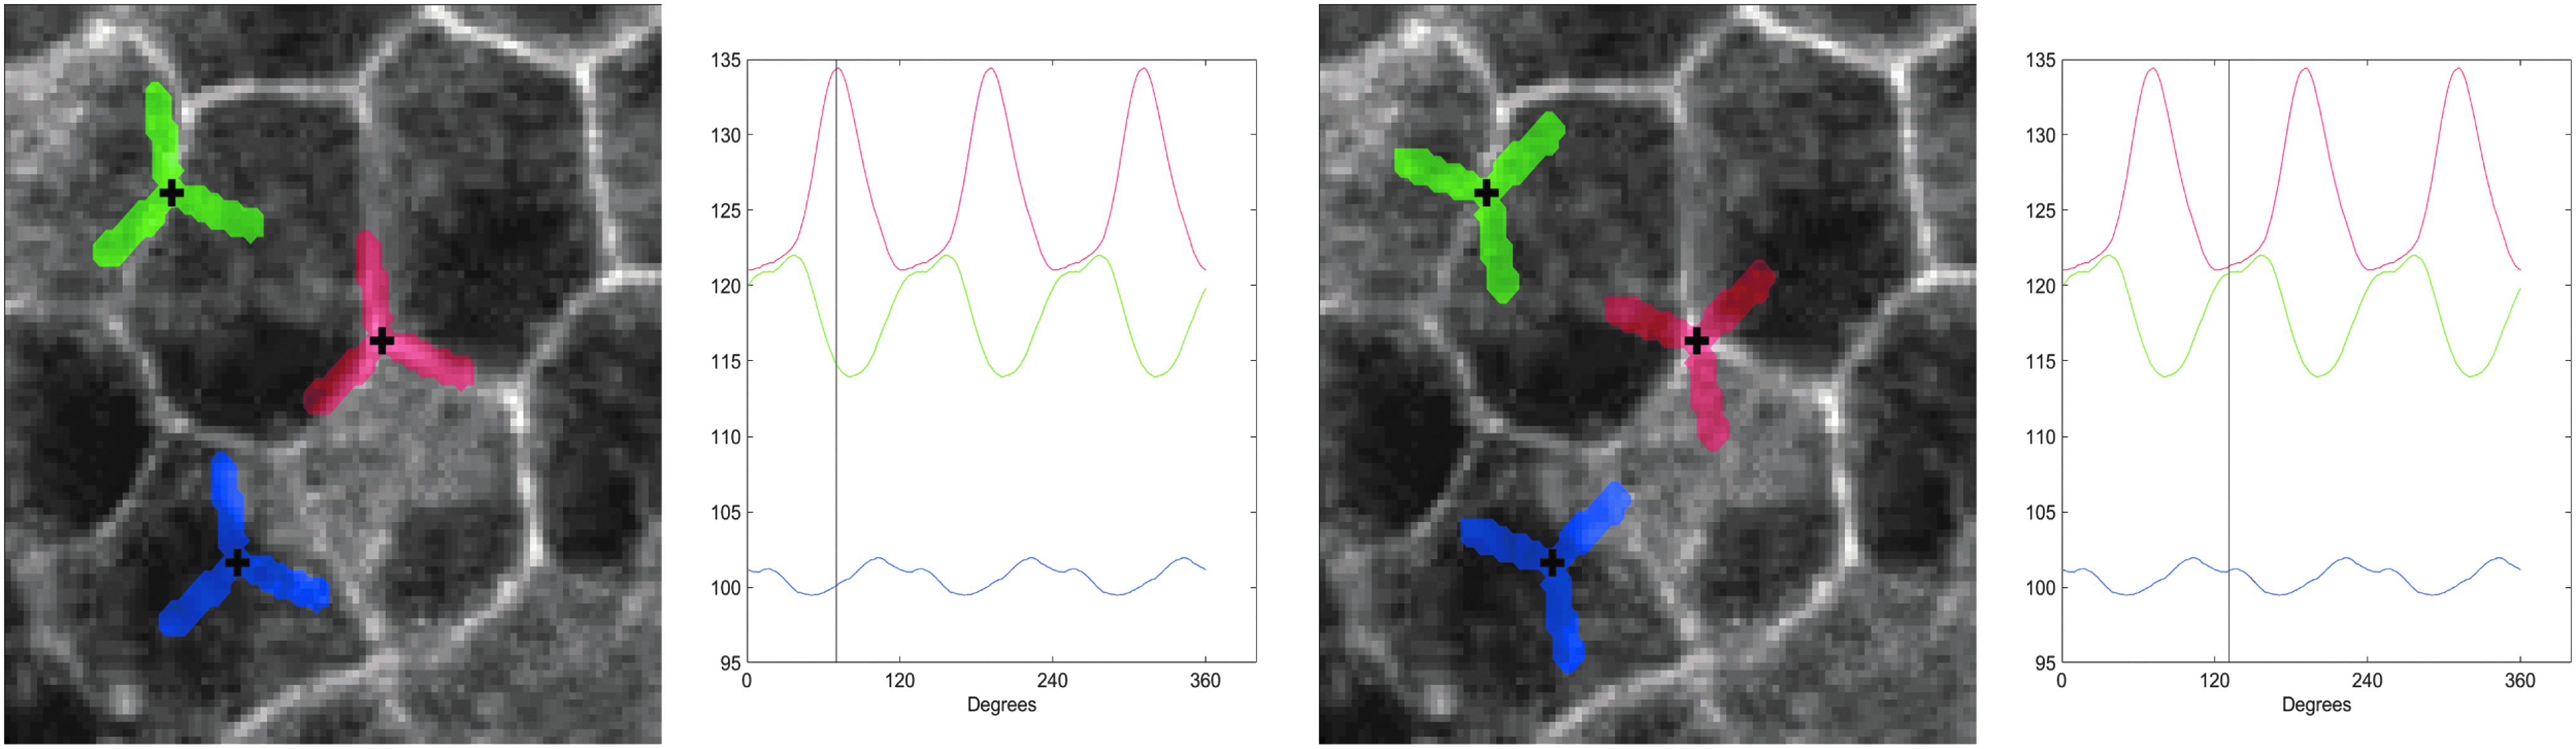
SWFs detect cobblestone morphology. The SWF shape (number of arms), rotation, and scale are each controlled with a single parameter. A zoomed view of RPE cells with 3 SWFs overlaid. The relative response of each of the 3 filters encoded by color as they are rotated from 0° to 360°. This is shown for the maximum response of the red filter (left) and the minimum response for the red filter (right).
Candidate points for SWF characterization were identified in each image by applying a morphological skeletonization to the preprocessed images. The branch points were selected for further processing. Figure 4A shows a preprocessed ZO-1 image. Figure 4B shows the skeletonization with branch points marked as yellow dots. Figure 4C shows the normalized filter response for each branch point that exceeds an empirically determined threshold. Figure 4D shows a box plot of the distributions of the SWF responses for all of the ZO-1 images from each manually labeled class. The red line of the plot is the median, with the notches around the red line indicating a graphical 95% confidence interval. The blue box extends from the 25th to 75th percentile of the data, and the whiskers show all data not considered outliers. Each of the categories has statistically significant differences in SWF response, although with enough variability and overlap between classes to preclude accurate classification based on the SWF response alone.

Cobblestone junction detection using SWFs. A preprocessed ZO-1 image
SWFs were implemented as described in Puspoki et al. 20 A 3-arm filter with a scale factor of 25 was placed at each branch point of the skeletonization and rotated 1° at a time through 120°, with the filter response computed at each pixel. The closer each junction point is to a perfect 120° hexagonal junction, the higher the peak for the relative maxima. This iterative approach provides characteristics of the individual junctions, and also the spatial distributions of the junctions. For the fluorescence ZO-1 images, the SWFs consistently captured junction points. For the phase microscopy images, the SWFs were not as effective due to the increased variability associated with phase-contrast imaging. Nevertheless, SWFs show promise for objective characterization of cobblestone distribution throughout the image.
Discussion
Measuring the amount of cobblestone morphology in a microscopy image is an important and complex image analysis task. We have described 2 approaches for characterizing cobblestone structure. The first approach is based on algorithmic information theory and does not require feature extraction. This novel method is able to reliably process large amounts of image data with high accuracy. The second approach uses SWFs as the basis for a feature-based image analysis approach allowing the precise characteristics of individual junctions to be measured. These techniques provide a rapid, objective, accurate, and quantitative measurement of cobblestone morphology in stem cell-derived RPE cell cultures. Both approaches are applicable to other epithelial cell cultures that display a cobblestone pattern.
Automated measurements of cobblestone morphology are useful to characterized RPE and other progeny produced from stem cells. With emerging stem cell technology, large quantities of human cell progeny can be differentiated into a variety of specific cell types useful for replacement therapy and disease modeling for drug development. For therapeutic applications, the cells produced are assessed using thresholds demonstrating purity and identity, and this can benefit from the efficient, objective method demonstrated by automated image analysis. This applies to a variety of tissue types with characteristic cobblestone morphology, including the RPE, corneal limbal epithelium, corneal endothelium, renal tubular epithelium, certain vascular endothelia, and other types of epithelial progeny.
In addition to characterizing cell cultures, quantitative description of cobblestone morphology may also be useful for in situ applications. The cobblestone pattern of the corneal endothelium for example is routinely observed as a clinical indicator of Fuchs Disease progression or the extent of traumatic corneal damage. Current methods describe corneal endothelium cell density, but not accompanying changes in cell morphology associated with corneal health. 4 The automated image analysis methods we describe can be readily applied to corneal endothelium images obtained to evaluate corneal disease progression. Furthermore, advances in adaptive optics now allow in situ imaging of the RPE layer and changes associated with AMD. 1 By applying the methods we describe, changes in the cobblestone pattern can now be objectively analyzed to provide a new measure of AMD.
Alternative approaches to characterizing RPE development might benefit from time-lapse microscopy analysis,17,21–23 where cobblestone structure formation can be visualized over time. Time-lapse microscopy requires more complex imaging and analysis, making it less well-suited for practical characterization of RPE cultures. For static image analysis, one popular alternative to using the NCD is an approach based on convolutional neural networks (CNNs). 24 CNNs have been applied in many machine vision tasks, including biological image analysis. In other work, we have found approaches based on CNNs to obtain results comparable to the NCD, 8 and have also found the ability to improve the performance of the NCD by combining it with the subsequent neural network or other supervised machine learning algorithms. One key difference is that because the NCD is a metric distance, it enables direct comparisons of visual similarity among different image training sets. The SWFs also provide a valuable means for extracting features from RPE image data, and are likely to prove useful moving forward to more accurately characterize dynamic changes in RPE culture viability. While there are many approaches to feature-based characterization of microscopy images, 25 steerable wavelets offer the advantage of a compact parameterized shape representation that efficiently quantifies the symmetries associated with cobblestone junctions.
In summary, the computational image analysis approaches described in this study provide an automated, objective measure of a spectrum of visually identifiable morphology present in cellular monolayers. We have applied this to determine the degree of cobblestone morphology present in stem cell-derived RPE monolayer cultures. The NCD approach accurately classifies cobblestone formation across an entire culture image, whereas the SWFs provide a characterization of the hexagonal junctions formed by individual cells. These measurements of cobblestone morphology provide valuable new approaches to determine the purity and identity of stem cell-derived RPE monolayer cultures.
Footnotes
Acknowledgments
This work was supported by research grant R01NS076709 from the National Institute of Neurological Disorders and Stroke of the U.S. National Institutes of Health. A preliminary version of this article was presented at the 2015 BioImage Informatics conference in Gaithersburg, Maryland. This research was also supported by the Empire State Stem Cell Fund through the New York State Department of Health Contract No. C028504. Opinions expressed here are solely those of the authors and do not necessarily reflect those of the Empire State Stem Cell Board, the New York State Department of Health, or the State of New York.
Author Disclosure Statement
No competing financial interests exist.
References
Supplementary Material
Please find the following supplemental material available below.
For Open Access articles published under a Creative Commons License, all supplemental material carries the same license as the article it is associated with.
For non-Open Access articles published, all supplemental material carries a non-exclusive license, and permission requests for re-use of supplemental material or any part of supplemental material shall be sent directly to the copyright owner as specified in the copyright notice associated with the article.
