
Abstract
Abstract
Purpose:
To investigate the effect of excipients on latanoprost penetration into the aqueous humor with clinically available 6 products with different solutions mainly in the types and concentrations of preservatives.
Methods:
In 363 patients with cataracts, we instilled 1 latanoprost drop in 1 eye before surgery. The drop was randomly selected by brand name product (A) and 5 generic products (B–F) composed with different excipients. B contains similar excipients to A. C and D contain lower concentrations of benzalkonium chloride than A. E includes sodium benzoate, and F contains no preservatives. At 0.5–1, 3, and 6 h after instillation, samples of aqueous humor were collected to determine the latanoprost free acid by mass spectrometry. The time course of intraocular concentration and the areas under the aqueous humor latanoprost free acid concentration–time curves (AUCs) were calculated.
Results:
At 0.5–1 h, the aqueous humor concentration of latanoprost free acid was 8.5 ± 1.0 ng/mL for C, which was significantly higher (P < 0.01) than that of A (3.4 ± 0.5 ng/mL). At 3 and 6 h, however, no significant difference was noted in the concentrations of latanoprost free acid between the brand name and generic products. For each of the generic products, the peak free acid concentration was above the known threshold concentration for biological activity. At 6 h postdose, however, the levels of latanoprost free acid were below the threshold for Products C, E, and F. Comparisons of AUC0–6h and AUC0–24h values showed that these parameters were the greatest with A, and E was significantly inferior to A (P < 0.05).
Conclusions:
Currently available latanoprost solutions with different preservatives showed sufficient intraocular concentration to activate the FP receptor, but different pharmacokinetic profiles of absorption or elimination.
Background
G
Benzalkonium chloride (BAK), a common preservative used in ∼70% of commercial ophthalmic solutions, is known to impact drug permeability by its permeation-enhancing effect3,4 and to cause dose-dependent cytotoxicity to the corneal epithelium.3,5 In glaucoma medical treatment, concomitant and long-term use of eye drops often accelerates ocular surface diseases. The presence of ocular surface diseases may lead to poor adherence for self-medication with eye drops, 6 and accordingly, poor prognosis will be expected. 7 Thus, in newly developed glaucoma drugs, the concentration of preservatives has been lowered or BAK-free solutions have been developed in a type of unit-dose product or filter-installed container.
Beta-blocker is 1 of 8 classes of drugs for glaucoma treatment. Timolol in particular has a long history of clinical use, and its permeation behavior has been well documented. Recent findings suggest that ocular permeability of timolol was influenced by both BAK concentration and pH. 8 The wide varieties of timolol formulations provide a rich source of test samples to investigate the impact of excipients on timolol permeability. One recent study showed that 3 fixed-dose combination formulations of timolol plus another hypotensive were superior to timolol monotherapy in terms of ocular permeation. 8 Thus, excipients and concurrent drugs can have a considerable impact on timolol permeation behavior.
Latanoprost and other prostaglandin (PG) analogs are currently the first-choice therapies for glaucoma. PG analogs are prodrugs that exhibit their IOP-lowering effect when hydrolyzed by corneal esterases into their biologically active free acid form. The free acid increases uveoscleral outflow via activation of prostanoid FP (FP) receptors in the ciliary muscle. 9 As of November 2014, 28 latanoprost ophthalmic solutions were commercially available in Japan. Whereas the latanoprost concentration is the same in all these products (0.005%, 50 μg/mL), the types and amounts of excipients vary considerably among them. The main reason for varieties is aiming the new formula to reduce the side effect by excipients, including preservatives.6,10 However, such variations are likely to impact the corneal permeability of latanoprost, as reported for timolol. This concern may increase not only in Japan but also in other countries. To the best of our knowledge, no studies have compared the latanoprost permeation profiles between commercial products with different excipients.
Against this background, we compared the ocular permeability profiles of latanoprost between commercially available ophthalmic products with different profiles of excipients. The primary objective of this study was to investigate the effects of excipients on the behavior of latanoprost free acid. Exploratory objectives included identifying the optimal combination of excipients that would maximize the intraocular permeability of latanoprost and minimize its adverse reactions.
Methods
Study patients
This study included patients scheduled to undergo cataract surgery from December 2012 to June 2014 at Hara Eye Clinic, Tochigi, Japan, and who provided informed consent. Exclusion criteria were (1) laser or other type of eye surgery within 3 months before the cataract surgery and (2) use of glaucoma eye drops within 1 month before the cataract surgery.
Study design
This was a nonrandomized, single-blind, parallel-group comparison study. After obtaining their written informed consent, the principal investigator (T.H.) assigned each patient to 1 of the 6 study drugs according to the date of cataract surgery and gave either the patient or the attending nurse a bottle containing one of the study drugs for instillation. The investigators in charge of surgery (M.H., M.A.) and the investigator in charge of statistical analysis (Y.S.) were blinded to the study drug allocation.
One drop of the assigned study drug was instilled as instructed at 0.5, 1, 3, or 6 h before the scheduled time of surgery, and the investigators (M.H., M.A.) withdrew ∼100 μL of aqueous humor at the start of surgery. The attending nurse administered the study drug to the patients assigned to instillation at 0.5, 1, or 3 h before the start of surgery, whereas the patients assigned to instillation at 6 h before the start of surgery administered the study drug by themselves at home. These patients were given a form to enter at the time of self-administration. The planned numbers of patients scheduled for instillation at 0.5, 1, 3, and 6 h before surgery were 15, 15, 10, and 10, respectively. These sample sizes were determined by taking latanoprost free acid into consideration, time to reach the maximum aqueous humor concentration (tmax 5 min), and the elimination half-life (t1/2 17 min). 9 To prevent administration error, patients scheduled to undergo the surgery on the same day were assigned to receive the same medication.
Study drugs
To choose the most appropriate study drugs from the group of latanoprost 0.005% ophthalmic solutions available in Japan as of 2011, their package inserts and other medical documents (interview form) were surveyed to identify the excipients they contained.9,11–15 The concentration of the preservative BAK was considered a major factor influencing the aqueous humor concentration of latanoprost free acid, because BAK was shown to accelerate latanoprost permeability 8 and cause concentration-dependent corneal toxicity. 4 Based on these considerations, the following 5 generic ophthalmic solutions were chosen in addition to Product A, which was Xalatan® 0.005% (0.02% BAK; Pfizer Japan, Tokyo, Japan); B, latanoprost ophthalmic solution 0.005% Senju® (0.02% BAK; Senju Pharmaceutical, Osaka, Japan); C, latanoprost ophthalmic solution 0.005% Kaken (0.02% BAK, polyoxyl 40 stearate was included as a solubilizer; Kaken Pharmaceutical, Tokyo); D, latanoprost ophthalmic solution 0.005% Sawai (0.011% BAK; Sawai Pharmaceutical, Osaka); E, latanoprost ophthalmic solution 0.005% Nitten (sodium benzoate was included as a preservative in place of BAK; Nitten Pharmaceutical, Aichi, Japan); and F, latanoprost PF ophthalmic solution 0.005% Nitten (preservative free; Nitten Pharmaceutical). The excipients contained in these study drugs are summarized in Table 1.
○: Component names are displayed for each products.
Δ: Component names are not displayed for each products, but content can be predicted.
BAK, benzalkonium chloride; LOS, latanoprost ophthalmic solution 0.005%; LOS-PF, latanoprost PF ophthalmic solution 0.005%.
Endpoints
The endpoints of this clinical trial were the time course of changes in aqueous humor concentrations of the prodrug and free acid forms of latanoprost and the area under the aqueous humor latanoprost free acid concentration–time curve (AUC).
Measurement methods
Collected samples of aqueous humor were immediately frozen, packed with dry ice, and shipped to ADME & Tox. Research Institute, Sekisui Medical, Ibaraki, Japan. The transferred samples were stored at −20°C (permissible range: −10°C to −30°C) until assay. After thawing and stirring of the sample, a 0.04 mL aliquot was separated and added to 0.04 mL of acetonitrile solution containing 0.1% formic acid, and the mixture was defined as the measurement sample. An appropriate amount of saline solution was added to samples whose volumes were <0.04 mL. The measurement sample was then mixed with 0.06 mL of 500 ng/mL latanoprost free acid-d4 (internal standard), 0.2 mL of 5 mmol aqueous ammonium acetate solution (pH 5.0), and 1 mL of ethyl acetate. The mixture was then stirred for 5 min and centrifuged (1800 g, 4°C, 5 min). The entire organic layer was separated and dried under a nitrogen atmosphere (40°C). The dried residue was then dissolved in 0.15 mL of a 1:1 (v/v) mixture of 0.1% aqueous formic acid solution and acetonitrile solution containing 0.1% formic acid. The supernatant was isolated and centrifuged (5000 g, 5 min) using a 0.2-μm-pore filter (Millipore UFC30LG00), and the resultant filtrate was subjected to liquid chromatography (LC)/tandem mass spectrometry. Samples were prepared and measured once, except for the following cases: (1) pretreatment failure, (2) measurement system malfunctioning, or (3) poor peak shape or resolution due to interfering peaks, column degradation, or other causes. The acceptance criteria for the calibration curves for the prodrug and free acid forms of latanoprost included correlation coefficient >0.99. LC analysis was carried out under the following conditions: column size, 3 × 50 mm (Imtakt Cadenza CD-C18; particle size, 3 μm); mobile phase, 10:90 (v/v) mixture of 0.1% formic acid in water and 0.1% formic acid in methanol; flow rate, 0.2 mL/min; autosampler temperature, 4°C; column temperature, 40°C; injection volume, 15 μL; and analysis time, 5 min. MS/MS analysis conditions were as follows: ionization mode, electrospray; source, turbo spray; polarity, positive; scan mode, multiple reaction monitoring; ion-spray voltage, 5000 V; temperature, 500°C; curtain gas, 30 psi (nitrogen); gas 1, 40 psi (air); gas 2, 10 psi (air); collision gas, Level 3 (nitrogen); interface heater, on; dwell tie, 200 ms; ion monitoring(Q1→Q3) (collision energy 16 V); latanoprost prodrug 433.30 → 379.20; latanoprost free acid 391.30 → 337.30; and the internal standard 395.30 → 341.20. To determine the sample concentrations of the prodrug and free acid forms of latanoprost, the standard curve was created using standard solutions of the prodrug and free acid forms of latanoprost. The lower limit of detection was 1.0 ng/mL for both compounds.
Before collecting patient samples, the possibility of latanoprost binding to the sampling tube's inner surface was investigated using standard solutions of the prodrug and free acid forms of latanoprost. The results revealed no significant adsorption.
AUC determination
The 6- and 24-h AUCs (AUC6h and AUC24h) were determined as described below.
Creation of the standard latanoprost free acid concentration–time curve
To simulate the latanoprost free acid pharmacokinetics in aqueous humor, a 1-compartment model NAPP (Numeric Analysis Program for Pharmacokinetics, Department of Pharmacy, the University of Tokyo Hospital, Tokyo, Japan) was used, 16 which involved drug absorption and elimination processes. The total latanoprost dose was estimated at 1.0 μg, assuming a conjunctival sac volume of 20 μL. The volume of distribution (Vd), absorption rate constant (Ka), and elimination rate constant (Kel) were determined from all measurements above the lower limit of detection (1.0 ng/mL) by nonlinear least squares optimization (weighting factor = 2). The obtained pharmacokinetic parameter values were used to plot the standard aqueous humor latanoprost free acid concentration–time curve (standard curve), from which the standard AUC value was computed.
Determination of AUCs for individual study drugs
AUC6h and AUC24h values were determined for individual study drugs based on latanoprost free acid concentration measurements and the standard curve. The resulting AUCs were compared between the brand name product and the generic products. In determining the AUC, measurement results below the lower limit of detection were handled as 0 ng/mL.
Statistical analysis
Aqueous humor concentrations of latanoprost free acid were summarized as mean ± standard deviation for each study drug. Possible differences in AUC between the study drugs were analyzed at a statistical significance level of 0.05 using Dunnett's test with Product A as the dependent variable, following a 1-way analysis of variance. The NAPP Version 2.3 was used for nonlinear least squares optimization and computation of AUCs. Other statistical procedures were performed using SPSS Statistics 22 (IBM Japan, Kanagawa, Japan).
Ethical considerations
Before consenting to study participation, prospective participants were given a full oral and written account of the study and asked to make their decisions on a purely voluntary basis. Before the initiation of this study, its protocol was reviewed and approved by the Chiba University Graduate School of Pharmaceutical Sciences Ethics Committee [approval No. 288-2(2012), 163-10(2013), 239-5(2014)]. This study was carried out in compliance with the World Medical Association's Declaration of Helsinki and the Ministry of Health, Labour and Welfare (MHLW)'s Ethical Guidelines for Clinical Trials (2003 MHLW Notification No. 255).
Results
The numbers of samples collected for each study drug are shown in Table 2. Samples collected at 0.5 and 1 h postdose were handled as belonging to the same group (0.5–1 h postdose), because variations from the scheduled sampling time points rendered it unreasonable to separate them into 2 distinct groups. Due to technical difficulty in collecting aqueous humor samples in certain patients, the numbers of obtained samples differed considerably by study drug.
The number of samples of each collected medicine is shown. The numbers in ( ) indicate the number of samples where latanoprost free acid concentration was below the detection limit (1.0 ng/mL).
0.5–1 h: Sample collection time was <2 h after instillation.
3 h: Sample collection time was 2–4.5 h after instillation.
6 h: Sample collection time was 4.5 h or more after instillation.
Similar to previously reported results, 9 aqueous humor samples collected in this study contained no quantifiable levels of latanoprost prodrug, and only the free acid form was detected. Latanoprost free acid measurement results below the lower limit of detection were mostly related to sampling at 0.5 or 1 h postdose, and 80% of them were related to sampling within 0.5 h postdose.
Different study drugs exhibited different time–concentration patterns of latanoprost free acid. Product A yielded detectable levels of latanoprost free acid at 20 min postdose in most aqueous humor samples. However, all samples collected within 30 min postdose in patients treated with Product F were negative for latanoprost free acid, and some of the samples collected at 40 min postdose in these patients were also negative. With Product C, 37.5% of samples collected at 6 h postdose were below the lower limit of detection.
Figure 1 shows the aqueous humor concentration of latanoprost free acid for each study drug, and Table 3 summarizes the comparison results between the brand name and generic products. For Product C, the mean concentrations of latanoprost free acid were significantly higher than that of Product A at 0.5–1 h postdose (P < 0.001), and were lower, although not significantly so, than that of Product A at 3 and 6 h postdose. With Product E, the mean concentration of latanoprost free acid was higher at 0.5–1 h postdose and lower at 3 and 6 h postdose than Product A. Of note is that the mean concentration of latanoprost free acid at 6 h postdose for Product E was less than 1–10th of that for Product A. The mean concentration of latanoprost free acid at 3 h postdose ranged 16.3–39.0 ng/mL, and no statistically significant difference was observed between the brand name product and any generic product tested. At 6 h postdose, the mean concentration of latanoprost free acid ranged 1.9–21.3 ng/mL. Product A provided the highest concentration, although the differences from the generic products were not statistically significant.

Trend of latanoprost free acid concentration in aqueous humor after instillation. Product A: Xalatan® 0.005% (0.02% BAK; Pfizer Japan, Tokyo, Japan), Product B: latanoprost ophthalmic solution 0.005% Senju® (0.02% BAK; Senju Pharmaceutical, Osaka, Japan), Product C: latanoprost ophthalmic solution 0.005% Kaken (0.02% BAK, polyoxyl 40 stearate was included as a solubilizer; Kaken Pharmaceutical, Tokyo), Product D: latanoprost ophthalmic solution 0.005% Sawai (0.011% BAK; Sawai Pharmaceutical, Osaka), Product E: latanoprost ophthalmic solution 0.005% Nitten (sodium benzoate was included as a preservative in place of BAK; Nitten Pharmaceutical, Aichi, Japan), Product F: latanoprost PF ophthalmic solution 0.005% Nitten (preservative free; Nitten Pharmaceutical). BAK, benzalkonium chloride.
All sample data below the detection limit were calculated as 0 ng/mL.
Data are expressed as mean ± SE.
0.5–1 h: Sample collection time was <2 h after instillation.
3 h: Sample collection time was 2–4.5 h after instillation.
6 h: Sample collection time was 4.5 h or more after instillation.
P < 0.01 (Dunnett test, dependent variable: Product A).
Figure 2 represents the aqueous humor latanoprost free acid concentration–time curve generated from the 1-compartment model analysis of 323 samples that yielded values above the lower limit of detection. The 1-compartment model provided a Vd of 0.076 mL, Ka of 0.00622/min, and Kel of 0.00622/min. The AUC6h and AUC24h values for each study drug and the comparison results between the brand name and generic products are shown in Table 4. Product E yielded significantly smaller AUC6h and AUC24h values than Product A (both Ps = 0.027).
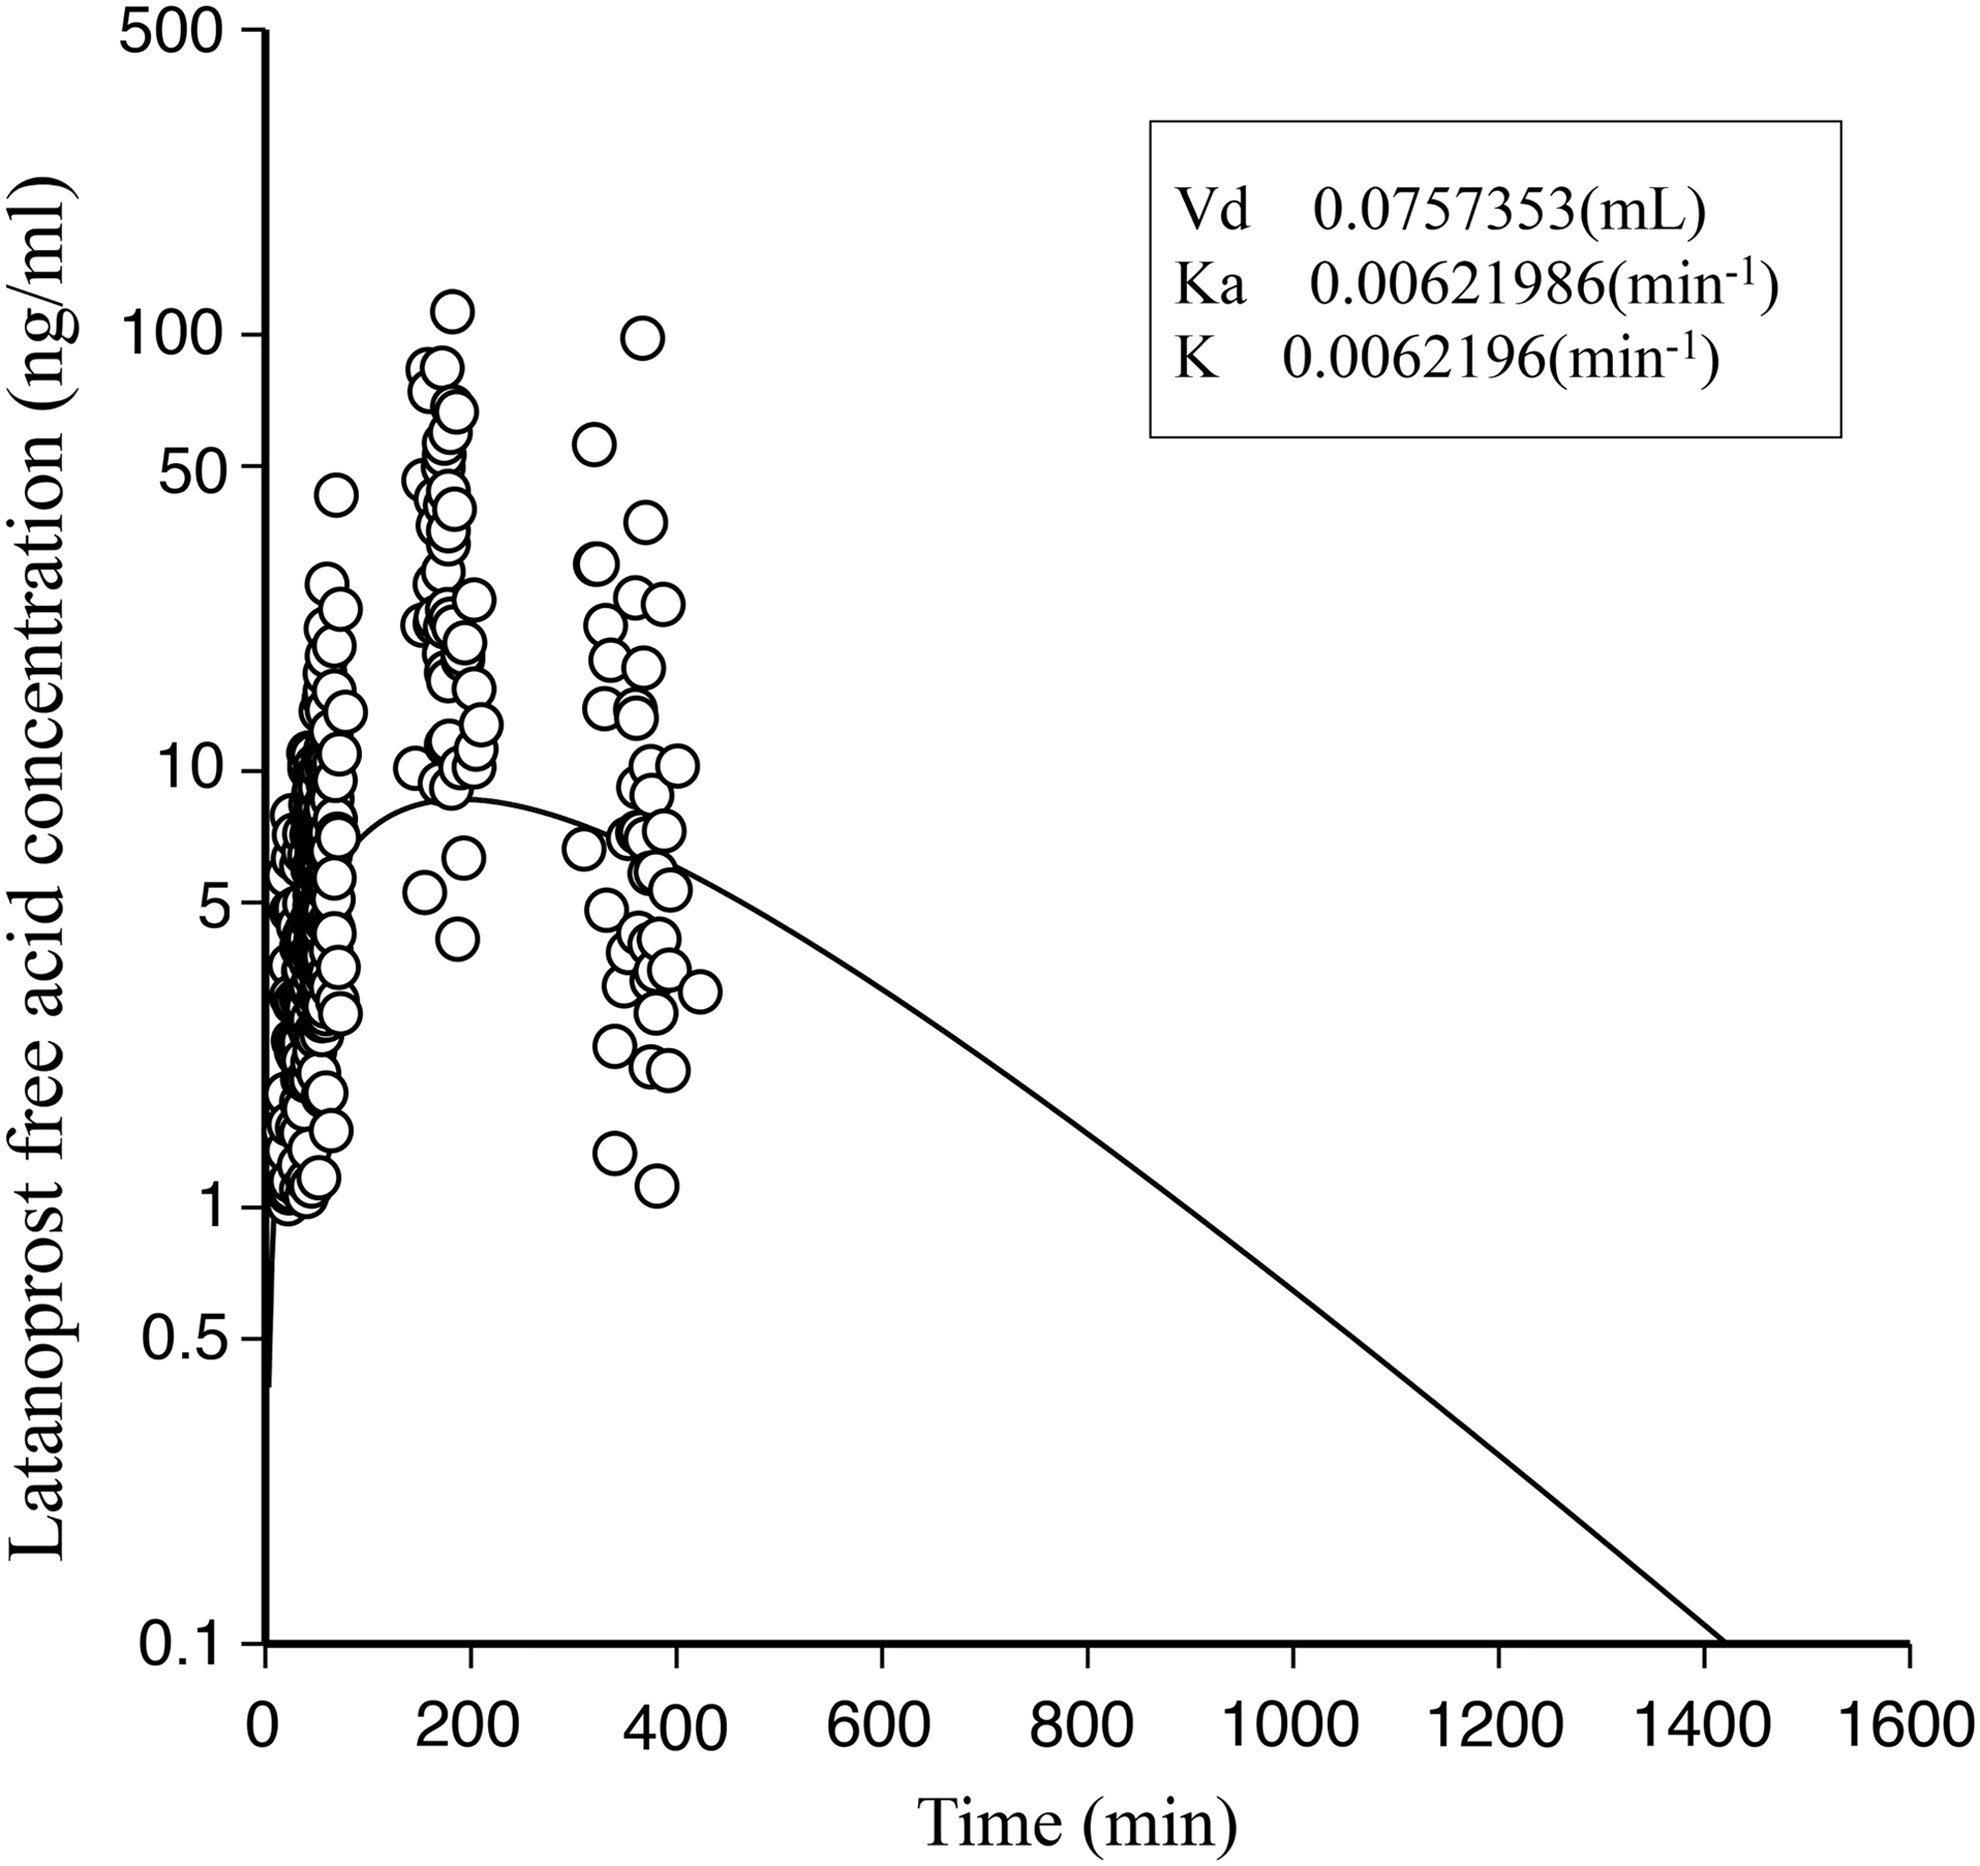
Latanoprost free acid concentration in aqueous humor curve by 1-compartment model. Latanoprost free acid concentrations in aqueous humor exceeding the lower limit of detection (1.0 ng/mL) collected from 323 cataract patients after 1 μg latanoprost instillation were analyzed with NAPP weight value: 2. Vd was 0.076 mL, Ka was 0.00622 min−1, and Kel was 0.00622 min−1. NAPP, Numeric Analysis Program for Pharmacokinetics; Vd, volume of distribution.
Data are expressed as mean ± SE.
P < 0.05 (Dunnett test, dependent variable: Product A).
AUC, area under the aqueous humor latanoprost free acid concentration–time curve; CI, confidence interval.
Discussion
This is the first human study to investigate the profile of drug penetration into the anterior chamber using different ophthalmic solutions with various preservatives. The mean aqueous humor concentration of latanoprost free acid ranged 16.3–38.0 ng/mL at 3 h postdose (peak level), and no statistically significant differences were noted between the study drugs. These levels were sufficiently high to activate the FP receptor, in light of an in vitro study that showed that latanoprost free acid concentrations of 12.50–48.43 ng/mL effectively activated the FP receptor 17 and an in vivo study in domestic cats (Felis catus) that reported a half-maximal effective concentration of 0.71 nM. 18 Our results suggest that the products of latanoprost with different types and concentrations of preservatives induced sufficient penetration of latanoprost into the anterior chamber and were ensured for clinical use instead of the brand name product. Thus, these products, including latanoprost, may be promising in reducing ocular side effects without affecting IOP reduction.
However, this study also suggested that ophthalmic solutions containing the same concentration of the active component could demonstrate different absorption and elimination profiles of the active component if the composition of other components differed. Specifically, the difference in mean aqueous humor concentration of latanoprost free acid at 0.5 to 1 h postdose between Product A (3.4 ng/mL) and Product C (8.5 ng/mL) was statistically significant (P < 0.01). In addition, Products C, E, and F yielded latanoprost free acid concentrations below the lower effective threshold at 6 h postdose, whereas other products maintained effective levels of latanoprost free acid up to this time point. The generic products have been approved based on their bioequivalence to the brand name product, and the pharmacokinetic differences documented in our study are unlikely to compromise the pharmaceutical quality of the generic products. Yet, our findings underscore the importance of investigating the possible impact of pharmacokinetic differences on the safety and efficacy profiles of the drugs.
Product E showed significantly smaller AUC6h and AUC24h values than Product A. Product E contained sodium benzoate in place of BAK. It has been suggested that long-term use of sodium benzoate may help cure drug-induced injury to the corneal epithelium, 19 whereas BAK is reported to enhance ocular drug permeability and cause damage to the corneal epithelium. The pharmacokinetic differences noted in our study between Products A and E may be attributable to the presence and absence of these excipients. The impact of sodium benzoate on the behavior of latanoprost free acid deserves further investigation.
The aqueous humor t1/2 of latanoprost in this study was 1.86 h, which was similar to the 2.8 h reported by Sjöquist and Stjernschantz. 20 In a study that administered Product A to white rabbits, 21 an AUC8h of 17.68 ± 1.08 μg·min/mL was reported, whereas the AUC24h was 7.76 ± 1.96 μg·min/mL in our study. More than 2-fold difference was probably attributable to the differences in ocular physiology and structure between rabbits and humans.
In a previous study in rabbit eyes, BAK-free latanoprost ophthalmic solutions showed a significantly lower ocular permeability at 1 h postinstillation than the brand name product. 21 In our study, however, BAK-free Product F showed no noteworthy difference in ocular permeability of latanoprost free acid compared to the brand name product. The discrepancy between these results may be explained by the finding that BAK enhances corneal permeability more potently in rabbit eyes than in human eyes. 22
In a pharmacokinetic study of timolol maleate in rabbit eyes, Fukuda and Sasaki reported that timolol maleate penetration to the aqueous humor was dependent on pH and BAK concentration. 8 By contrast, our study revealed only a minor impact of excipients on the ophthalmic behavior of latanoprost free acid. Several reasons may be present. First, the pharmacokinetic properties of the active free acid are primarily regulated by the physical and chemical properties of the isopropyl ester prodrug. The prodrug is less susceptible to the ionic influence of the excipients than the free acid. In addition, the prodrug does not undergo pH-dependent protonation and deprotonation. Second, the partition coefficient (logP) of latanoprost is ∼4.3, 9 while other glaucoma agents, namely travoprost, bimatoprost, timolol maleate, and dorzolamide hydrochloride, have logP values of <3.0, 23 2.4, 24 −0.29, 25 and 0.15, 26 respectively. The higher lipid solubility of latanoprost favors its faster permeation across the corneal epithelium, which consists of squamous epithelial cells arranged in layers. These factors may account for the robust pharmacokinetic behavior of the active component contained despite its very low concentration of 0.005%, and independent of the excipients.
This clinical trial has several design limitations. First, our findings relate only to single-drop instillation, and the effects of repeated doses are unknown. Second, we lack information on the eye drops that patients used before participating in this study. The impact of those ophthalmic solutions, including their excipients, on the pharmacokinetic properties of latanoprost free acid was not evaluated. In particular, patients undergoing glaucoma pharmacotherapy receive 2 or more different eye drops at the same time when a single-eye drop product is not sufficient. 1 In addition, patients with glaucoma are frequently prescribed multiple ophthalmic solutions for the treatment of other eye conditions. Because BAK is used in ∼70% of commercially available eye drops, future studies should evaluate the impact of concurrent and long-term use of multiple eye drops on the permeability of the active compound. The optimal combination of excipients for glaucoma eye drops should be identified based on the analysis of risks and benefits to patients with glaucoma.
In conclusion, currently available latanoprost solutions with different preservatives and without preservatives showed sufficient intraocular concentration to activate the FP receptor, but different pharmacokinetic profiles of absorption or elimination. The reason for minimum effect of different preservatives on drug penetration may depend on the pharmacological characteristic of latanoprost itself. This study suggests that the improvement of ophthalmic solution to reduce ocular side effect by way of reduction of preservatives raises the benefit to improve medical prognosis of glaucoma treatment, at least in PG analogs. On the contrary, our study still warns the importance of selecting the optimum excipients for eye drops, in point of drug permeability and pharmacokinetics into the target tissue depending on the pharmacological profile.
Footnotes
Acknowledgments
This study was partly supported by Nitten Pharmaceutical, Aichi, Japan (Y.S., M.A.) and Senju Pharmaceutical Company, Osaka, Japan (Y.S.).
Author Disclosure Statement
No competing financial interests exist.