
Abstract
Purpose:
To evaluate the aqueous humor pharmacokinetics of a preservative-free 0.005% latanoprost unit-dose eye drop (test drug) compared with that of a benzalkonium chloride (BAK)-preserved 0.005% latanoprost branded product (control drug) following topical application to rabbits.
Methods:
A total of 120 healthy New Zealand albino rabbits were administrated test eye drops (T group) or control eye drops (C group) for a comparative pharmacokinetics study. The aqueous humor was collected at 0.5, 1, 1.5, 2, 3, 4, 6, 8, 12, and 24 h after a single dose or multiple doses. Ultraperformance liquid chromatography-tandem quadrupole mass spectrometry was employed to detect latanoprost free acid (LTA, the active metabolite of latanoprost) in the aqueous humor.
Results:
For the single-dose study, there was no significant difference (t-test, P > 0.05) in the peak concentration (Cmax) of LTA in aqueous humor between the T group (69.0 ± 23.4 ng/mL) and C group (73.8 ± 28.7 ng/mL). The area under the curve values over 12 h (AUC0–12h) of LTA for the 2 groups were 254.4 (ng/mL) × h and 219.5 (ng/mL) × h, respectively. For the multidose study, there was also no significant difference (t-test, P > 0.05) in the Cmax of LTA in the aqueous humor between the T group (86.8 ± 21.2 ng/mL) and C group (70.5 ± 25.9 ng/mL). The AUC0–12h values of LTA for the 2 groups were 274.5 (ng/mL) × h and 256.3 (ng/mL) × h, respectively.
Conclusions:
The preservative-free 0.005% latanoprost unit-dose eye drops demonstrated similar pharmacokinetic properties to the BAK-preserved branded product following topical application to rabbits.
Introduction
Glaucoma is a major cause of vision loss throughout the world. Treatment for glaucoma consists of reducing intraocular pressure (IOP) to an acceptable target range to prevent further optic nerve damage. With proper treatment, the progression of this disease can often be delayed or prevented. There are 5 major classes of drugs used for the treatment of glaucoma: (1) cholinergics (acetylcholine receptor agonists), (2) adrenoceptor agonists, (3) carbonic anhydrase inhibitors, (4) beta-adrenoceptor antagonists, and (5) prostaglandin analogs (PGAs). PGAs have been applied as first-line IOP-lowering agents for glaucoma therapy because of their long-term powerful IOP-lowering effect and relatively few systemic side effects.1–3
Latanoprost is a typical PGA that was first approved to treat glaucoma by the FDA. Currently, >30 topically used latanoprost ophthalmic solutions are commercially available worldwide. Most of them are packaged as multidose applications and include benzalkonium chloride (BAK), which is the most commonly used preservative in eye drops.4,5 The deleterious effects of BAK on the ocular surface have been extensively studied and demonstrated in vitro, in animal models and in humans. It has been shown to cause tear film instability (detergent effect), loss of goblet cells, conjunctival squamous metaplasia and apoptosis, disruption of the corneal epithelium barrier, and damage to deeper ocular tissues.6–9 BAK or other preservatives should take majority of the responsibility for drug-induced ocular surface disease in glaucoma patients.10–12
As a consequence, the development of preservative-free preparations may reduce such adverse effects and therefore improve patient compliance.13–15 There have also been suggestions that BAK can enhance the penetration of active molecules into deeper ocular structures.9,15 However, there are too many factors affecting the ocular pharmacokinetics of topically used ocular drugs. There has been no convincing evidence confirming the inferiority of preservative-free latanoprost to BAK-latanoprost in terms of the efficacy on IOP or absorption in the eye.16–18
In this study, we compared the aqueous humor pharmacokinetic profiles of a newly developed preservative-free unit dose of 0.005% latanoprost eye drops and a BAK-preserved 0.005% latanoprost branded product following topical application in rabbits. The primary objective of this study was to investigate whether the newly developed preservative-free formula has bioequivalence to the BAK-preserved branded product. Ultraperformance liquid chromatography-tandem quadrupole mass spectrometry (UPLC-MS/MS) was employed to detect the active metabolite latanoprost free acid (LTA) in the aqueous humor of rabbits.
Methods
Materials
Preservative-free unit-dose 0.005% latanoprost eye drops is a new product of China Otsuka Pharmaceutical Co., Ltd (test drug, Tianjin, China). BAK-preserved 0.005% latanoprost eye drops (Xalatan®) are a product of Pfizer Manufacturing Belgium NV (control drug, Puurs, Belgium). Latanoprost-related compound E (purity: 93%), which was used as the reference substance of LTA, was purchased from USP® (Rockville, MD). Latanoprost (free acid)-d4 (LTA-d4), which was used as an isotope internal standard (IS), was purchased from Cayman Chemical Company (Ann Arbor, MI).
Animals
A total of 120 healthy male New Zealand white rabbits weighing 2.0–2.5 kg were supplied by Qinglongshan Experimental Animal Breeding Farm (Nanjing, China). All animal care and experimental protocols were approved by the Ethical Committee of Experimental Animal Care of Henan Eye Institute and performed in compliance with the National Institutes of Health guidelines and the Association for Research in Vision and Ophthalmology statements concerning the use of animals in ophthalmological research. The rabbits were accommodated in cages and kept in a light-controlled chamber with controlled humidity (60% ± 5%) and temperature (20°C ± 5°C). Before drug administration, the eyes of the rabbits were examined by a hand slit lamp to ensure the absence of corneal lesions.
Administration and sample collection
For the single-dose study, 60 rabbits were equally and randomly divided into the test (T) and control (C) groups. Then, both groups were evenly and randomly separated into 10 time groups (3 animals in each time group). For drug administration, the lower eyelid of each rabbit eye was gently pulled away from the eye globe, and 30 μL of the test eye drops or control eye drops were pipetted into the lower conjunctival cul-de-sac (both sides, at a time interval of 1 min). The eyelids were kept closed for 10 s after administration to prevent the loss of the instilled drug solution. The eyes were rinsed with normal saline at 0.5, 1, 1.5, 2, 3, 4, 6, 8, 12, and 24 h after dosing. Then, the animals were sacrificed by an injection of a lethal overdose of pentobarbital sodium solution (4%, w/v) into the ear vein, and the aqueous humor was collected. For the multidose study, another 60 rabbits were grouped and administered the drug solution once daily for 1 week by the same administration method as mentioned above. The animals were sacrificed, and the aqueous humor was collected at 0.5, 1, 1.5, 2, 3, 4, 6, 8, 12, and 24 h after the last dosing. All collected samples were stored at −25°C ± 5°C until analysis.
Sample preparation
For the UPLC-MS/MS analysis, the aqueous humor samples were processed by a simplified extraction method. 16 After thawing and vortexing briefly, a 100 μL aliquot of each sample was separated and added to 10 μL of the IS solution (100 ng/mL). The mixture was vortexed for 1 min and added to 100 μL of an acetonitrile solution containing 0.1% formic acid. The mixture was vortexed for 1 min and added to 0.5 mL of ethyl acetate. The mixture was vortexed for 1 min and centrifuged for 5 min at 10,000 rpm (Mini Spin plus; Eppendorf, Germany).
The organic layer was pipetted into a pointed glass tube and dried under a nitrogen atmosphere at 60°C. The dried residue was then redissolved by 100 μL of a mixture of 0.1% (v/v) aqueous formic acid solution and 0.1% (v/v) acetonitrile formic acid solution (0.45:0.55, v/v). The samples were centrifuged for 8 min at 3,000 rpm (LD5-2A; Beijing Medical Centrifuge Company, Beijing, China), and the supernatant was transferred into a sample vial for UPLC-MS/MS analysis.
Determination of LTA
An Acquity UPLC system equipped with an ultrahigh pressure pump system, an autosampler, and a temperature-controlled vial tray (Waters, Milford) was used for chromatographic separation. The mobile phase comprised 0.1% (v/v) formic acid aqueous solution and 0.1% (v/v) formic acid acetonitrile solution (0.45:0.55, v/v). The flow rate was 0.3 mL/min (isocratic elution), and the injection volume was 10 μL. A reversed-phase chromatographic column (Xterra MS, C18, 3.5 μm, 2.1 × 100 mm; Waters) was used for chromatographic separation at 40°C, and the temperature of the sample chamber was set to 4°C.
A Xevo TQ tandem quadrupole mass spectrometer (MS/MS) equipped with a ZSpray™ electrospray (ES) ionization source (Waters) was used for mass spectral detection. The source was operated in positive (ES+) mode, and the capillary voltage was maintained at 3.0 kV. Ultrapure liquid nitrogen was used to supply the desolvation gas with a flow rate of 1,000 L/h, and the desolvation temperature was set to 500°C. The cone voltage was maintained at 12.0 V. The collision energy was set at 12.0 V, and argon was used as the collision gas at a flow rate of 0.15 mL/min. The detection and quantification of the analytes were performed using multiple reaction monitoring mode with mass transitions of 391.40/337.30 m/z for LTA and 395.06/341.09 m/z for LTA-d4. The data were acquired using MassLynx Version 4.1 mass spectrometry software (Waters).
To determine the LTA concentration in the rabbit aqueous humor, the detection method was validated for specificity, sensitivity, linearity, recovery, matrix effect, precision, accuracy, stability, and dilution integrity before animal treatment. The working standard curve was created by spiked aqueous humor samples at 6 different concentration levels, covering a range from 0.9 to 64.8 ng/mL. The calibration equation was established by plotting the peak area ratio of LTA to IS versus the LTA concentration. The lower limit of detection (LLOD) of LTA in the rabbit aqueous humor was 0.2 ng/mL. The LTA concentration was determined by the established IS quantitative method based on the peak area ratio of LTA to IS.
Data processing
The pharmacokinetic parameters of LTA in rabbit aqueous humor were calculated using DAS software Ver. 2.1.1 (Shanghai BioGuider Medicinal Technology Co., Ltd., Shanghai, China). Statistical analysis was performed using SPSS Statistics Ver. 17.0.0 (IBM, Armonk, NY). The drug concentrations of different groups were compared with independent sample t-tests (2 sides). The difference between them was determined to be significant when the P value was less than 0.05.
Results
Determination method validation
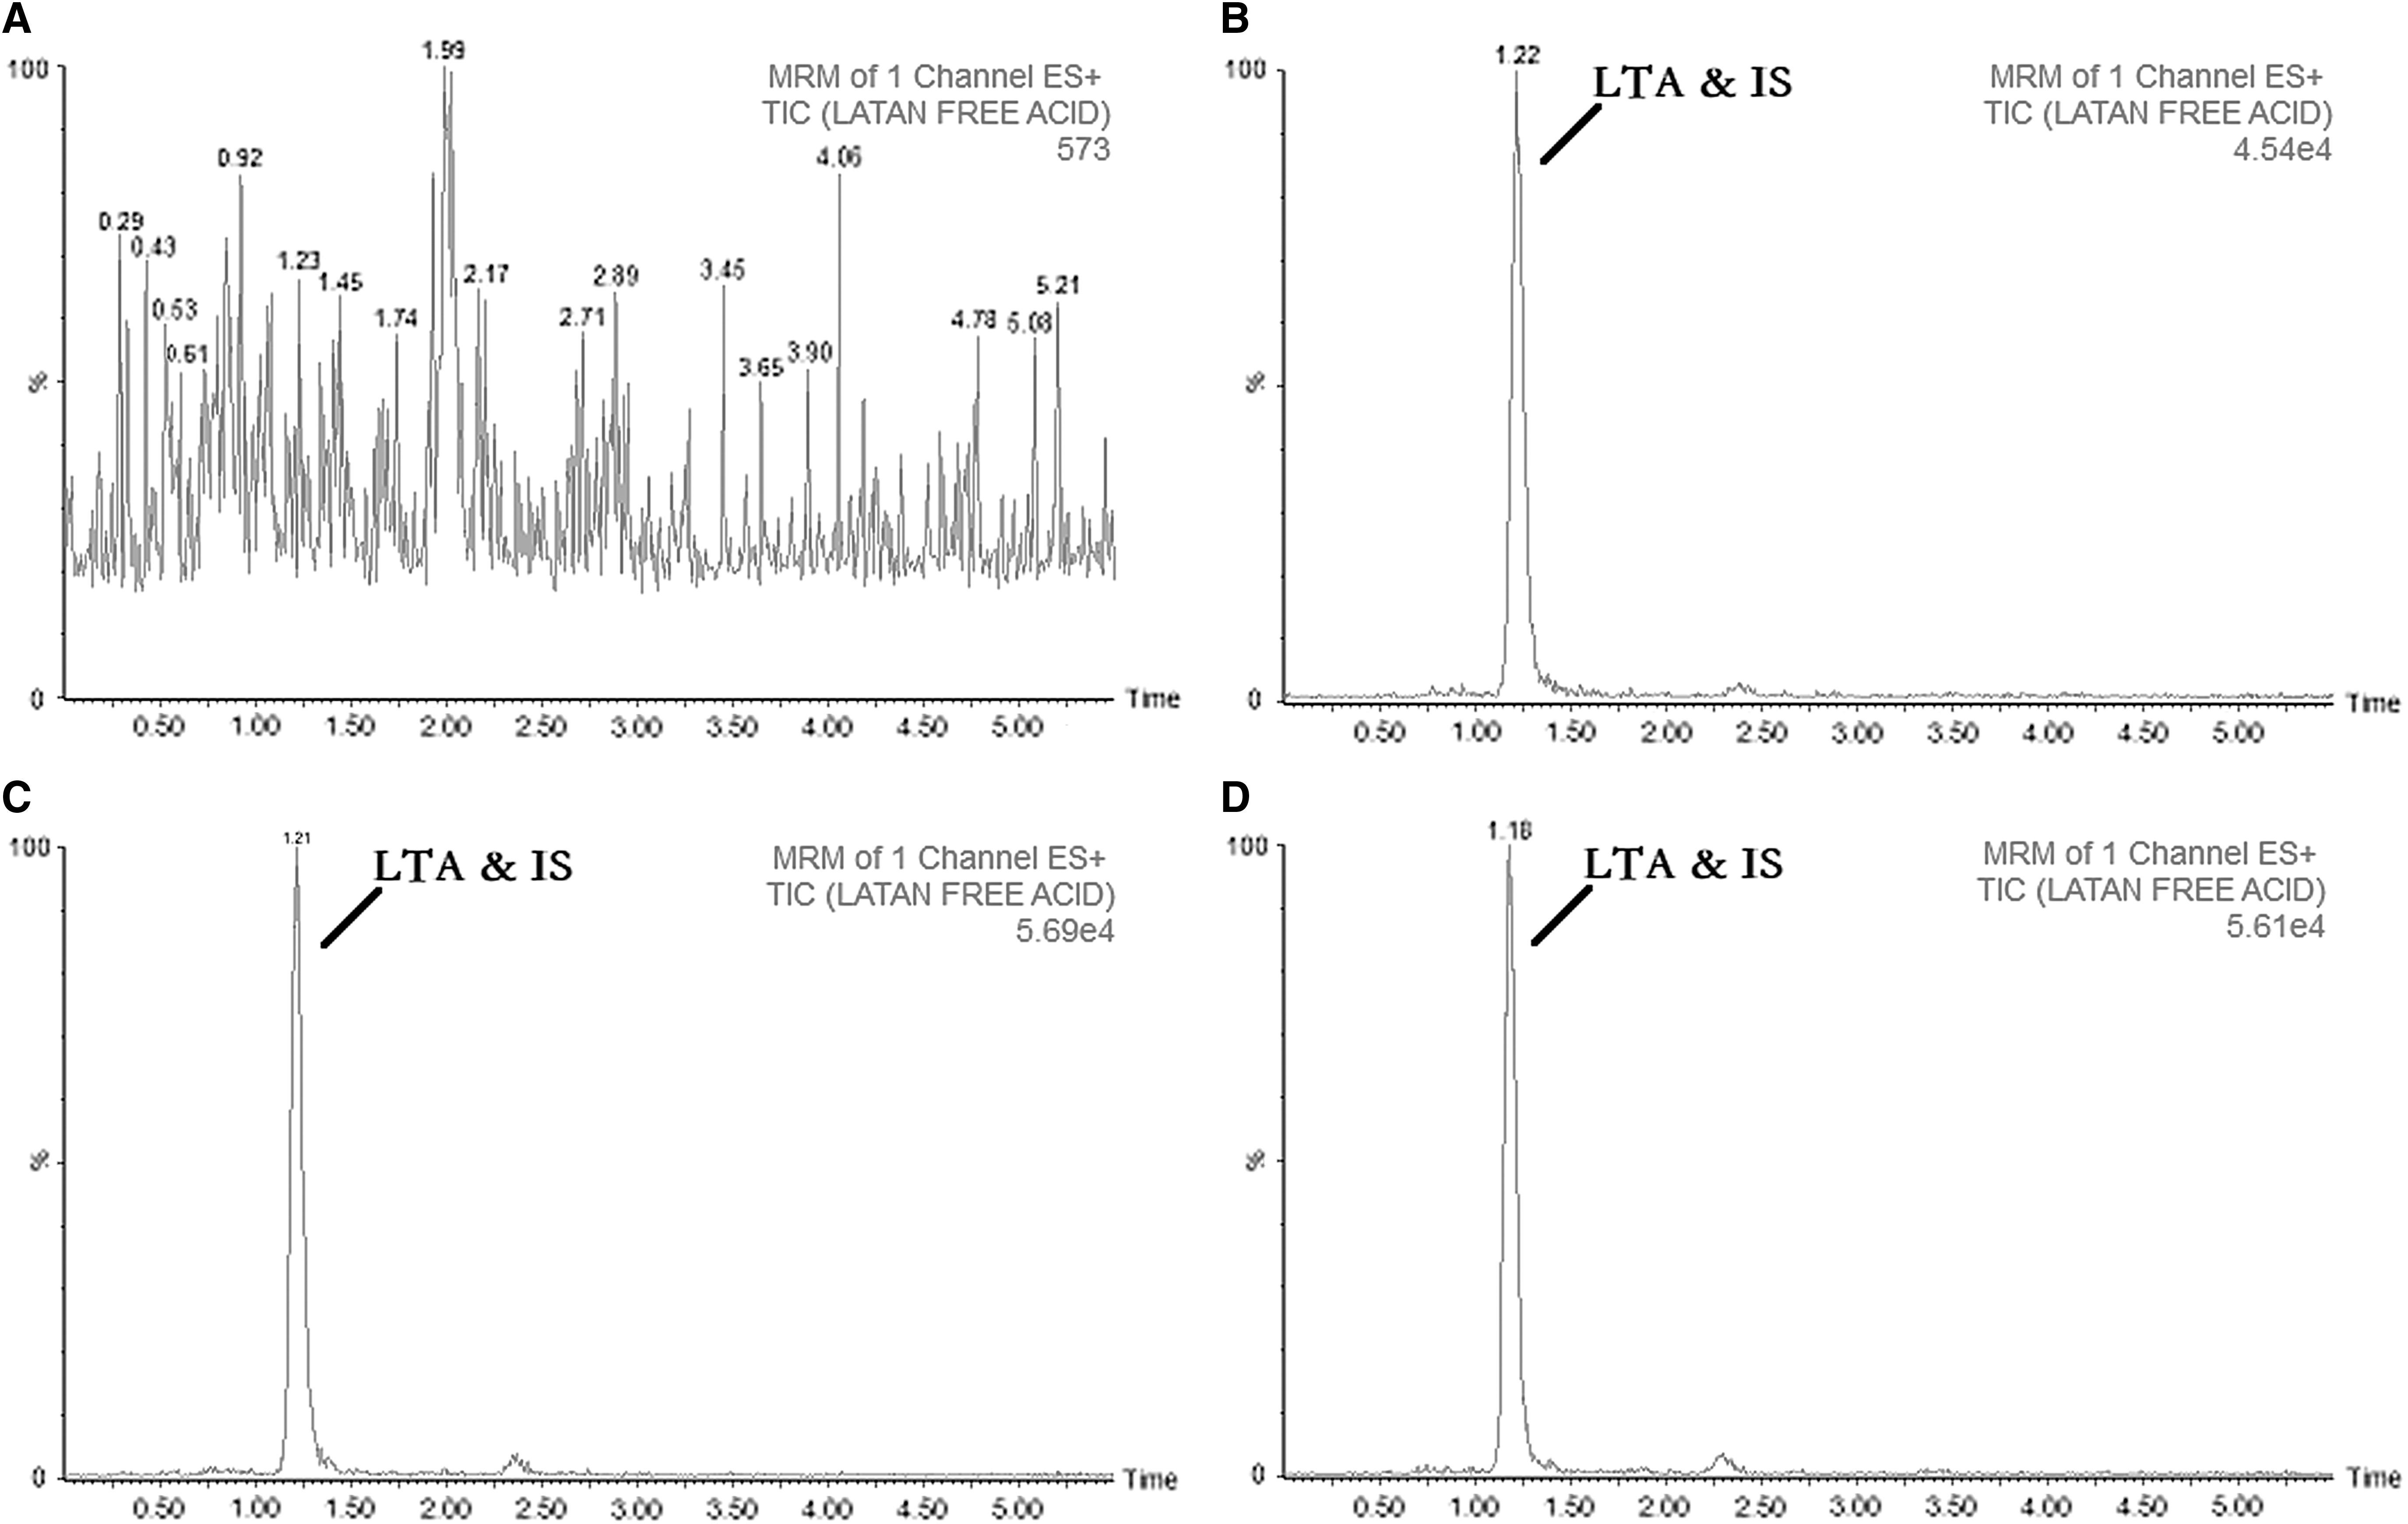
The LTA and IS (deuterium-labeled LTA) cannot be separated by a conventional chromatographic method because they have the same chemical constitution and structure. However, they can be distinguished easily by the MS/MS detector because of their different mass numbers. Typical total ion current chromatograms of blank aqueous humor samples, spiked standard samples, and pharmacokinetic samples are shown in Fig. 1.
TIC UPLC-MS/MS chromatograms of blank aqueous humor sample
The retention times of LTA and the IS were 1.2 min under the chromatographic conditions of this study. Chromatograms of the blank rabbit aqueous humor lacked coeluting interferent peaks with LTA and IS at the respective retention time. The signal intensity of blank aqueous humor (573) was far lower than those of spiked sample of LTA and IS (4.54 × 10⁴) at a medium concentration level (10.8 and 10 ng/mL, respectively). There was a good linear relationship between the peak area ratio of LTA to IS versus the concentration of LTA in the range of 0.9–64.8 ng/mL (r 2 = 0.9997, weighting factor: 1/x0). The intraday precision and accuracy of the different concentration levels ranged from 6.5% to 8.3% (CV%, n = 5) and from 91.7% to 114.9% (Re%, n = 5), respectively. The interday precision and accuracy ranged from 1.9% to 8.3% (CV%, n = 15) and from 97.9% to 102.9% (Re%, n = 15), respectively.
Pharmacokinetics of LTA in rabbit aqueous humor
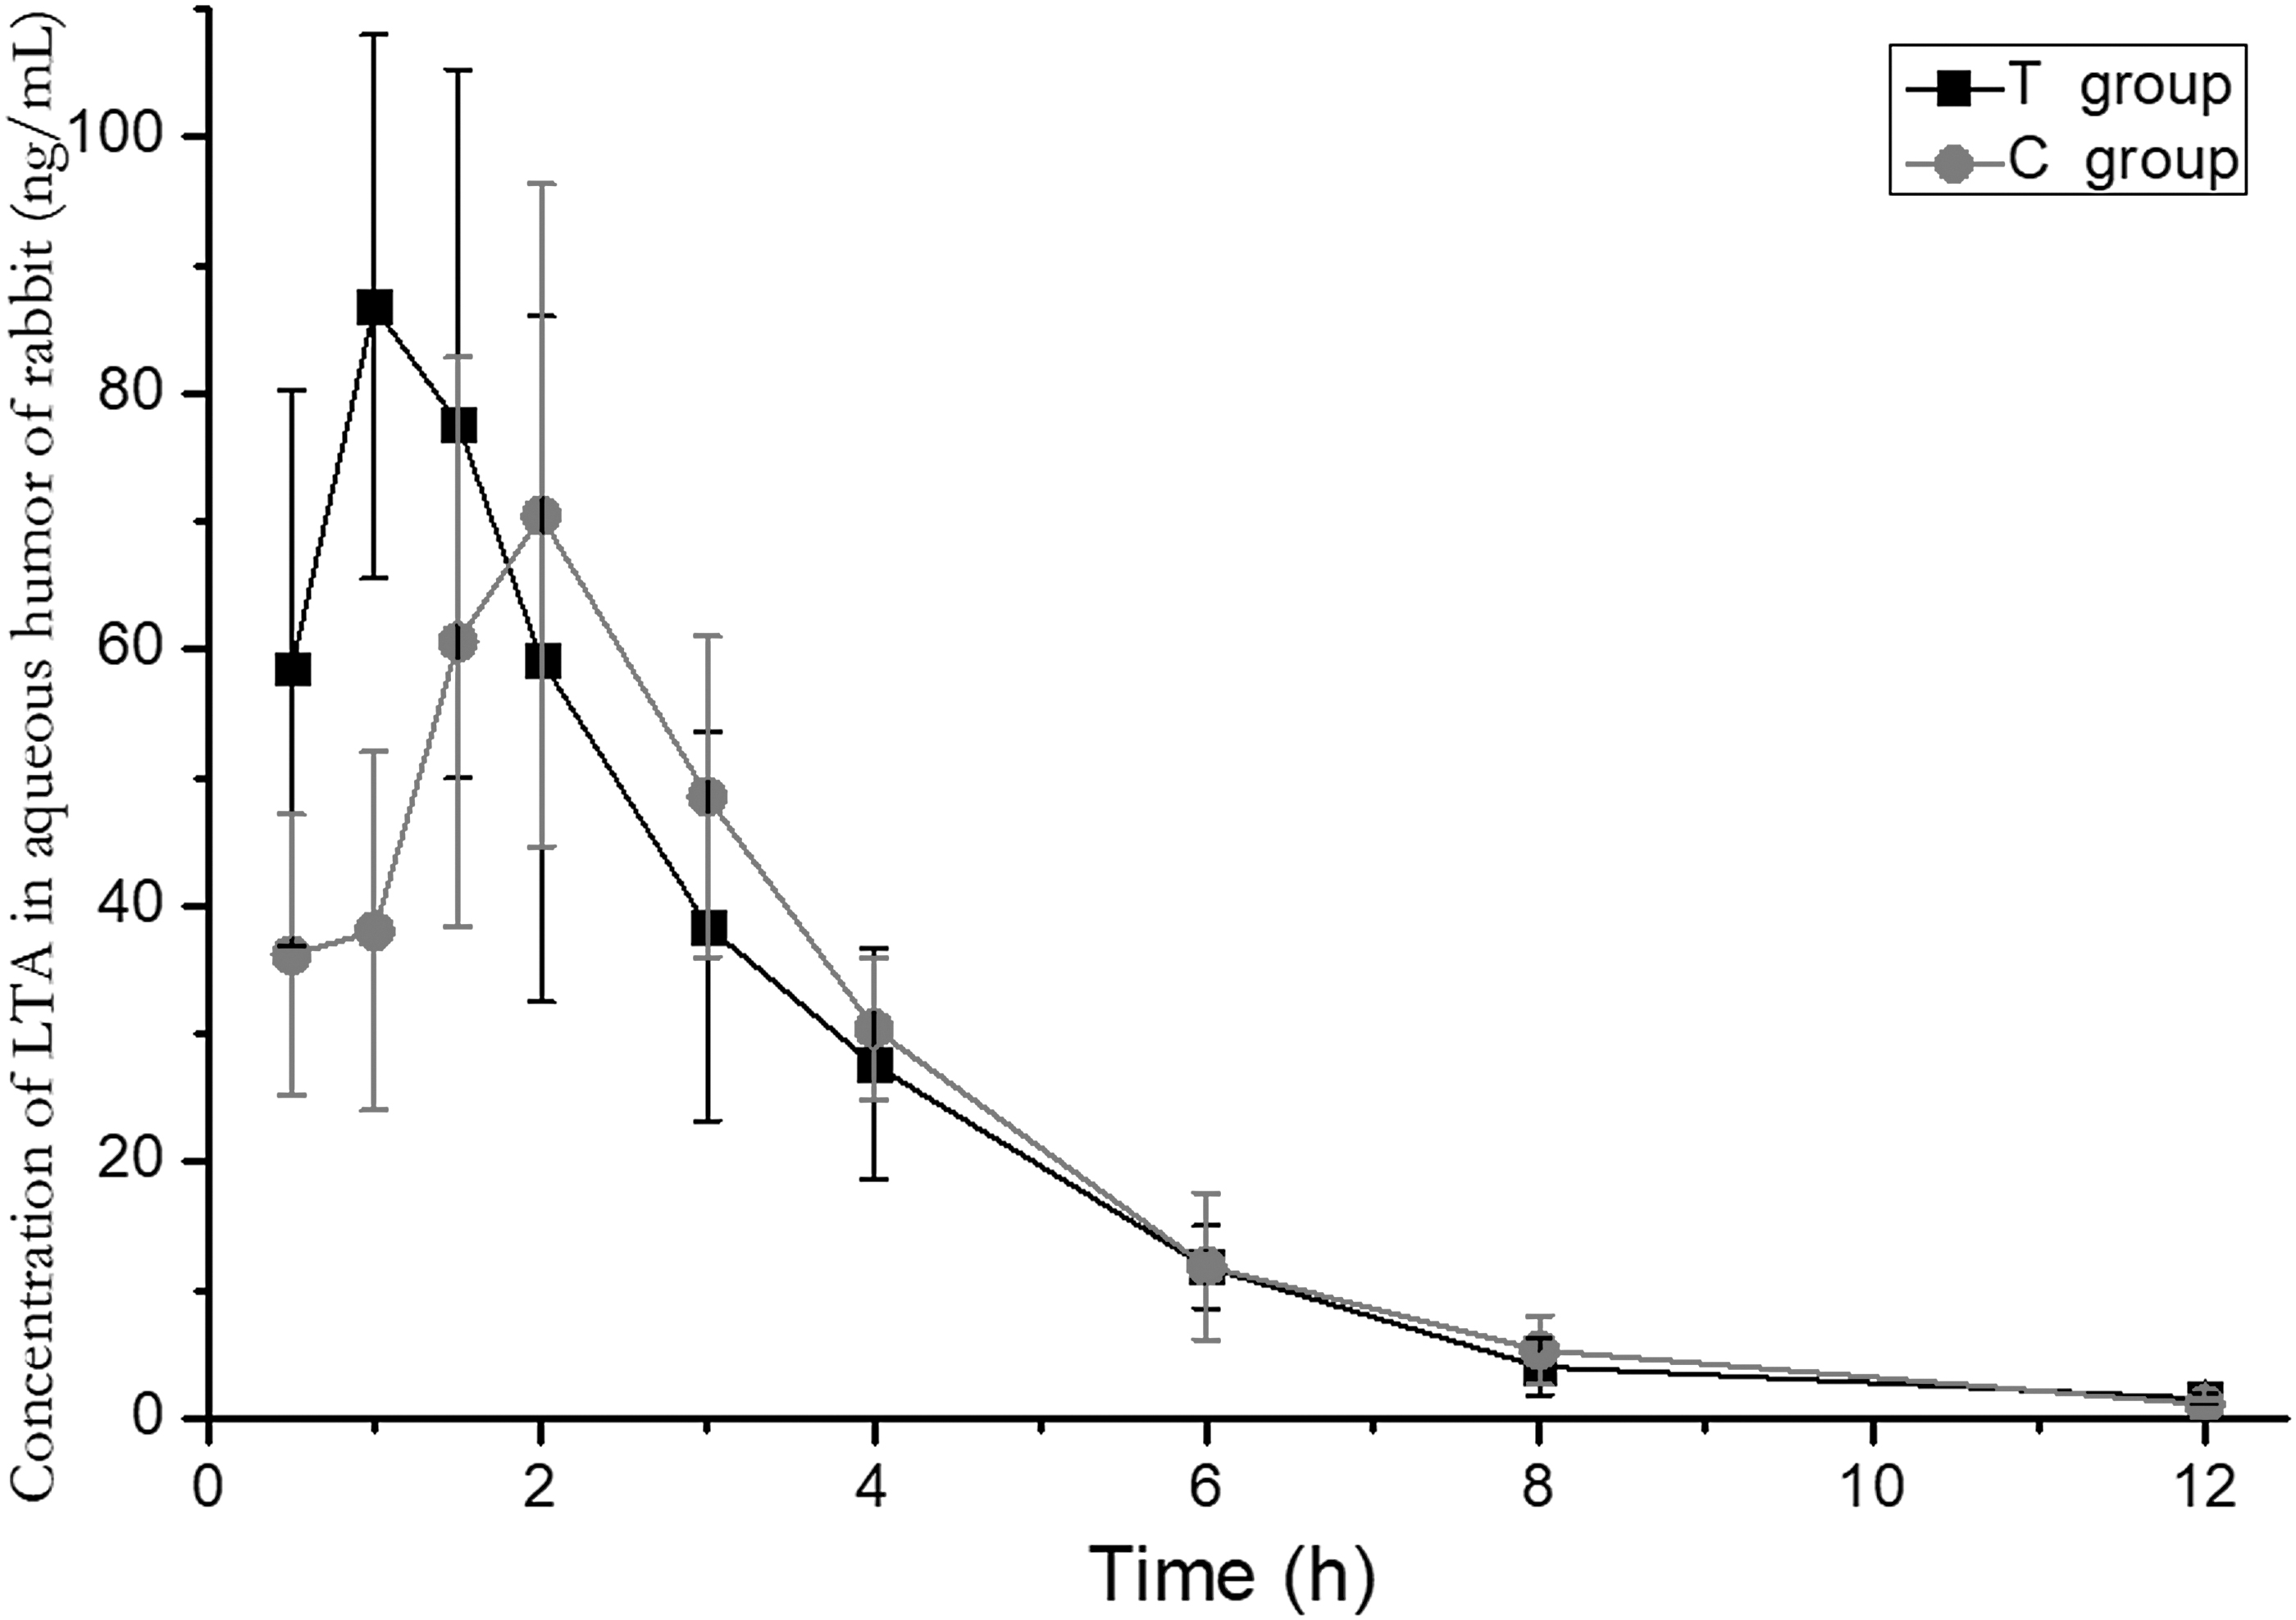
The concentration-time profile of LTA in the rabbit aqueous humor after a single-dose instillation is shown in Fig. 2 and Table 1. Twenty-four hours after dosing, the concentrations of LTA in the aqueous humor of the rabbits in the 2 groups were both below the measurable level. The peak concentration (Cmax) of LTA in the aqueous humor occurred 2 h after dosing for the T group (69.0 ± 23.4 ng/mL) and 1.5 h after dosing for the C group (73.8 ± 28.7 ng/mL). There was no significant difference in the Cmax of LTA between the 2 groups (t-test, P > 0.05).

The concentration-time curve of LTA in rabbit aqueous humor after single dosing (n = 6).
Concentration of Latanoprost Free Acid in Rabbit Aqueous Humor After Single Dosing (n = 6)
Cmax of LTA.
Under lower limit of quantitation.
LTA, latanoprost free acid; SD, standard deviation.
The concentration-time profile of LTA in the rabbit aqueous humor after multiple instillations is shown in Fig. 3 and Table 2. Twenty-four hours after the last dosing, the concentrations of LTA in the aqueous humor of the rabbits in the 2 groups were both below the measurable level. The Cmax of LTA in aqueous humor occurred 1 h after dosing for the T group (86.8 ± 21.2 ng/mL) and 2 h after dosing for the C group (70.5 ± 25.9 ng/mL). There was no significant difference in the Cmax of LTA between the 2 groups (t-test, P > 0.05). There was also no significant difference in the Cmax of LTA between the multidose groups and the single-dose groups (t-test, P > 0.05).
The concentration-time curve of LTA in rabbit aqueous humor after multidosing (n = 6).
Concentration of Latanoprost Free Acid in Rabbit Aqueous Humor After Multiple Dosing (n = 6)
Cmax of LTA.
Under lower limit of quantitation.
The main pharmacokinetic parameters of LTA in the rabbit aqueous humor are shown in Table 3. All of the different treatment groups had similar pharmacokinetic parameters in this study.
Pharmacokinetic Parameters of Latanoprost Free Acid in Rabbit Aqueous Humor
AUC(0–12h), area under the curve values over 12 h.
Discussion
Latanoprost, which can be hydrolyzed completely before permeating into the aqueous humor, is a degradable prodrug of LTA. We also found that the concentration level of latanoprost in the aqueous humor 15 min, 45 min, and 2 h after dosing was under the measurable level. Therefore, the active metabolite LTA was set as the only target analyte for ocular pharmacokinetic research on latanoprost in this study. A simplified sample processing method was performed for extracting LTA from the rabbit aqueous humor. This method used aqueous humor samples with a larger volume and dissolved the dried extracted residual with less solvent before mass spectrometry detection compared with those of a previous method. 16 It also involved fewer processing steps and fewer reagents. LTA could be extracted easily and efficiently with this robust method. Much higher sensitivity (LLOD, 0.2 ng/mL) was also obtained with this method.
However, whether BAK can enhance the penetration of active agents into the anterior chamber is still controversial. 8 That is, there is no sufficient evidence for the promotion effect of BAK on ocular absorption of PGAs. Sekine et al. 16 found that the available latanoprost solutions with different preservatives and without preservatives all showed sufficient intraocular concentrations for activating the prostanoid FP receptor, and there were no statistically significant differences between the mean aqueous humor concentration of LTA at 3 h postdose (peak level). Sekine et al. concluded that the pharmacokinetic profiles of the studied latanoprost solutions may depend on the pharmacological characteristics of latanoprost itself rather than the minimum effect of different preservatives on drug penetration.
In this study, the Cmax and t1/2 of LTA in the rabbit aqueous humor after a single instillation of BAK-preserved eye drops were very close to those of the other 3 groups. This indicates that the BAK in the eye drops lacked a marked promoting effect on corneal permeation after a single instillation or administration once a day for 1 week. In other words, the corneal permeation of latanoprost in the preservative-free preparation in this study was not obviously reduced due to the absence of BAK. Moreover, the toxic effects of BAK are dose and time dependent. It is difficult to eliminate BAK from the corneal and conjunctival tissues after topical instillation. It was suggested that glaucoma patients should avoid long-term exposure to BAK. 8 Thus, preservative-free latanoprost unit-dose preparation should be an ideal alternative for improving the medical prognosis of glaucoma treatment.
The ocular pharmacokinetics study has its own particularity and limitations. Rabbits are usually used for ocular pharmacokinetics studies. Because the volume of aqueous humor was very small, it is difficult to collect aqueous humor samples continuously from 1 rabbit eye at different time points. One rabbit eye can only be sampled once and offer 1 aqueous humor sample during the whole study. It means that the pharmacokinetic parameters of Cmax, Tmax, t1/2, and area under the curve values over 12 h [AUC(0–12h)] of LTA in aqueous humor cannot be obtained from a single eye. The Tmax came from the time point that had the peak average drug concentration (Cmax). The t1/2 and AUC(0–12h) were both calculated from the average drug concentrations at each time point. Among these parameters, the Tmax, t1/2, and AUC(0–12h) of the 2 drugs cannot be compared with a statistical method because they were not mean values.
The LTA concentration level was greatly affected by the individual differences in ocular drug absorption and metabolism of rabbits. In addition, the drug concentration fluctuation was further amplified by the unconventional sampling method. Therefore, the standard deviations of the aqueous humor drug concentration were relatively large (Figs. 2 and 3) in this study. There was no significant difference between the Cmax of the 2 drugs after single or multiple instillations (t-test, P > 0.05), although they looked quite different. Undoubtedly, the fluctuant drug concentrations would lead to the fluctuation of other pharmacokinetic parameters.
The Tmax of LTA in the T group (2 h) was later than in the C group (1.5 h) after a single dose. Conversely, the Tmax of LTA in the T group (1 h) was earlier than in the C group (2 h) after multiple instillations. However, the Tmax values of them are close to each other and they cannot be compared with a statistical method. In consideration of the limitation of the unconventional sampling method, the individual differences of animals and the long dosing interval of latanoprost eye drops (once daily) in pharmacotherapy of glaucoma, and the small differences between the Tmax of 2 drugs should be considered normal fluctuations and are within an acceptable range.
In conclusion, the newly developed preservative-free 0.005% latanoprost unit-dose eye drops demonstrated similar pharmacokinetic properties to the BAK-preserved 0.005% latanoprost branded product following topical application to rabbits.
Footnotes
Acknowledgment
The authors are thankful to Mr. Zhang Junxia of Henan Provincial Institute of Food and Drug Control for his assistance in the animal feeding.
Author Disclosure Statement
No competing financial interests exist.
Funding Information
This study was sponsored by China Otsuka Pharmaceutical Co. Ltd., Tianjin, China.