




Abstract
Purpose:
To investigate the efficacy and safety of pulsed ultrasound (PUS) in enhancing fluorescein sodium (NaF) transport to the rabbit eye through the transscleral and transconjunctival routes in vivo.
Methods:
PUS and NaF were applied onto the supratemporal sclera/conjunctiva of healthy rabbit eyes. PUS (1 MHz, 2.37 W/cm2, 30% duty cycle, 5-min application time) was performed 3 times with a 5-min interval. In the same process, NaF was administered to the eye without PUS in the control. NaF concentrations in the vitreous and retina–choroid were determined by fluorescence measurement. The safety of PUS application was assessed based on temperature and intraocular pressure measurements, clinical observations, electroretinography, histology, and Terminal Deoxynucleotidyl Transferase dUTP Nick End Labeling assay.
Results:
In comparison to the control, higher NaF concentrations were found in the retina–choroid following transscleral (2.45-fold) and transconjunctival (2.97-fold) PUS applications (P < 0.05). NaF concentrations in the vitreous were 3.15 and 5.86 times greater in transscleral and transconjunctival PUS applications, respectively, compared with those obtained without PUS application (P < 0.05), and NaF level in the vitreous after transconjunctival PUS application was 2.61 times that of transscleral PUS application (P < 0.05). Ocular findings were transient and mild conjunctival injection, with no other structural and functional changes in PUS-treated eyes.
Conclusions:
PUS treatment can improve transscleral and transconjunctival delivery of NaF efficiently and safely. Transscleral and transconjunctival PUS applications offer potential clinical benefit in increasing drug penetration to the posterior segments of the eye for the noninvasive treatment of ocular diseases.
Introduction
Posterior eye segment diseases, such as age-related macular degeneration, diabetic retinopathy, and uveitis are leading causes of irreversible vision impairment.1–3 Various drugs, including antivascular endothelial growth factor agents and corticosteroids are efficient for the treatment.4,5 Unfortunately, drug delivery strategies remain a challenge due to the posterior location of the diseases, and the static and dynamic barriers of the eye. 6 Conventional methods such as topical eye drops and systemic administrations are correlated with limited bioavailability (<5%) and systemic side-effects, respectively, in the treatment of posterior eye segment diseases. 7
Currently, intravitreal and periocular injection of drugs is the mainstream method for delivering drugs to the back of the eye.8,9 However, the chronic and progressive nature of posterior eye segment diseases requires frequent injections, which are inconvenient, painful, and invasive, with potential risks of vitreous hemorrhage, retinal detachment, cataract formation, and endophthalmitis. 10 Repeated injections also impose a heavy financial and psychological burden on patients. 11 Therefore, a noninvasive and effective delivery method is critically needed.
Several strategies have been developed to facilitate the drug delivery to the posterior eye segment less invasively, such as iontophoresis, microneedles, photodynamic enhancing, and ultrasound, especially through the transscleral/transconjunctival route due to the large surface area, relatively high permeability, and the short diffusion pathway to the target tissue.12,13 Ultrasound is a widely used diagnostic and therapeutic tool in clinical practice, which has recently gained interest as its ability to promote drug delivery to cells and tissues. 14 Ultrasound is hypothesized to work by perturbing the structure of cells and tissues and increasing their permeability to facilitate drug delivery temporarily.15,16 Researchers reported increases in drug penetration into rabbit sclera by continuous ultrasound ex vivo.17–23 There is only one in vivo study that demonstrated transscleral drug delivery enhancement promoted by continuous ultrasound. 24 Moreover, the application of continuous ultrasound could be accompanied by thermal damage to ocular tissues.21,22
This issue could be avoided by applying ultrasound in pulsed mode rather than continuous mode since a previous study has proved ultrasound in pulsed mode led to a lower temperature increase than the continuous mode. 25 Although continuous ultrasound was considered to be effective in transscleral drug delivery, it is yet unknown whether pulsed ultrasound (PUS) achieves the same results. To our knowledge, no study has investigated the feasibility of PUS in enhancing drug delivery through transscleral route in vivo. Additionally, transscleral drug delivery may damage the eye when exposing the sclera, which may be circumvented when administered transconjunctivally. Very few studies so far in the literature have focused on ultrasound-mediated drug delivery through the transconjunctival route. 26
The purpose of this study was to investigate whether PUS can enhance drug delivery to the back of the eye through transscleral and transconjunctival routes in vivo (Fig. 1), specifically the efficacy and safety of PUS application. Fluorescein sodium (NaF; 376 Da) was selected as the model drug owing to its similar molecular weight to that of the anti-inflammatory drug, dexamethasone (392 Da).
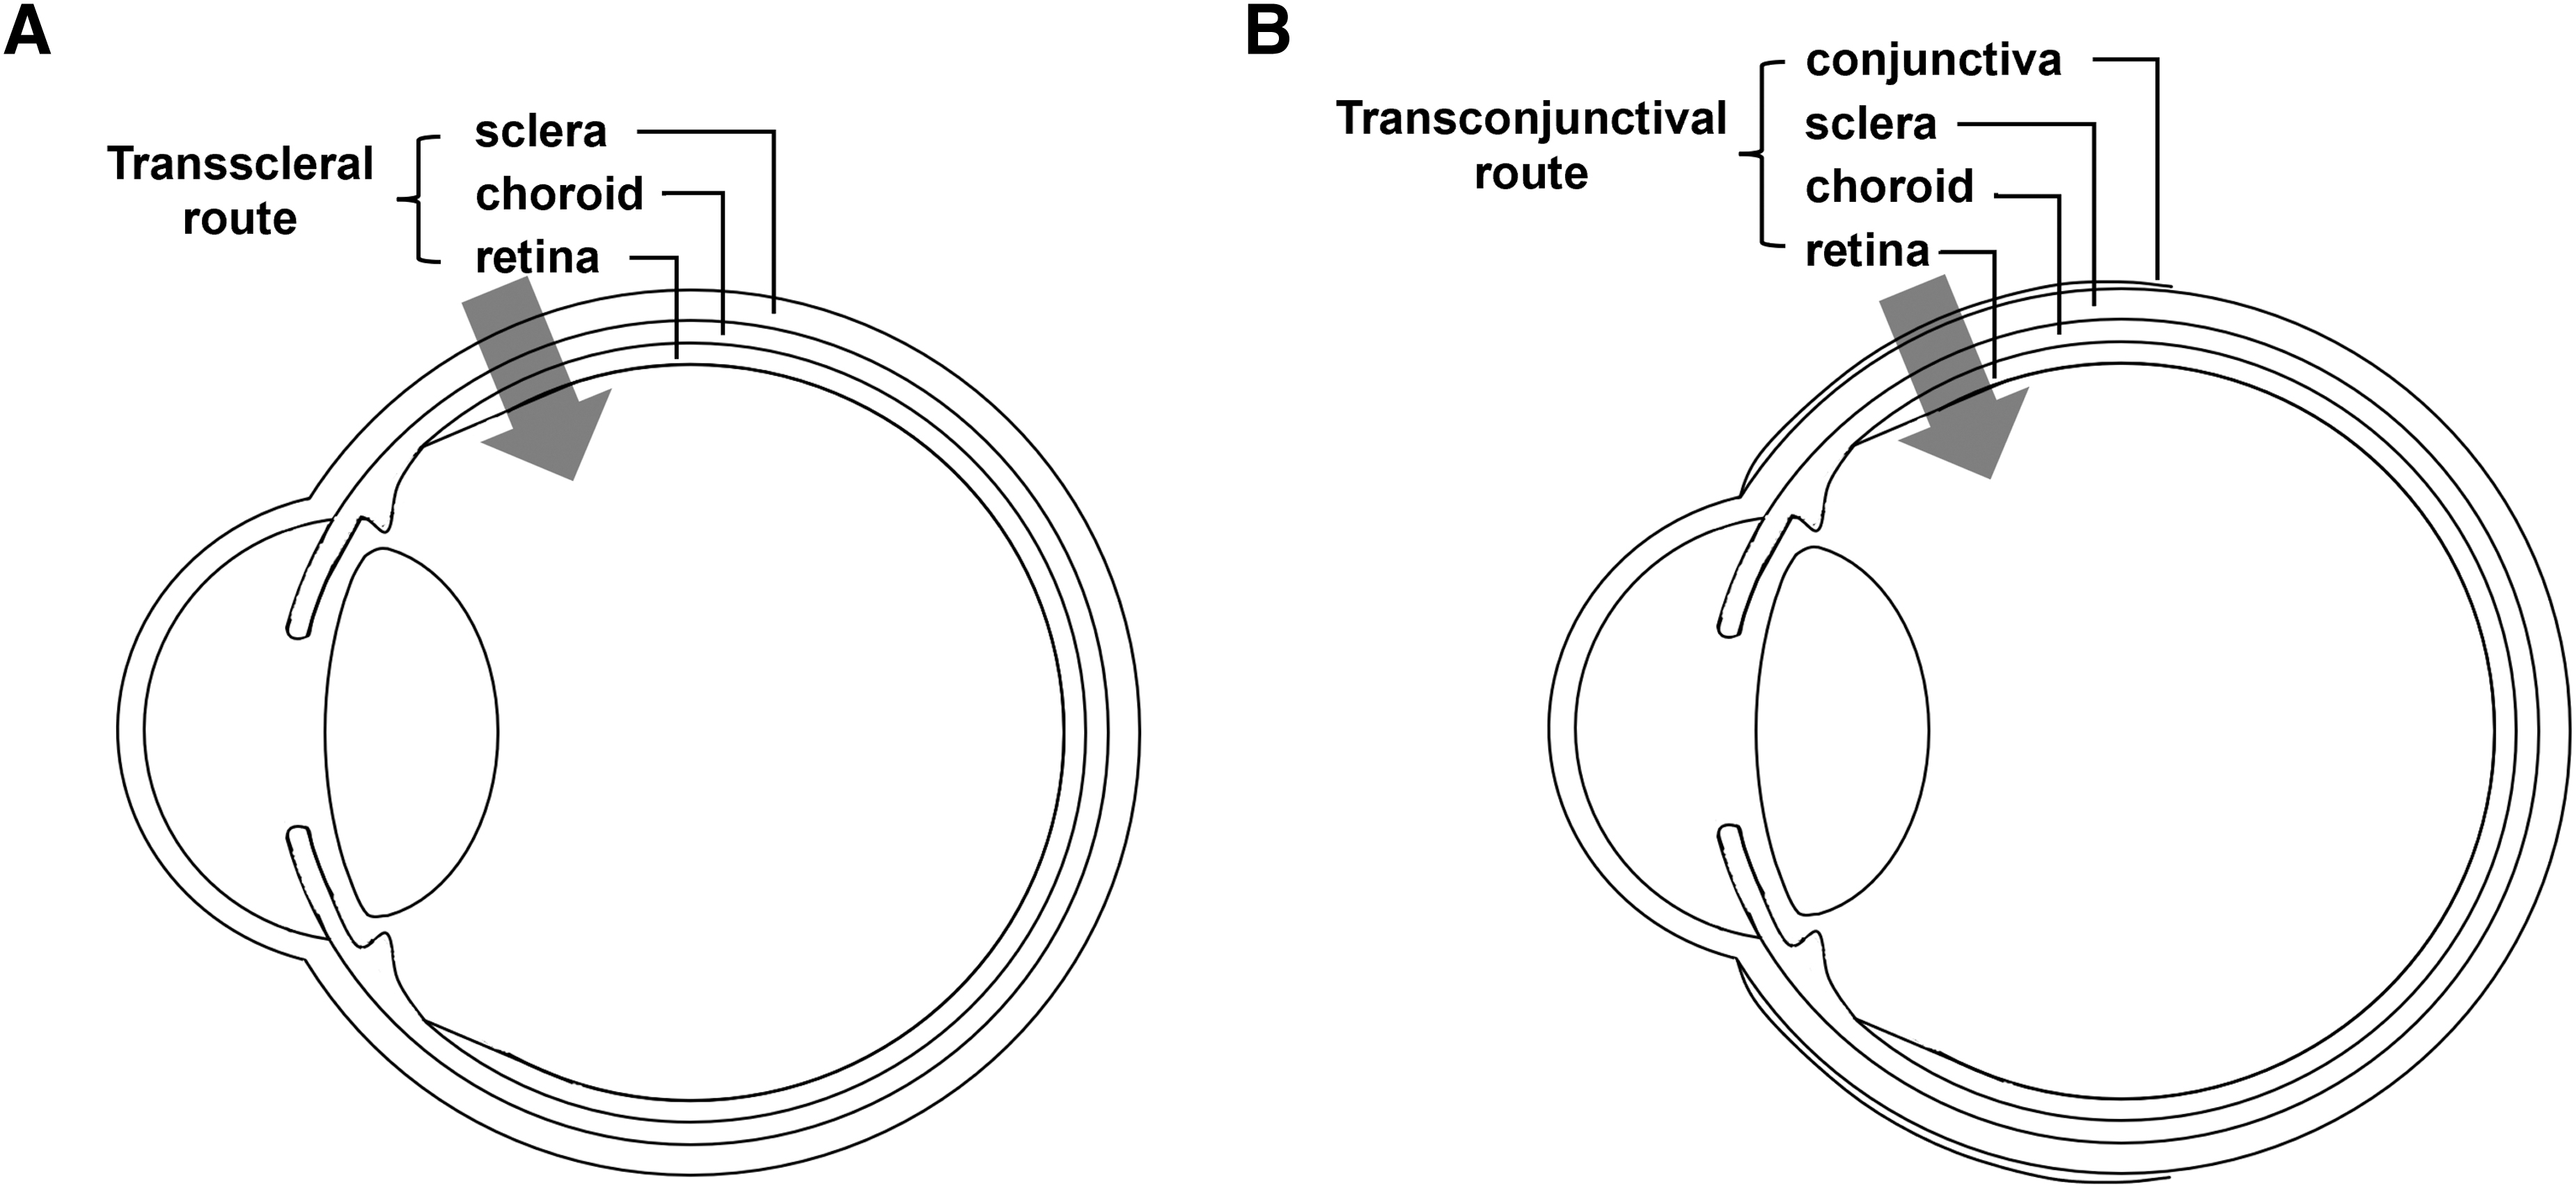
Schematic diagram of ocular drug delivery through transscleral
Methods
Materials
NaF (MW = 376 Da; Sigma-Aldrich Corp., St. Louis, MO, USA) was used as a model drug. NaF was dissolved in phosphate-buffered saline (PBS) solution to produce a final concentration of 1 mg/mL and was protected from light by using aluminum foil until fluorescence-related assays as described below.
Ultrasound device and its calibration
UT 1032 (Nu-Tek, Hong Kong, China), a portable ultrasonic physiotherapy device that provides ultrasonic energy with a frequency of 1 MHz and a radiation area of 8.548 cm2, was used in this study. The center frequency and the ultrasound intensity were calibrated according to GB/T 7965-2002 Chinese National Standard. Briefly, the measurements were in a water tank filled with degassed water, where the ultrasound device was set to produce a frequency of 1 MHz and a duty cycle (DC) of 30%, and was measured by a needle hydrophone (NH 0200 Hydrophone; Precision Acoustics, Dorchester, Dorset, UK) with a measured sensitivity (S) of 39 mV/MPa at 1 MHz. The hydrophone was connected to an oscilloscope (MSO5102; RIGOL, Beijing, China) and was placed 200 mm away from the ultrasound transducer probe. The center frequency and DC were confirmed to be 1 MHz and 30%, respectively. The ultrasound intensity (I, W/cm2) was calculated by the following equation:
where A is the effective radiating area (8.548 cm2) and Wa is the sound power (W), which is equal to:
where d is the distance between hydrophone and the effective sound center of the ultrasound transducer probe (0.2 m); ρ is the density of water (1,000 kg/m3); c is the sound velocity in the water (1,482 m/s); Rθ is the directivity factor of the transmitter, in which
where λ is the wavelength of the ultrasound wave (1.482 mm),
and pd is the effective sound pressure at d, in which
where p is the sound pressure at d, in which
where Vpp is the peak-to-peak voltage measured by hydrophone (60 mV), and S is the sensitivity of the hydrophone at 1 MHz (39 mV/MPa). The ultrasound intensity was calculated to be 2.37 W/cm2.
Animal studies
Healthy New Zealand white rabbits (2–3 kg, 4–6-month-old, male, clean grade, n = 84) were used in the study. The use of animals was approved by the Animal Research and Ethics Committees of the Eye and ENT Hospital of Fudan University in Shanghai, China. Rabbits were anesthetized by intramuscular injection of 10% xylazine hydrochloride (0.1 mL/kg) and intravenous injection of 1.5% sodium pentobarbital (1 mL/kg), and topically anesthetized with oxybuprocaine hydrochloride eye drops. Rabbit eyes underwent transscleral and transconjunctival drug delivery.
The supratemporal area of the eye (1.5 mm behind the limbus) was selected as the administration site owing to its large area and absence of extraocular muscle. An eyecup containing 2 mL of NaF solution was placed onto the conjunctiva (transconjunctival delivery), or onto the sclera after removing a piece of the conjunctiva (transscleral delivery). The administration area had a diameter of 7 mm (Fig. 2). The ultrasound transducer was positioned ∼10 mm above the surface of the sclera/conjunctiva and immersed in the NaF solution. The ultrasound at a frequency of 1 MHz, an intensity of 2.37 W/cm2, a DC of 30%, and a Pulse Repetition Frequency of 100 Hz (PUS) was applied for 5 min each time. The PUS was performed 3 times with an interval of 5 min, and then the sclera/conjunctiva was kept in contact with NaF solution for another 15 min. The sclera/conjunctiva in the control group was exposed to NaF solution for 40 min with no PUS application.

Schematic diagram of the administration site.
To assess the efficacy of transscleral/transconjunctival NaF delivery enhancement after PUS application, the rabbits were humanely sacrificed immediately after drug administration by an intravenous injection of a lethal dose of 2% pentobarbital. The vitreous and retina–choroid were carefully collected and weighed for the determination of NaF concentrations.
Fluorescence assay
The vitreous was homogenized and centrifuged at 4,500 rpm for 5 min at 4°C. The retina–choroid samples, mixed with 500 μL of PBS containing 2% Triton® X-100, were homogenized at 4°C and centrifuged at 5,000 rpm for 20 min at 4°C. Supernatants were collected and the NaF concentrations in vitreous and retina–choroid were determined through fluorescence using a fluorometer. Standard solutions were prepared by diluting NaF of known concentrations with blank supernatants and analyzed with a microplate reader (Tecan, Mannedorf, Switzerland) to make standard curves of fluorescence versus NaF concentrations. Wavelengths for excitation and emission for NaF were 460 and 515 nm, respectively.
Temperature measurement
To assess the temperature alterations of the eye caused by PUS application, the temperatures on the surface of the sclera (n = 6) and conjunctiva (n = 6) at the administration site were monitored using an infrared thermometer (KM-520; GAOMU, Shenzhen, China) before and after transscleral/transconjunctival PUS application. The time points of temperature measurements were before PUS application and immediately after the first, second, and third PUS application.
Intraocular pressure measurement
The intraocular pressure (IOP) of the PUS-treated eyes was measured with a Tonopen (Ametek, Reichert, PA, USA) before, as well as 1 day, 1 week, 2 weeks, 4 weeks, 6 weeks, 8 weeks, 10 weeks, and 16 weeks after PUS application (transscleral PUS application: n = 6, transconjunctival PUS application: n = 6).
Clinical observations
To evaluate clinical tolerance of PUS application, PUS was applied to rabbit eyes as described in “animal studies,” except that NaF solution was replaced by PBS. The anterior segment of PUS-treated eyes was observed with a slit lamp and captured before, as well as 1 day, 1 week, 2 weeks, 4 weeks, and 16 weeks after PUS application. The posterior segment of PUS-treated eyes was photographed using a retinal microscopic imaging system (RETIMERA 1.0 Camera; IIscience, San Jose, CA, USA) before, as well as 1 day, 1 week, and 2 weeks after PUS application (transscleral PUS application: n = 3, transconjunctival PUS application: n = 3).
Visual function evaluation
To evaluate the visual function of the PUS-treated eyes, the full-field electroretinogram (ff-ERG; Espion Console; Diagnosys, USA) was recorded before, as well as 1 day, 1 week, 2 weeks, and 4 weeks after PUS application (transscleral PUS application: n = 6, transconjunctival PUS application: n = 6). Full-field electroretinogram was performed according to the International Society for Clinical Electrophysiology of Vision standards. The rabbits were dark adapted for 1 h. Pupils were dilated by instillation of 1% tropicamide. Ground and reference electrodes were inserted into the dorsal subcutaneous and frontal top subcutaneous, respectively. ERG signals were captured by a unipolar corneal electrode (ERG-jet; Fabrinal, La Chaux-de-Fonds, Switzerland). The ERG responses were recorded using a Ganzfeld full-field stimulator with a background light intensity of 25 cd/m2 and a flash intensity of 3 cd/m2s, and the analysis time was 200 ms. Measurements were made of the a- and b-wave amplitudes of the maximal combined reaction.
The normalized amplitude, which was computed as follows: normalized amplitude = wave amplitude (1 day, 1 week, 2 weeks, 4 weeks post-PUS)/wave amplitude (pre-PUS), was used to assess the change in the a- and b-wave that came after the application of PUS.
Histological analysis
To evaluate the adverse effects of the PUS application on ocular tissues, the nontreated eyes (n = 3) and PUS-treated eyes were observed by light microscopy. One day, 1 week, and 2 weeks after PUS application (post-transscleral PUS application: n = 3 at each time point, post-transconjunctival PUS application: n = 3 at each time point), rabbits were humanely killed by an intravenous injection of a lethal dose of 2% pentobarbital. The PUS-treated eyes were enucleated and immersed in 4% paraformaldehyde to fix for 24 h. The eyes were further dehydrated in graded series of alcohol and chloroform, followed by paraffin embedding. Sections in 5 μm thickness around the administration area were cut using a microtome (RM2235; susu, Hesse, Germany), and stained with Hematoxylin and Eosin (H&E) for light microscopy (Leica Microsystems, Bensheim, Germany).
Terminal Deoxynucleotidyl Transferase dUTP Nick End Labeling assay
To assess the apoptosis of retinal ganglion cells (RGCs) after PUS application, the nontreated eyes and PUS-treated eyes were observed by Terminal Deoxynucleotidyl Transferase dUTP Nick End Labeling (TUNEL) assay. Paraffined tissue sections were obtained as described in “histological analysis” (nontreated eyes: n = 3, post-transscleral PUS application: n = 3 at each time point, post-transconjunctival PUS application: n = 3 at each time point). TUNEL reactions were carried out in accordance with the manufacturer's protocol using the In Situ Apoptosis Detection Kit (Calbiochem of Merk KGaA, Darmstadt, Germany) to detect RGC death. Cell nuclei were counterstained with DAPI (Sigma-Aldrich Corp.). The sections were then observed and photographed using a fluorescence microscope (Leica Microsystems) to find TUNEL-positive RGCs.
Data analysis
All results are presented as mean ± standard deviation. Statistical differences between experiments were determined by the Mann–Whitney test. Differences were considered statistically significant at a level of P < 0.05.
Results
Enhanced transscleral and transconjunctival delivery of NaF by PUS
Figure 3A showed that the NaF concentrations in the retina–choroid and vitreous delivered through the transscleral route in the presence of PUS application were 2.45 times (2.63 ± 0.13 μg/g) and 3.15 times (0.026 ± 0.008 μg/g), respectively, higher than those in the absence of PUS application, which were 1.07 ± 0.15 μg/g and 0.008 ± 0.005 μg/g, respectively (P < 0.05). Figure 3B revealed that transconjunctival PUS application resulted in a 2.97-fold (3.32 ± 1.36 μg/g) and 5.86-fold (0.068 ± 0.03 μg/g) increase in NaF concentrations in the retina–choroid and vitreous, respectively, compared with the control, which were 1.12 ± 0.44 μg/g and 0.012 ± 0.005 μg/g, respectively (P < 0.05). With the application of PUS, the NaF concentration in the vitreous delivered transconjunctivally was 2.61 times higher than that delivered transsclerally (P < 0.05), whereas the NaF concentrations in the retina–choroid delivered transsclerally and transconjunctivally were comparable (P > 0.05). NaF concentrations in the retina–choroid and vitreous did not significantly differ between transscleral and transconjunctival administration without PUS (P > 0.05).

The NaF concentrations in retina–choroid and vitreous delivered through transscleral
Temperature alterations
The average temperatures on the surface of the sclera and conjunctiva were 37.08 ± 0.60°C and 36.44 ± 1.38°C, respectively. After the first transscleral and transconjunctival PUS application, the temperatures on the sclera (37.56 ± 0.65°C) and conjunctiva (37.66 ± 0.63°C) were not significantly changed (P > 0.05). The temperatures after the second and third PUS application were significantly higher than those before PUS application, which were 38.28 ± 0.46°C and 38.54 ± 0.78°C, respectively, on the sclera and 38.08 ± 0.76°C and 37.93 ± 0.41°C, respectively, on the conjunctiva (P < 0.05) (Fig. 4A).
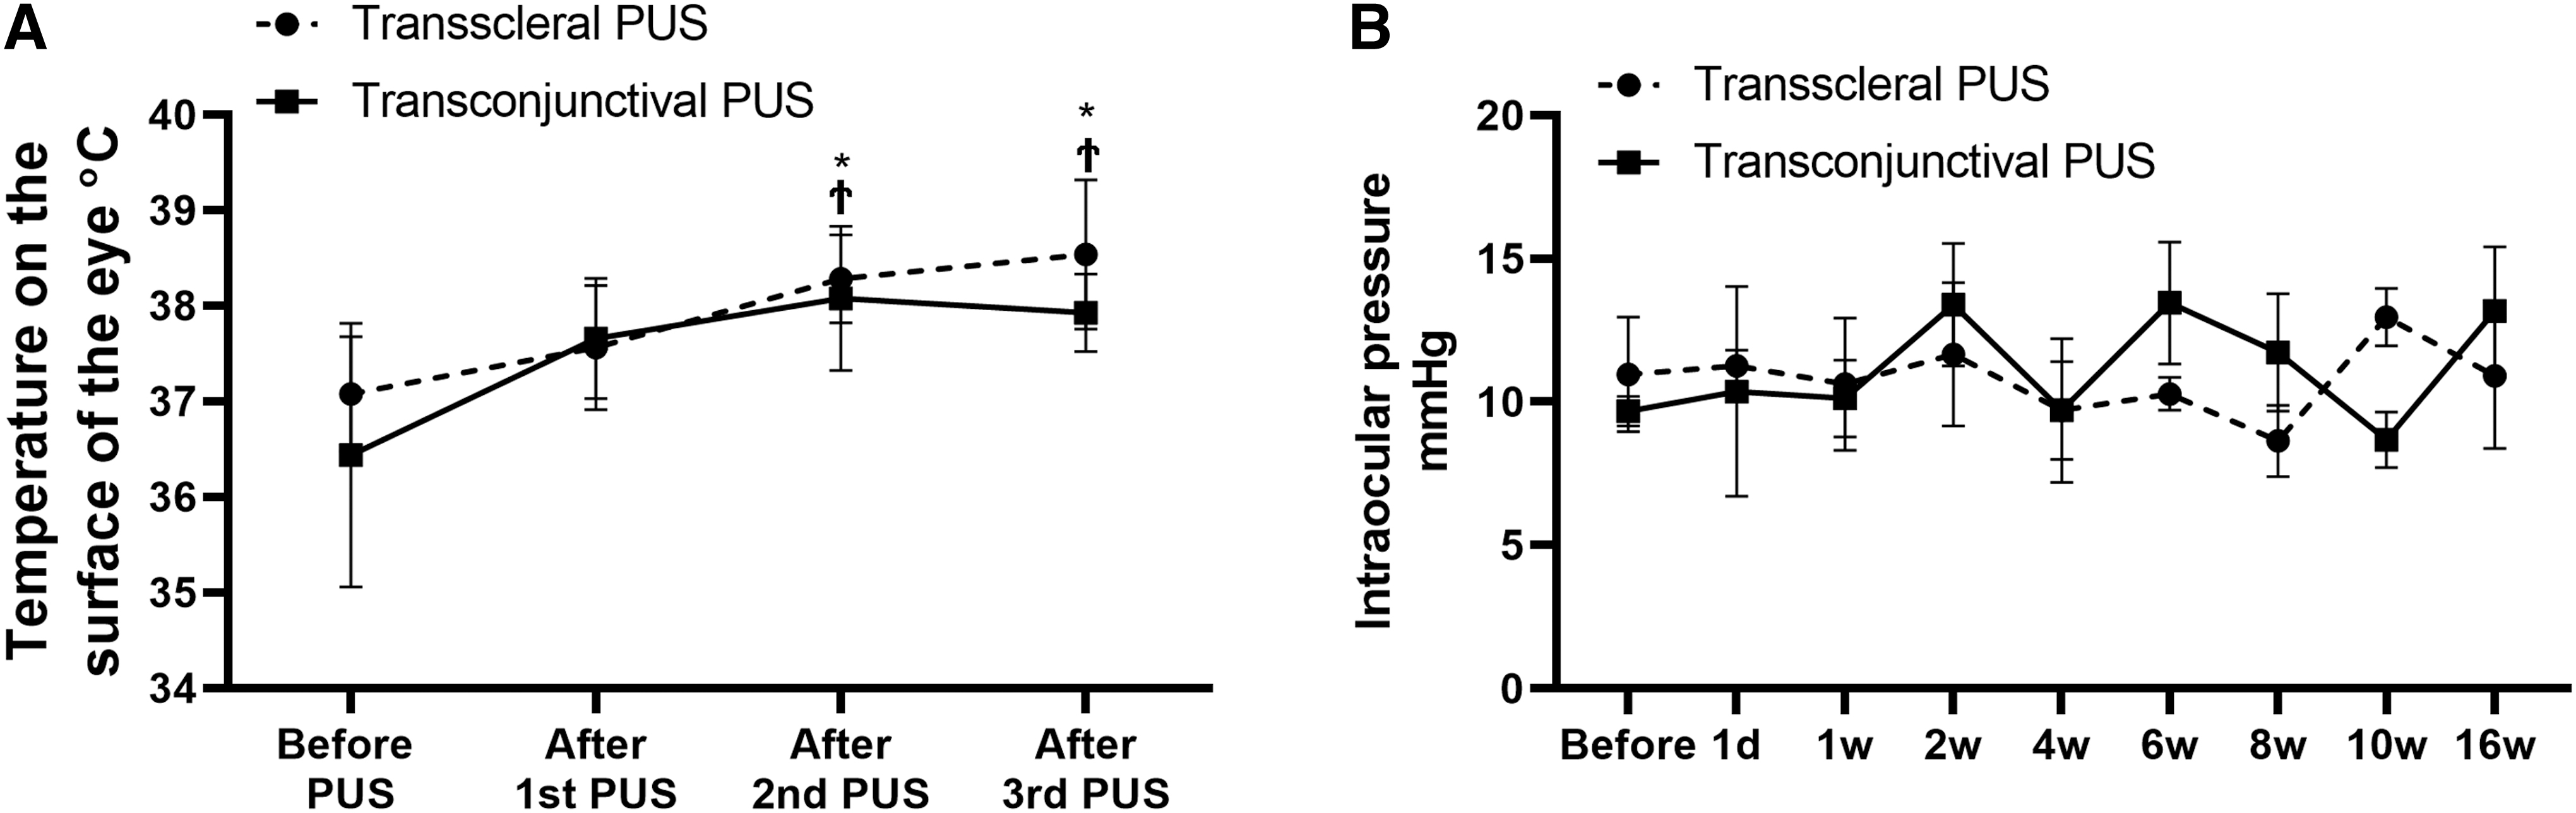
Intraocular pressure measurement
As shown in Figure 4B, the average IOP at the baseline were 10.95 ± 2.00 mmHg and 9.68 ± 0.52 mmHg in transscleral and transconjunctival groups, respectively. After PUS application, the IOP did not change significantly and remained in the normal level in the 4-month follow-up in both transscleral and transconjunctival groups (P > 0.05).
Clinical observations
Figure 5 showed representative photographs of the anterior and posterior segments of eyes before and after transscleral/transconjunctival PUS application. Slight conjunctival injection and chemosis were observed in the first week after transscleral (Fig. 5A) and transconjunctival (Fig. 5B) PUS applications, and the suture in the conjunctiva was visible in the first 2 weeks after transscleral PUS application (Fig. 5A). No obvious changes were found in the cornea, lens, and conjunctiva and sclera at the PUS application site (Fig. 5A, B). The optic nerve and retina–choroid around the PUS application area showed no structural alterations (Fig. 5C, D).
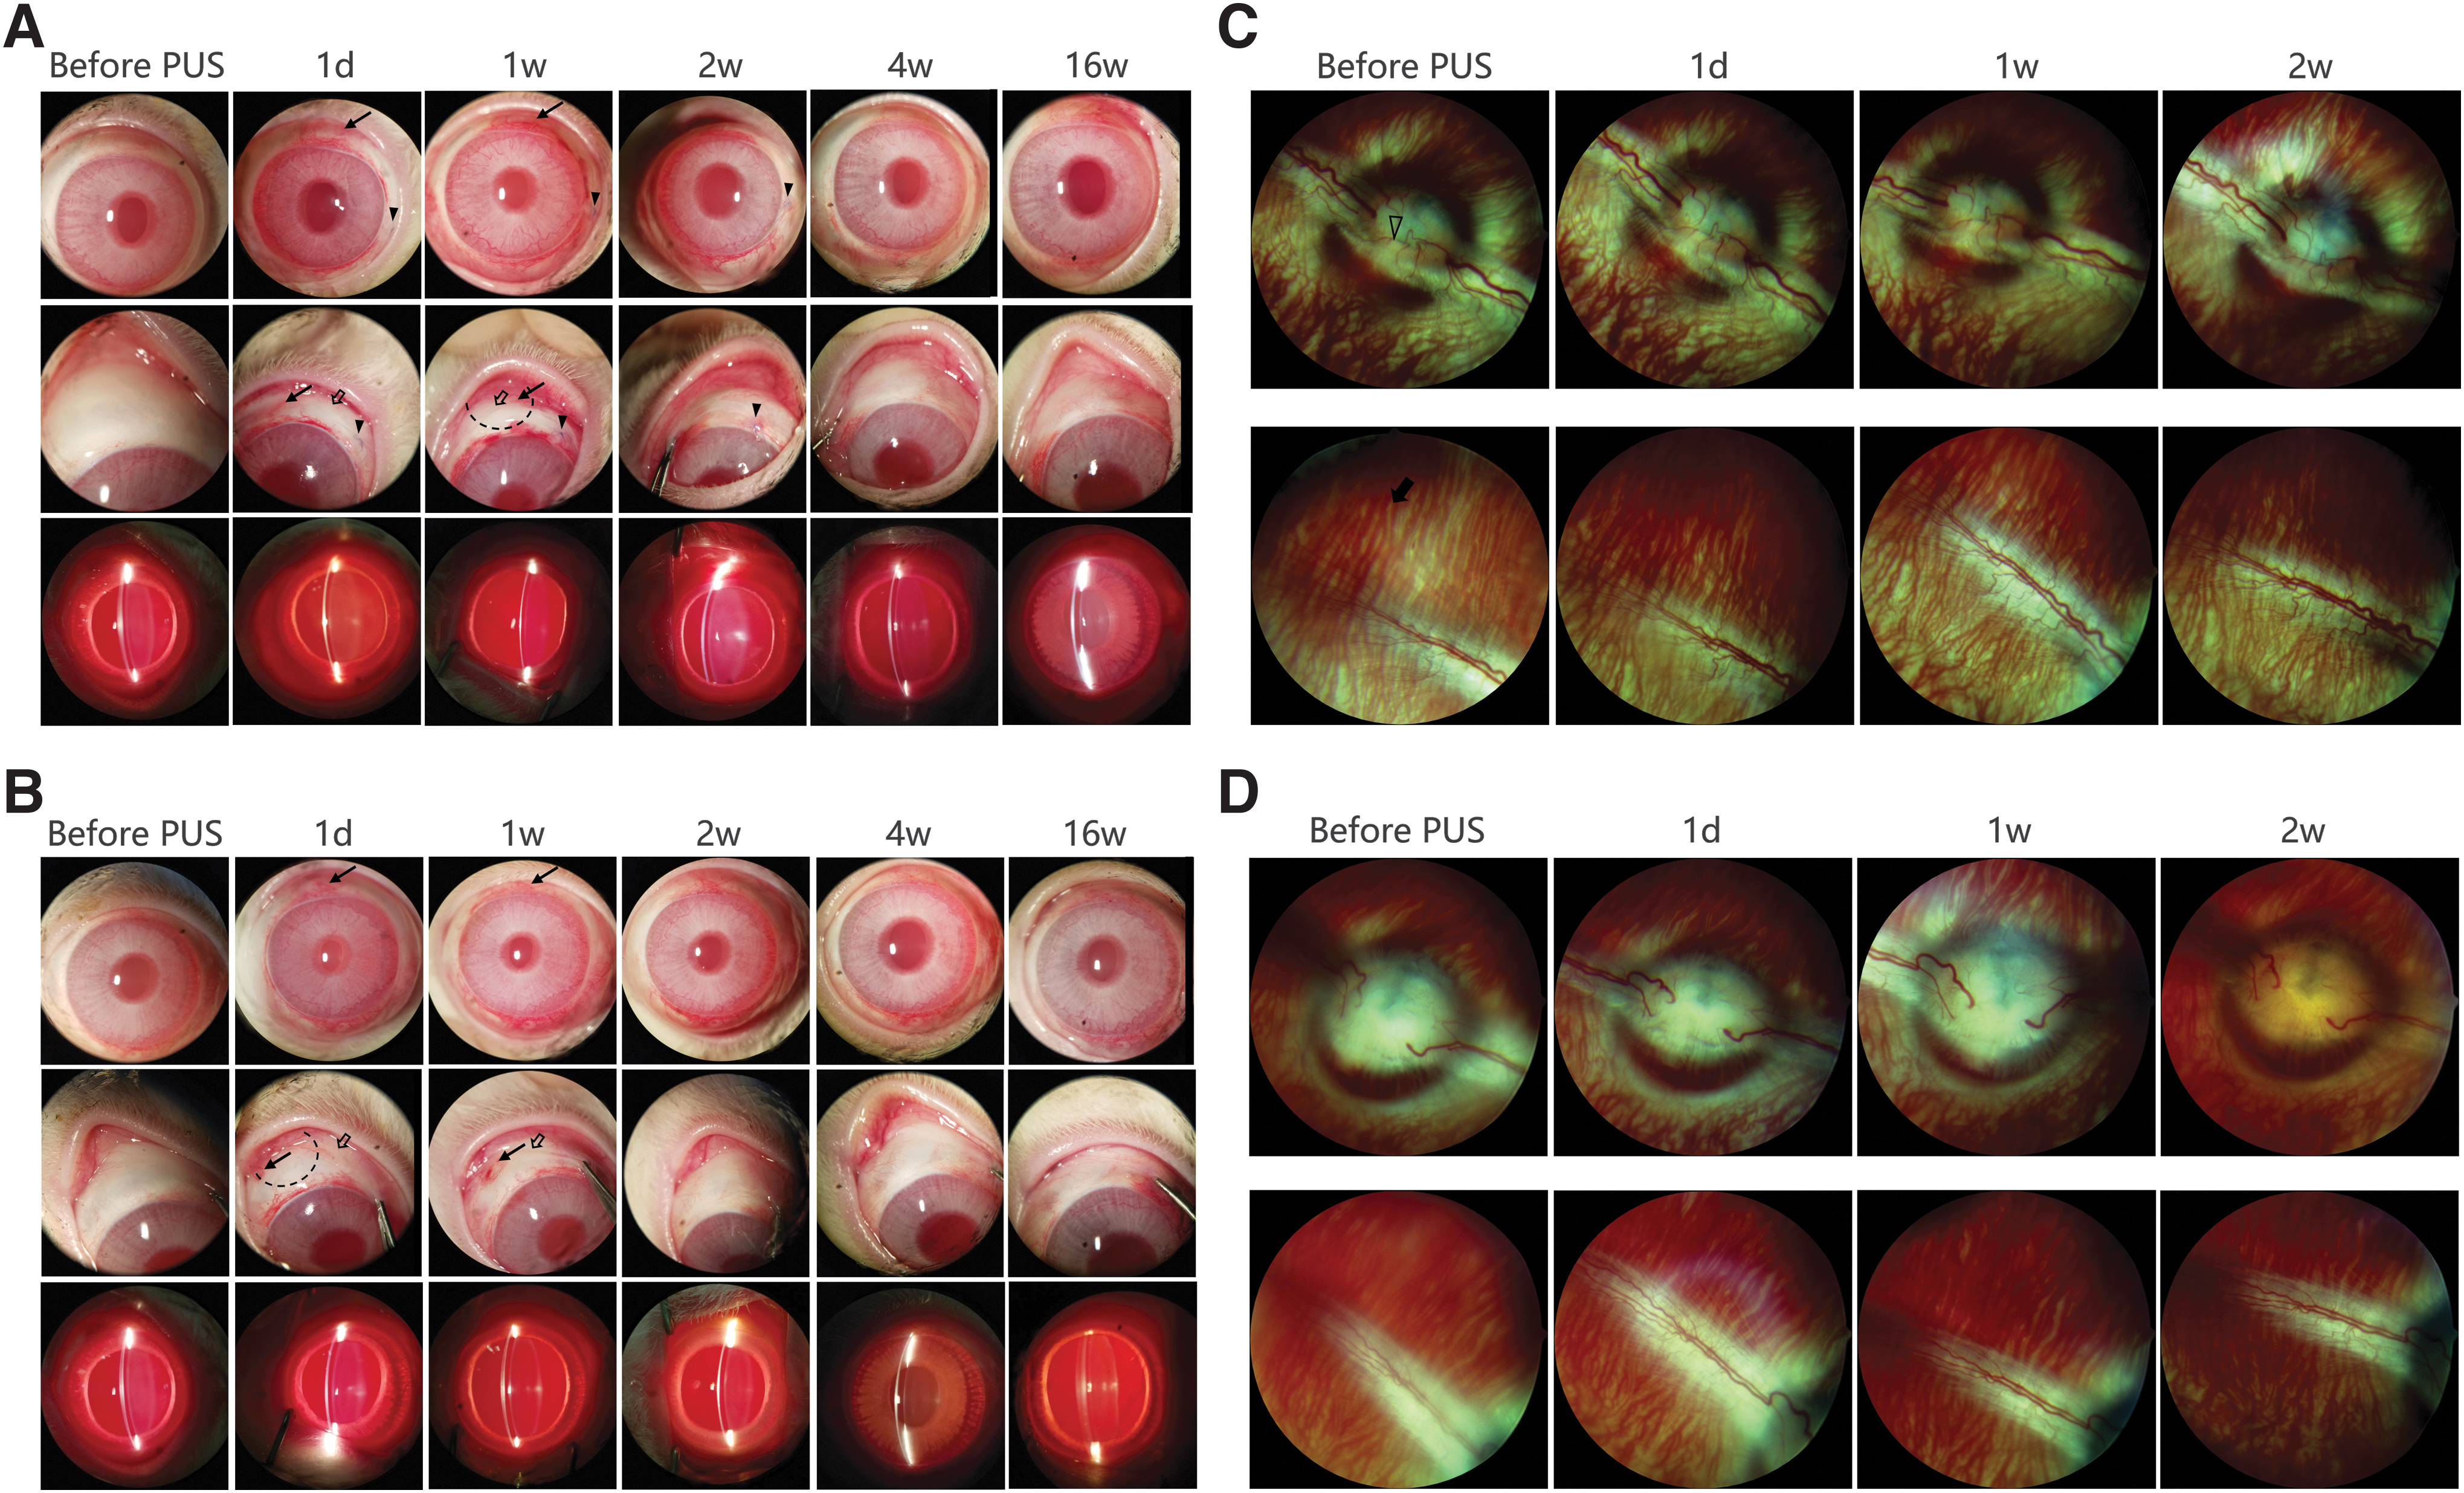
Representative photographs of the anterior segment of eyes before and 1 day, 1 week, 2 weeks, 4 weeks, and 16 weeks after transscleral
Electroretinography
The ERG did not change significantly after transscleral/transconjunctival PUS application. The normalized amplitude of a- and b-wave of ERG after transscleral/transconjunctival PUS application showed values were around 1, and no statistical significance was found among all time points (P > 0.05), indicating that transscleral/transconjunctival PUS did not affect retinal functions (Fig. 6).
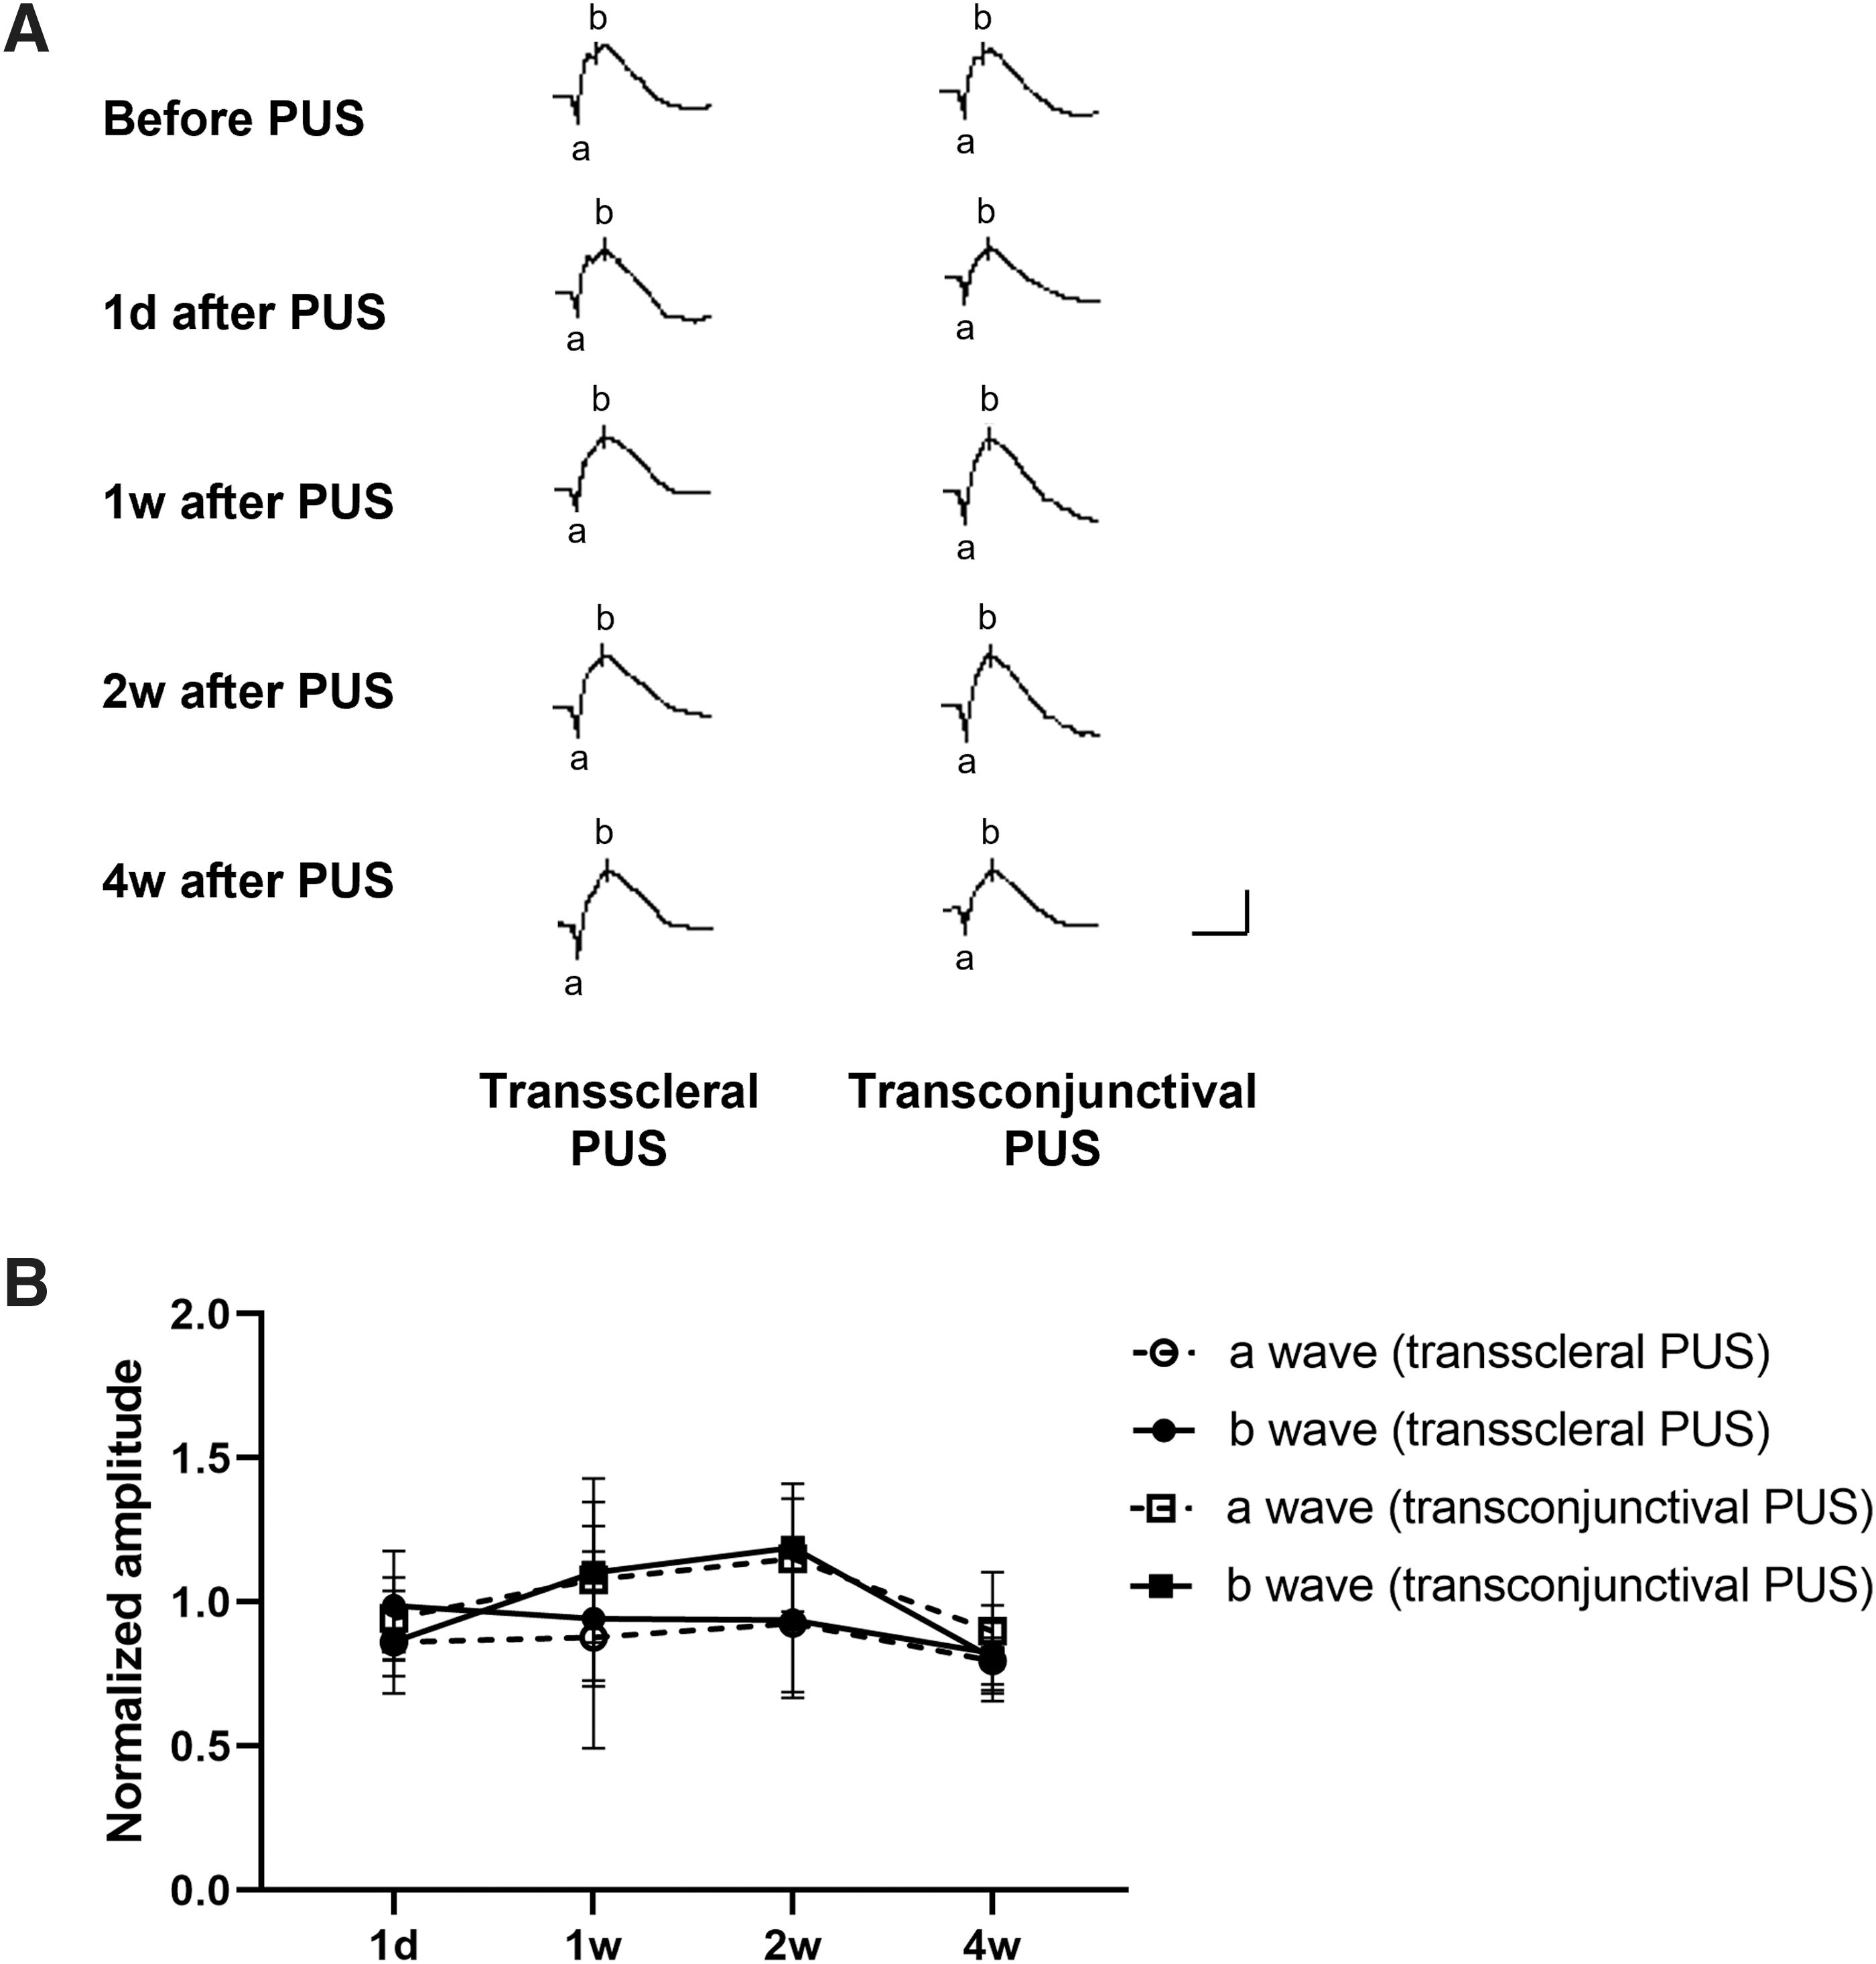
Histological analysis
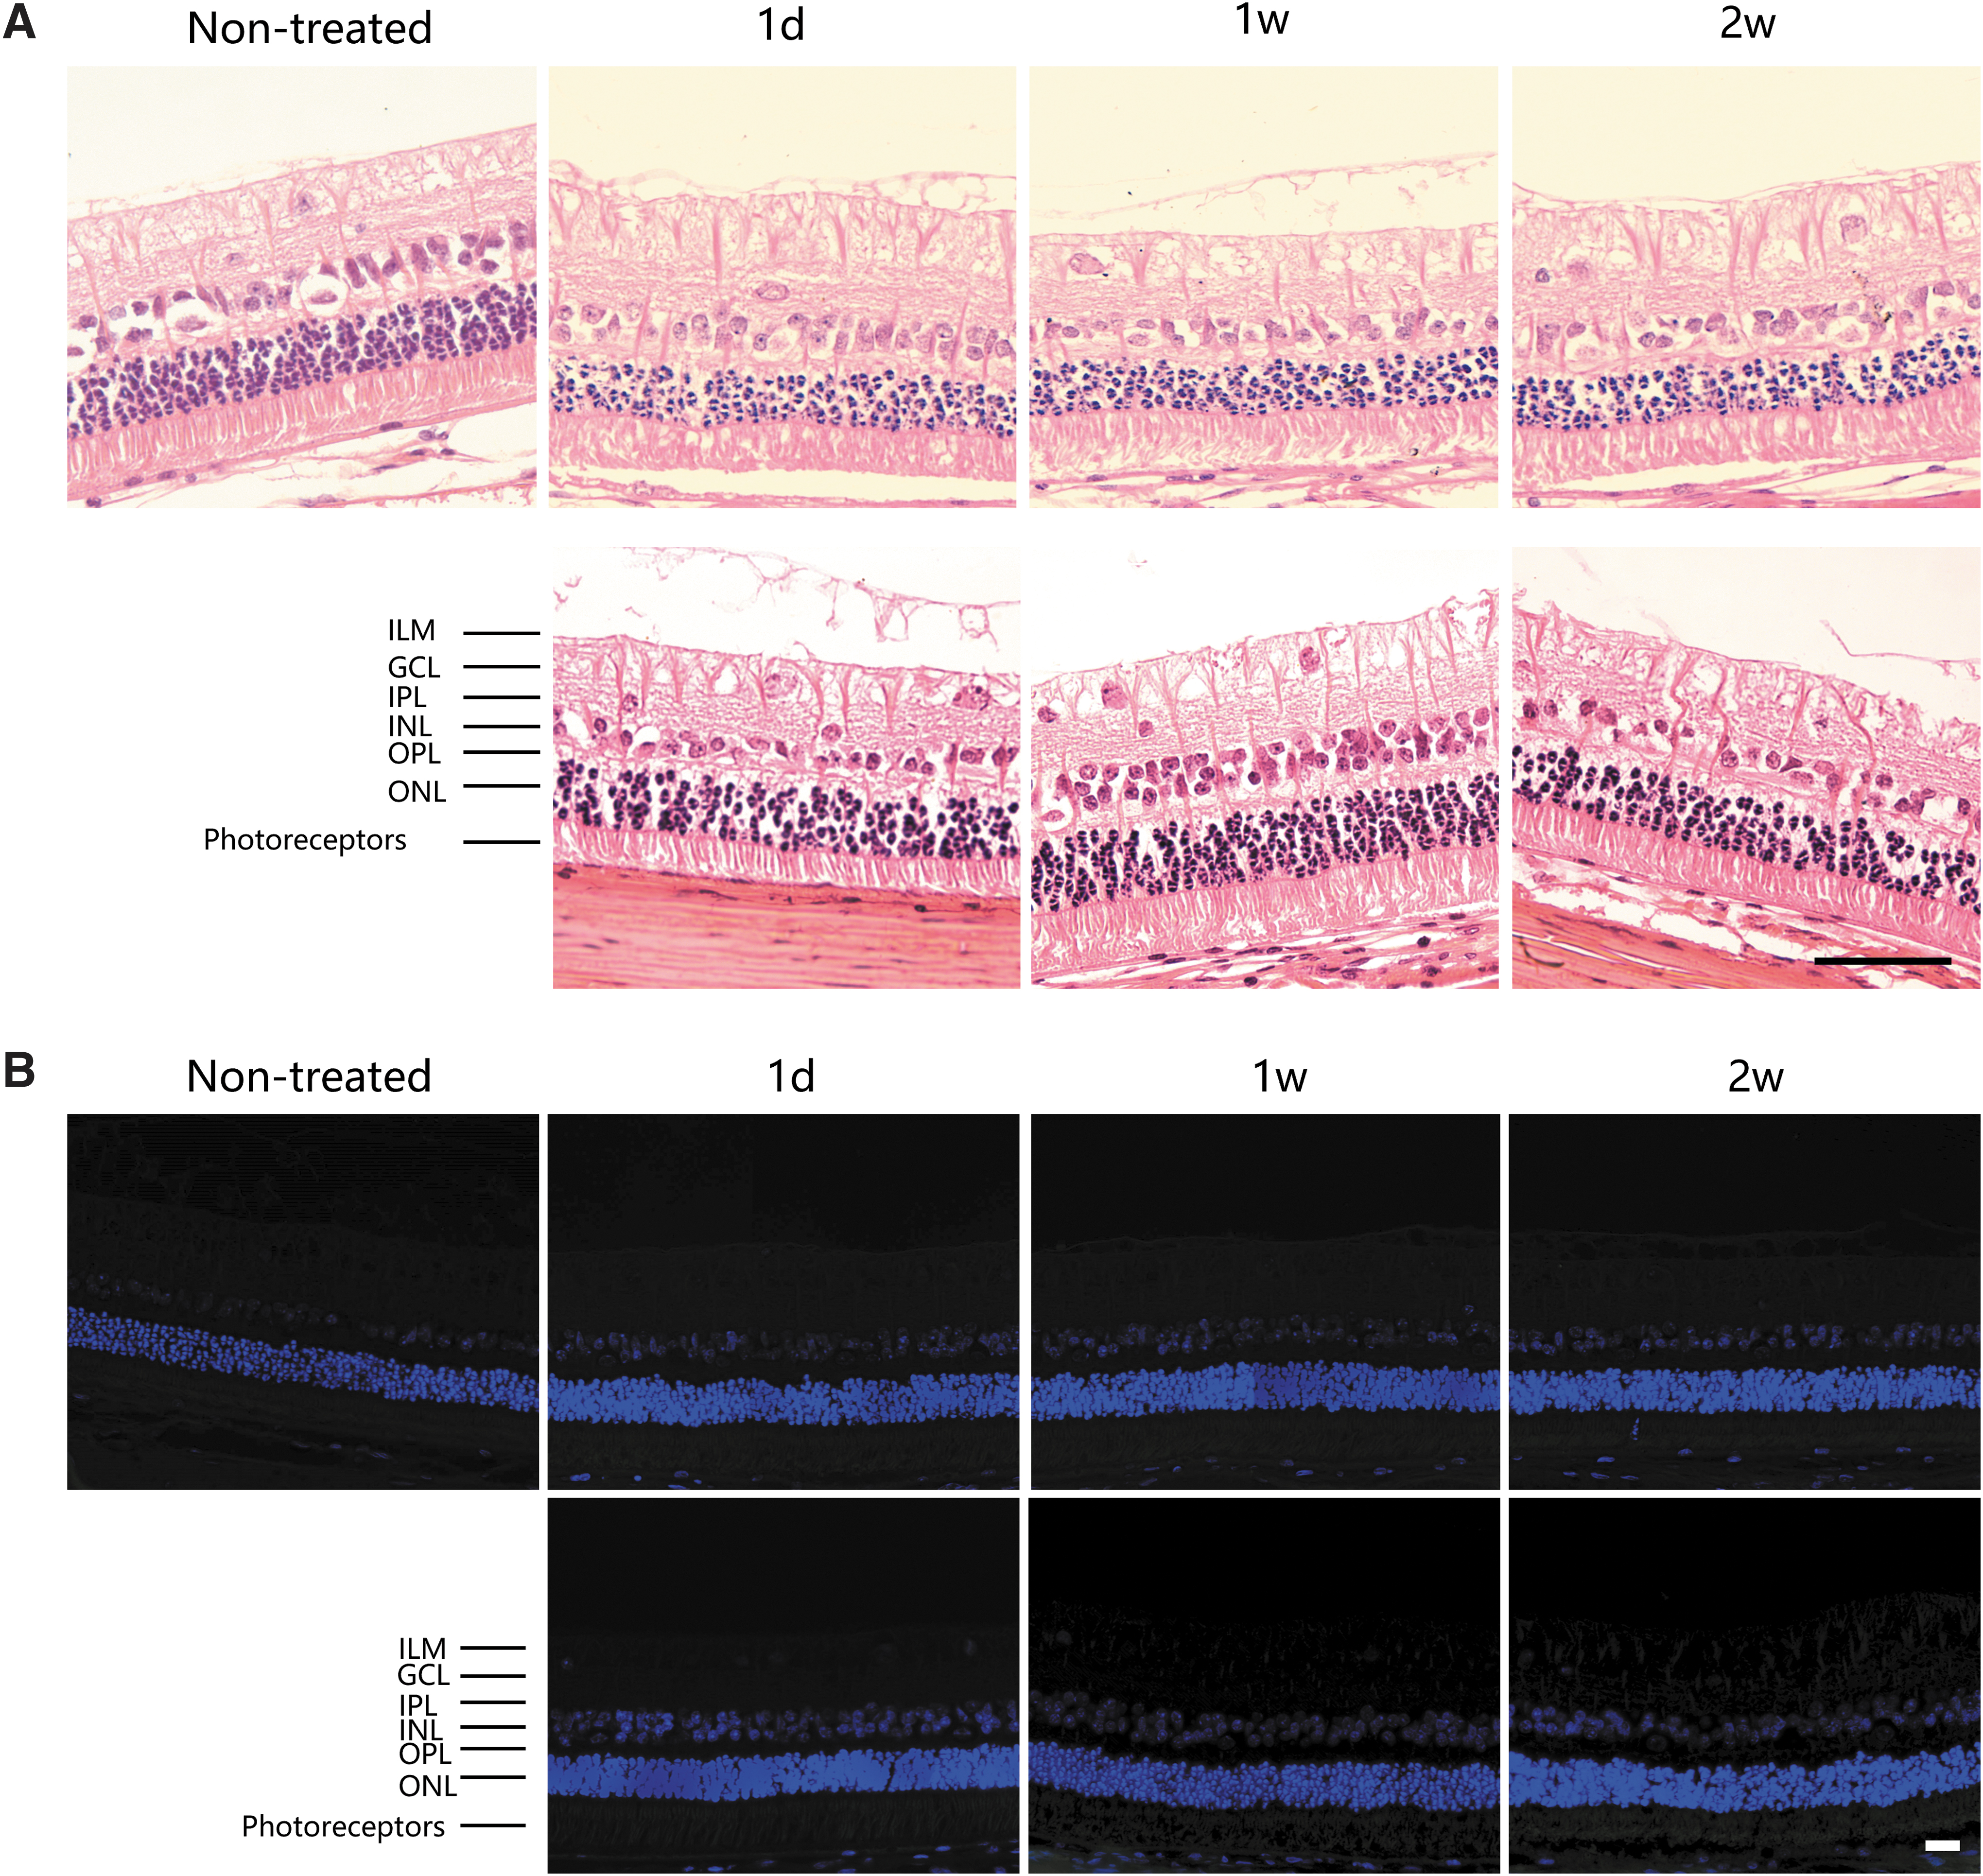
Figure 7A showed representative H&E images of retinal tissues at the PUS application site in nontreated and transscleral/transconjunctival PUS-treated eyes. After transscleral/transconjunctival PUS application, all layers of the retina were present with no evidence of pathological changes, such as deformations, degeneration, or inflammation.
TUNEL assay
Figure 7B showed representative images of retinal tissues at the PUS application site in nontreated and transscleral/transconjunctival PUS-treated eyes. After transscleral/transconjunctival PUS application, no TUNEL-positive cells were seen at all time points, indicating that transscleral/transconjunctival PUS has no obvious toxic effect on the RGCs.
Discussion
This study found that PUS application is capable of promoting NaF transport into the rabbit eye in vivo through the transscleral and transconjunctival routes without causing any detrimental effects on ocular tissues or visual function. These findings highlight the possibility that PUS application is an effective and safe method for enhancing transscleral/transconjunctival drug delivery to treat posterior eye diseases.
Ultrasound with a frequency of 1 MHz, an intensity of 2.37 W/cm2, and a DC of 30% (PUS) was utilized in this study. The ultrasound parameters were selected because our previous ex vivo experiments found that PUS treatment considerably increased transscleral drug permeation. We measured drug concentrations both in the vitreous and retina–choroid, as opposed to the previous in vivo investigation that only looked at drug levels in the vitreous. 24 In the absence of transscleral PUS application, the 40-min exposure of sclera to NaF solution could give 1.07 ± 0.15 μg/g of NaF in the retina–choroid. This is not surprising given that rabbit sclera has been reported to be permeable to drugs with molecular weights up to 150 kDa, therefore, NaF, with a molecular weight of 376 Da, could easily penetrate through the sclera to reach retina–choroid by passive diffusion. 27 In contrast, relatively little NaF (0.008 ± 0.005 μg/g) was detected in the vitreous. The low concentration of NaF in the vitreous may be due to the presence of retinal pigmented epithelium and the inner limiting membrane, which hinder drug penetration across retina to the vitreous.28–30
By applying transscleral PUS, the concentrations of NaF in the retina–choroid and vitreous were 2.45 and 3.15 times, respectively, greater than those without transscleral PUS application, indicating that the transscleral PUS application improves the transscleral drug delivery. The higher concentration of NaF in the retina–choroid is possibly because of the role of ultrasound in increasing the permeability of the sclera, the outmost barrier in the transscleral route, which has been investigated in previous studies.17,20 The increasing concentration of NaF in the vitreous may have resulted from the higher concentration gradient of NaF between the retina–choroid and the vitreous, the faster diffusion rate of NaF in the vitreous, and the increase in the permeability of retina mediated by transscleral PUS application. All factors contribute to enhancement in transscleral delivery of NaF into the vitreous. This feature was in agreement with the findings of Huang et al's investigation. 31
Their research involved adding a nanoparticle suspension to the vitreous and applying transscleral ultrasound, which increased the distribution of nanoparticles in the vitreous and increased retinal permeability. 31 Present results indicate the possibility of using transscleral PUS to increase drug delivery into posterior eye tissues.
Our results further demonstrated the ability of the PUS to deliver high concentrations of NaF to the posterior eye segment without the need to remove the conjunctiva. Transconjunctival drug delivery with the application of PUS has never been previously described. It was found that in the absence of transconjunctival PUS application, NaF could enter the retina–choroid and vitreous from the surface of conjunctiva, suggesting that the hydrophilic small-molecule tracer has high permeability through conjunctiva. Transconjunctival PUS increased the amounts of NaF in the retina–choroid and vitreous by 2.97 and 5.86 times, respectively, above the non-PUS group. The concentrations of NaF achieved in the retina–choroid applied on the sclera or conjunctiva were above levels that, when applied dexamethasone, is effective for suppressing inflammation (0.15–4.0 μg/g). 32 NaF levels in retina–choroid of transscleral and transconjunctival PUS-induced drug delivery were comparable, whereas transconjunctival PUS achieved higher NaF concentrations in vitreous than transscleral PUS.
A possible explanation for the higher level of NaF in the vitreous could be that NaF solution exposed to the conjunctiva could pass through the epithelium of conjunctiva easily, and accumulate and laterally diffuse in the loose connective tissue of conjunctiva, producing a depot effect; as a result, the larger amount of NaF could be driven to penetrate into the vitreous by transconjunctival PUS application.
In the previous in vivo experiment, the supratemporal quadrant of the sclera, 5 mm behind the limbus, was chosen as the administration zone with a radius of 2.5 mm, posing risk of injuring extraocular muscles and anterior ciliary arteries when exposing the sclera. 24 In the present study, we selected a more anterior administration location (1.5 mm behind the limbus) and a larger administration area (3.5 mm in radius). This administration site may alleviate the pull of the extraocular muscles to expose the eye, and allow a larger diffusion area and greater drug volume. These may contribute to safety and efficacy of transscleral/transconjunctival drug delivery. Further investigations are required to optimize the administration site for transscleral/transconjunctival drug delivery for clinical applications.
To assess the safety of transscleral/transconjunctival PUS application structurally and functionally, clinical observation, histology, IOP measurement, and visual function examination were conducted.
Clinical observation results demonstrated the only frequent ocular morphologic changes were slight conjunctival injection and chemosis, which disappeared within a week. The histology and TUNEL results revealed no damage to the retina or RGCs by PUS application. These results were in agreement with a previous study with no structural abnormalities in retina following transscleral ultrasound application. 24 The level of IOP reflects not only the production and drainage of aqueous humor, but also the biomechanical properties of the sclera. 33 Normal IOP indicated that PUS application did not cause changes in the biomechanical properties of the sclera, suggesting the safety of transscleral/transconjunctival PUS on the sclera. The ff-ERG provides insights into the retinal function. The ff-ERG results did not demonstrate any toxicity associated with the PUS application in the one-month observation period, indicating that the application of PUS did not impair visual function.
Previous studies have shown that the thermal effect of ultrasound is not the main mechanism for ultrasound-mediated transscleral drug delivery, and the temperature increase can result in thermal damage to ocular tissue. 21 Accordingly, ultrasound in pulsed mode was utilized instead of continuous mode to minimize the temperature rise due to ultrasound. Furthermore, 5-min intervals were set between PUS applications to reduce temperature rise.
The results showed no significant increase in the temperature on the surface of the eye following the first transscleral/transconjunctival PUS application. After the PUS was performed twice and three times, the temperature on the surface of the eye was significantly increased by about 1.5°C. Although there is no limit to the temperature rise of ocular tissue in therapeutic ultrasound, the temperature increase should be controlled as low as possible. The U.S. Food and Drug Administration advises that any increase in ocular tissue temperature brought on by diagnostic ophthalmic ultrasonography should be kept to a maximum of 1.5°C. 34 Our results fell within this range, proving that the current PUS use is thermally safe.
In recent years, sustained/controlled intravitreal and subconjunctival drug delivery implants have been increasingly developed, allowing months-long drug delivery. 35 However, devices for sustained/controlled drug delivery are difficult to manufacture and require complex procedures to implant into the vitreous or the periocular space with a high risk of complications.36,37 Also, drugs in the devices usually reach the target by passive diffusion. 38 In contrast, PUS application is less invasive, and can improve drug delivery through the transscleral/transconjunctival route. Furthermore, the application of the PUS requires less surgical skill. In the future, it can be further improved by ultrasound parameters and convenient drug delivery equipment, and can be administered by nurses and technicians, even family members and patients, improving treatment compliance.
This study is limited by the lack of positive controls to evaluate safety precisely. In addition, no repeat treatments of PUS are performed. The application of PUS should be repeated to evaluate its repeatability, safety, and tolerability in future studies. Drugs with various types and molecular weights should be delivered by PUS in the future. Longer-term and more frequent PUS administrations (mimicking any corticosteroid therapeutic regimen) need to be evaluated to conclusively prove its efficacy and safety.
Conclusions
In summary, this study shows that PUS application can promote transscleral and transconjunctival delivery of NaF to the eye safely and effectively.
Footnotes
Authors' Contributions
X.M.: Conceptualization, methodology, resources, data curation, writing—review and editing, visualization, supervision, project administration, and funding acquisition. S.Y.: Methodology, software, validation, formal analysis, investigation, data curation, writing—original draft, visualization, and project administration. H.Z.: Methodology, writing—review and editing, and supervision. S.Y.: Software and investigation. S.W.: Investigation and supervision. X.C.: Investigation and supervision. R.Z.: Resources and supervision. W.C.: Investigation. H.W.: Supervision.
Author Disclosure Statement
The authors have no conflicts of interest to declare.
Funding Information
This work was supported by the Science and Technology Commission Shanghai Municipality [20S31905900]; and the National Natural Science Foundation of China [11774382].